
 ?Mathematical formulae have been encoded as MathML and are displayed in this HTML version using MathJax in order to improve their display. Uncheck the box to turn MathJax off. This feature requires Javascript. Click on a formula to zoom.
Abstract
I study the relationship between a Chief Executive Officer (CEO)’s uncommon name and corporate innovation. Consistent with the view that individuals with uncommon names prefer being distinctive, I document a significant positive relationship between CEO name uncommonness and corporate innovation quantity but not quality. To mitigate endogeneity concerns, I use the death of the CEO as a plausible exogenous shock and find results are robust in the difference-in-differences setting. I further show that the impact on innovation output is concentrated in the areas that are well-known to the company, of low economic value, and have a low scientific impact. Overall, the findings presented in this paper suggests that the heightened innovation activities by uncommonly named CEO exacerbate the investment distortions.
Keywords:
1. Introduction
Innovation is considered to be crucial for economic growth (Aghion & Howitt, Citation1992; Romer, Citation1986). It has been well recognized that innovations are essential in creating shareholder value within private as well as public firms. What factors nurture innovation activities is an interesting question because innovation enables a firm to fully take advantage of the known growth opportunities in the industry and possibly open up new ones. Existing literature has shown that product market competition (Aghion et al., Citation2005), equity ownership (Aghion et al., Citation2013; Bena et al., Citation2017; Luong et al., Citation2017), debt financing (Chava et al., Citation2017; Gu et al., Citation2017), board characteristics (Balsmeier et al., Citation2017; J. Chen et al., Citation2018), supply chain (Chu et al., Citation2019), corporate governance (Atanassov, Citation2013; Chemmanur & Tian, Citation2018; O’Connor & Rafferty, Citation2012) among others play important roles in innovations.
For public companies, Chief executive officers (CEOs) are the highest-ranking executives and are responsible for making important decisions on business strategy and policy. Therefore, CEOs can exert significant influence on corporate innovation activities. A growing strand of literature studies the effect of CEO characteristics on corporate innovation activities (Custódio et al., Citation2019; Faleye et al., Citation2014; Galasso & Simcoe, Citation2011; Hirshleifer et al., Citation2012; Sunder et al., Citation2017). This literature focuses on CEO overconfidence, personal hobby, skill set, network connection, etc. An unexplored yet interesting facet of CEO traits in the context of innovations is the name of the CEO. This paper fills the gap. Unlike routine tasks such as mass production, innovative activities require companies to explore new and untested ideas and are more likely to fail. Prior studies document that unusually named CEOs are likely to pursue distinctive strategies and are more open to unconventional and risky ideas, probably because these CEOs perceive themselves to be different from their peers (Kang et al., Citation2021). As a result, it is interesting to investigate whether CEO’s name uncommonness has any influence on corporate innovation activities and the scope and value of such activities.
The results show that firms that have CEOs with uncommon names file more patents. To mitigate endogeneity concerns, I employ a difference-in-differences (DiD) design and test the change of innovation activities around the deaths of uncommonly named CEOs. CEO’s death is a plausible exogenous shock because such an event forces a company to replace its CEO but is highly unlikely driven by innovation activities. The results are robust using this DiD framework. These firms also spend more on R&D, which explains the increase in innovation outputs.
The increase in the patent count and R&D expenditure is consistent with the view that individuals with unique names pursue distinctive strategies by investing in innovative activities. However, the effectiveness of such a strategy is unclear. On the one hand, CEOs are successful in their careers and they seek a job that matches their individual traits. Such a distinctive strategy may improve the CEO’s job satisfaction and achieve greater success (Eggerth, Citation2015). This argument is consistent with the “person-environment fit” theory (Edwards et al., Citation2002). Under this view, exploring new ideas may provide CEOs with uncommon names a further sense of personal achievement than the exploitation of existing areas of expertise, leading to an increase in ground-breaking and high-impact corporate-level innovations, as a result. On the other hand, decisions motivated by psychological needs may lead to suboptimal choices. Prior studies show that managerial biases such as overconfidence (Heaton, Citation2002; Krüger et al., Citation2015; Malmendier & Tate, Citation2005, Citation2008), reference points and anchoring (Baker et al., Citation2012; Baker & Xuan, Citation2016), and loss aversion (Guedj & Scharfstein, Citation2004; Shefrin, Citation2001; Statman & Sepe, Citation1989) are associated with distorted investment and financing decisions.Footnote1 While CEOs may spur a greater number of innovation outputs by overinvesting in innovative projects, these projects are likely to be outside a company’s R&D investment opportunity set and therefore of low impact in nature.
These two views provide opposite predictions between CEO name uncommonness and innovation search strategy and quality. Relying on the granularity of patent data, my results show that, the average quality of the patents filed by companies, measured by the average number of citations received, does not increase with CEO name uncommonness. Moreover, the positive correlation between patent counts and CEO name uncommonness is concentrated in areas that the company is familiar with and of low impact. These results lend support to the overinvestment hypothesis and shed new light on the subtle relationship between CEO characteristics and innovation. Uncommon CEO names appear to lead to greater investment and quantity of innovation but no effect on ground-breaking ones.
In the rest of the paper, I will review the literature in Section 2, describe the sample and variable construction, and provide summary statistics in Section 3. Section 4 presents empirical results. Section 5 concludes.
2. Literature review and hypothesis development
A large body of literature in psychology studies the role of people’s names in individual behaviors. Studies show that individuals are more likely to work in jobs and companies (Pelham & Mauricio, Citation2015; Pelham et al., Citation2002), invest in stocks (Knewtson & Sias, Citation2010), move to states (Pelham & Mauricio, Citation2015), and marry other people (Jones et al., Citation2004) that share similar sounding names with their own names. The alphabetical order of name initials affects an individual’s academic performance (Nelson & Simmons, Citation2007) and political success (Urbatsch, Citation2014). Other name characteristics, such as name gender (Coffey & McLaughlin, Citation2009) and pronunciation (Laham et al., Citation2012), may affect individual decisions and performances as well.
The effect of name uncommonness or frequency is another area extensively studied in the literature. According to the “relational self” theory, a person’s self-conception is developed in relation to others (S. Chen et al., Citation2006). To the extent that a person’s name is a key anchor of identification point, the relational self-theory suggests individuals with uncommon names are more likely to develop a self-conception of being different from peers (Markus & Cross, Citation1990; Tajfel, Citation1982). In addition, individuals’ uncommon names may reflect their parents’ belief in their uniqueness. As a result, their children can potentially internalize such a belief and develop their distinctive self-conception. Meanwhile, others may view the individual with an unusual name as an unusual person (Mehrabian, Citation2001), which reinforces the self-conception of being distinctive through social interaction. These individuals are motivated to pursue extraordinary choices to differentiate themselves from others and to fulfill the self-efficacy of being special and unique (Bao et al., Citation2020; Kang et al., Citation2021; Zweigenhaft, Citation1977). For example, Zweigenhaft (Citation1977) shows that individuals of the upper class with uncommon names are more likely to be successful in certain careers. Sadowski et al. (Citation1983) document similar findings among male psychologists. Meanwhile, Bell (Citation1984) documents a significant relationship between name uniqueness and loneliness. Kalist and Lee (Citation2009) find unpopular names are associated with a higher rate of committing crimes among the juvenile population. These findings are consistent with the view that uncommonly named individuals may perceive themselves as being different from others (S. Chen et al., Citation2006).
Kang et al. (Citation2021) develop a theory of the effect of CEO name uniqueness on his/her firm’s strategic distinctiveness and test its prediction using a panel sample of public firms. They find CEO’s name uncommonness is positively associated with strategic distinctiveness, measured by a composite index based on six-dimensional indicators (namely, advertisement, inventory level, plant and equipment newness, research and development, non-production overhead, and leverage). One of the major approaches for a firm to be distinctive in the industry is by investing in technological innovations (Porter, Citation1985). Innovation activities require divergent thinking, which is by definition different from that of average individuals (An et al., Citation2016). CEOs with unique names may promote corporate innovation activities as distinctive strategies, leading toward a higher quantity of innovation output. Based on these arguments, I propose the following hypothesis:
H1: A CEO’s name uncommonness is positively associated with the quantity of corporate innovation.
However, the consequence of such a strategy is not clear. An increase in technological innovation output can help companies acquire a competitive advantage and drive growth (Porter, Citation1985). Moreover, firms seeking distinctive outcomes may choose to hire CEOs with uncommon names, whose personal attributes match the job objectives. This argument is in line with the “person-environment fit” theory (Edwards et al., Citation2002), which argues that an individual seeks a suitable environment that fulfills his/her psychological needs. Under this view, exploring new ideas may provide CEOs with uncommon names a further sense of personal achievement than the exploitation of existing areas of expertise, leading to an increase in ground-breaking and high-quality corporate innovations as a result.
Alternatively, the CEOs with uncommon names may overinvest in innovative projects which leads to an increase in low-quality innovations. Prior research finds that decisions motivated by managerial biases may lead to distortion in investment decisions. For example, in the context of capital expenditures and M&A Malmendier and Tate (Citation2005, Citation2008) show that overconfident CEOs overestimate the future returns of these investments and thus overinvest. S. S. Chen et al. (Citation2014) document similar findings for R&D activities. CEOs with uncommon names are likely to have a greater need for uniqueness (Bao et al., Citation2020; Zweigenhaft, Citation1981), which leads to additional R&D investment in innovative projects that are outside a company’s R&D investment opportunities and of low quality.
This paper joins several strands of literature. First, this paper is related to the fast-growing literature on CEO characteristics and innovation. Galasso and Simcoe (Citation2011) and Hirshleifer et al. (Citation2012) show that overconfident CEOs are more likely to pursue risky innovative projects and their firms generate a larger number of patents. Faleye et al. (Citation2014) find that better-connected CEOs spur corporate innovation activities since they have better access to network information and are more likely to be re-employed should such projects fail. Sunder et al. (Citation2017) argue that CEO’s personal hobby reflects her/his desire to explore new ideas. Consistent with this view, they find pilot CEOs engage in more innovation activities and their companies show higher innovation productivity. Custodio, Bena et al. (Citation2017) show that CEOs with a more general skill set promotes corporate innovation. However, existing studies have largely ignored the role played by the name of an individual, although a large body of psychological studies shows that a person’s name can have a significant influence on personality development, self-conception, and decisions (Bao et al., Citation2020; Kang et al., Citation2021; Zweigenhaft, Citation1977). This study contributes to the literature by filling in this gap.
This paper is also related to Kang et al. (Citation2021) who make an important attempt to link a CEO’s name and her/his company’s strategic distinctiveness. They show that the uncommonness of a CEO’s name is positively associated with strategic distinctiveness. This paper advances this line of inquiry in several ways. First, using the death of the CEO as an exogenous shock that forces a company to replace its CEO, the identification strategy presented in this paper helps to estimate the causal effect of CEO names on corporate innovation, instead of inferring the relationship based on partial correlation. Second, while Kang et al. (Citation2021) show that CEO’s name uncommonness affects a company’s strategic choices, it is not clear how successful these strategies are. This study takes advantage of the granularity of patent and citation data and investigates not only the quantity of innovation but also other dimensions, such as the quality, scope, and economic value of innovation outputs. The results in this paper show that CEOs with uncommon names are more engaged in innovation activities that exploit well-known knowledge to produce incremental findings.
3. Sample, variable construction, and summary statistics
In this section, I discuss my sample and variable construction and present summary statistics.
3.1. Sample and variable construction
My data on CEO name is extracted from proxy statements of all S&P 1500 companies between 1992 and 2020. The uncommonness of CEO’s first names is obtained from “National Data on the relative frequency of given names in the population of U.S. births” data file compiled by the U.S. Social Security Administration.Footnote2 Patent and citation data are retrieved from Patentsview.org and compiled by the U.S. Patent and Trademark Office (USPTO).Footnote3 I drop the last two years of patent data (2019–2020) to mitigate the concern of truncation problems, see details below. The patent information along with its economic value is matched to the firms in the CEO name dataset based on a matching file compiled by (Kogan et al., Citation2017).Footnote4 Institutional holding information is obtained from firms’ 13 F filings. CEO dismissal reasons (including the death of CEOs) of S&P 1500 firms are from Gentry et al. (Citation2021), who collect the information from SEC filings, press releases, and news articles. Due to data availability, the final sample consists of 38,233 firm-year observations from 3,196 firms during 1992–2018.
Following prior studies in corporate innovation, I adopt two primary measures of corporate innovation outputs based on the patents filed by a company (or “assignee”) that are eventually granted by USPTO. The first measure, the number of patents filed by a firm during a given year, captures the quantity of innovation. The second measure, the number of forward citations received per patent in the future, captures the average quality of innovation. Noticeably, patents applied in the last several years of our sample can take several months or years before being granted and observable, and receiving citations. Therefore, both patent and citation counts are subject to truncation problems. I follow prior research (Fang et al., Citation2014; Gu et al., Citation2017), and adjust the raw patent count and citation count based on the empirical distributions of application-grant lag and the citation lag, respectively. I also drop the last two years of patent data (2019–2020) to further mitigate the concern as the median value of application-grant lag is about 23 months (Popp et al., Citation2003). I follow the literature on corporate innovation (e.g., Chemmanur & Tian, Citation2018) and take natural logarithms of one plus these two variables (Ln(1+ Pat) and Ln(1+ Cit)) to avoid loss of observations with no patents.
CEO name popularity is calculated as the frequency of the CEO’s name scaled by the frequency of the most popular name by gender in the “National Data on the relative frequency of given names in the population of U.S. births” between 1880 and 2020 (Kalist & Lee, Citation2009). Following the prior studies on name uncommonness, I focus on first names since first names are likely chosen by parents and thus reflect the norm in society (Kang et al., Citation2021). To facilitate interpretation, I take the negative value of this measure, Uncommonness, to proxy for the name uncommonness. James and Mary, the most common first names during this period, have the lowest values of name uncommonness; while first names such as Jure and Safra have the highest uncommonness values.
Following prior literature (Balsmeier et al., Citation2017; Fang et al., Citation2014), I control for a vector of variables potentially correlated with corporate innovation, including LN_AT (the natural logarithm of total assets), ROA (the income before extraordinary items divided by the book value of total assets), R&D/AT (the ratio of R&D expenditures scaled by total assets, set to zero if missing), Capex/AT (capital expenditures divided by the book value of total assets), Leverage (book value of debt divided by total assets), Tobin’s Q (the market value of assets divided by the book value of assets), InstHold (the percent of institutional holding of a firm reported in form 13 F), LnAge (natural logarithm of the number of years since a firm’s first appearance on SEC filings), product market competition, HHI (the Herfindahl index based on sales revenue), and the square of the index (HHI2) to capture the non-linear effect of competition (Aghion et al., Citation2005).Footnote5 All continuous variables are winsorized at the 1st and 99th percentile to mitigate the concern that the findings in the paper are driven by large outliers. Appendix A provides detailed definitions of the variables.
3.2. Summary statistics
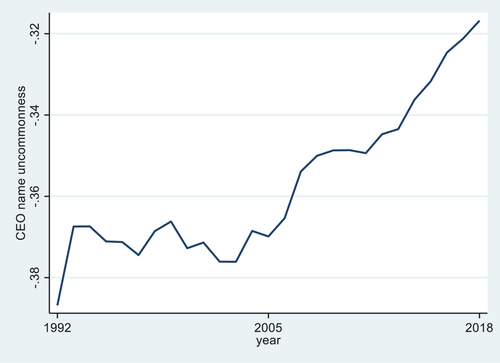
Table Panel A reports the summary statistics of the main variables based on the final sample of 38,233 firm-year observations during 1992–2018. On average, the firms in the final sample filed (and eventually granted) 10.67 patents in a given year. These patents receive 19.59 forward citations on average.Footnote6 The average CEO name uncommonness index is −0.36 with a standard deviation of 0.35. Noticeably, CEO name uncommonness in the sample is increasing over time, as shown in Figure , which is consistent with prior findings (Twenge et al., Citation2010) and likely reflects the general trends of rising individualism (Cai et al., Citation2019). Meanwhile, compared to the average name uncommonness score in the general population, CEOs are significantly more likely to have common names, as shown in Panel B. However, CEO given names of 100 companies with the most patents granted are significantly more uncommon on average as shown in Panel C. These uncommon names include “Rami”, “Darius”, and “Safra”. An average firm in the sample has a total asset of $1.79 billion, leverage of 23%, and Tobin’s Q of 2.00.
Table 1. Summary statistics. This table reports the summary statistics of variables used in this study. The sample consists of firm-year observations between 1992 and 2018. All continuous variables are winsorized at the 1st and 99th percentile. Panel A provides summary statistics of the full sample. Panel B compares the name uncommonness of CEO names with the first names in the general population. Panel C compares the average name uncommonness of all CEO names with that of the CEOs of 100 companies with the most patents granted. Significance level of the test of the differences between the means of the two samples is denoted next to the column “Difference”
Figure 1. CEO name uncommonness by year.
4. Empirical results
4.1. Baseline OLS regressions
I first assess the effect of CEO name uncommonness on innovation in a multivariate regression by estimating the following equation:
where i indexes company, t indexes time, and n equals 1, 2, or 3. The variable of interest, Uncommonness is the uncommonness measure of the CEO’s name constructed based on the frequency of first names in the population. The dependent variable Ln(1+ Pat)i,t+n, is the natural logarithm of one plus the number of patents filed (and eventually granted) in one (t + 1), two (t + 2), and three (t + 3) years. The dependent variable LnCitei,t+n, is the natural logarithm of one plus the average number of citations received per patent in one (t + 1), two (t + 2), and three (t + 3) years. Following Balsmeier et al. (Citation2017) and Fang et al. (Citation2014), I control for a vector of firm-level variables potentially correlated with corporate innovation as described in Section 3.2. I include firm fixed effects, Firmi, and year fixed effects, Yeart, to control for unobservable firm-level characteristics and time trends. Standard errors clustered at the CEO-firm pair are reported in the parentheses below coefficient estimates.
The regression results are reported in Table . In all of the columns (1)—(3), the coefficient estimates of Uncommonness are positive and statistically significant at the 5% level. This evidence suggests that uncommonly named CEOs are associated with a higher level of innovation output. The result in column (1) indicates one standard deviation increase in name uncommonness (0.35) is associated with about a 3% (=0.35*7.5%) increase in patent count in year t + 1. In columns (4)—(6), I replace the dependent variable with citations per patent and find that the coefficient estimates on Uncommonness are not significant in any of these three columns. The findings suggest that firms with uncommonly named CEOs generate a similar level of patent quality as those with CEOs who have common names.
Table 2. CEO name uncommonness and corporate innovation: OLS regression. This table presents the results of multivariate regressions that estimate the effect of CEO name uncommonness on corporate innovation in a pooled OLS framework. The sample consists of firm-year observations between 1992 and 2018. I estimate the following equation: The dependent variable Ln(1+ Pat)i,t+n, is the natural logarithm of one plus the number of patents filed (and eventually granted) in one (t + 1), two (t + 2), and three (t + 3) years, and results are reported in columns (1)—(3), respectively. The dependent variable LnCitei,t+n, is the natural logarithm of one plus the average number of citations received per patent in one (t + 1), two (t + 2), and three (t + 3) years, and results are reported in columns (4)—(6), respectively. Uncommonnessi,t is an uncommonness measure of the CEO’s name constructed based on the frequency of first names in the population. Year fixed effects Yeart and firm fixed effects Firmj are included in all regressions. All other variables are as defined in Appendix A. Standard errors clustered by CEO-firm pairs are reported in parentheses. ***, **, and * indicate significance at the 1%, 5%, and 10% level, respectively
To check the robustness of the results, I also use different measures of name uncommonness. In particular, I calculate the name uncommonness using the data during the sample period (i.e., 1992–2018) or since the birth year of the oldest CEO in the sample. The results are similar using these alternative measures and are reported in Appendix B.
4.2. Endogeneity issue
In this section, I attempt to address the identification issue and establish causality. It is possible that my main results in Section 4.1 is driven by omitted variable or reverse causality problems. For example, it is possible that, due to the need to make strategic changes in the future, an innovative and growing company may find it desirable to hire a CEO with an uncommon name. To mitigate this endogeneity concern, I employ the difference-in-differences (DiD) approach (Bertrand & Mullainathan, Citation2003) and use the death of the CEO as a plausible exogenous shock, following prior literature (Graham et al., Citation2020; Johnson et al., Citation1985; Quigley et al., Citation2017). A CEO’s death likely satisfies the exogeneity condition because this event forces a company to replace its CEO (and thus change the name of the CEO) but is highly unlikely driven by innovation activities. Therefore, it provides an opportunity to identify the effect of CEO name uncommonness. Specifically, I compare the innovation output of a sample of treatment firms (with uncommonly named CEOs) to the innovation output of control firms (with commonly named CEOs), before and after the death of (and hence the turnover of) the CEO. The treatment and control groups consist of firm-year observations around the death of a CEO whose name uncommonness is above and below the sample median, respectively. By constructing the subsamples in this way, the DiD approach can isolate the effects of uncommonly named CEOs and mitigate endogeneity concerns for several reasons. First, it rules out omitted trends of innovation activities in both the treatment and control groups. By comparing two subsamples over the same time period, the comparison avoids the problem of omitted time trends. Second, the DiD method rules out time-invariant unobserved differences between the treatment and the control group.
For this purpose, I restrict the sample to the observations for both treatment and control firms for a five-year window centered on CEO turnover (death), using the data compiled by Gentry et al. (Citation2021). For each case, I require at least one year of observation before and after the event. 75 cases of CEO death were identified during the sample period. The sample reduces to 319 firm-year observations. Then I estimate the following model within this sample:
where Treati is a dummy that equals one for treatment firms (departing CEO’s name uncommonness is above sample median) and zero for control firms (departing CEO’s name uncommonness is below sample median). Postt is a dummy variable that equals one for years on or after the CEO’s departure. I include both year-fixed effects and industry-fixed effects in the regressions. The regression results estimating Equationequation (2)(2)
(2) are presented in Table .
Table 3. Difference-in-differences test. This table reports the results of a differences-in-differences test on how patents produced in a firm are affected following the departure of a CEO with an uncommon name. Using a sample of all firms that experienced a sudden death of its CEO over the entire sample period of 1992–2018, I retain firm-year observations for a five-year window centered in the CEO death year and estimate the following model: where Treati is a dummy that equals one for treatment firms (departing CEO’s name uncommonness is above sample median) and zero for control firms (departing CEO’s name uncommonness is below sample median). Postt is a dummy variable that equals one for years on or after the CEO’s departure. Year fixed effects Yeart and industry fixed effects Industryi are included in all regressions. All other variables are as defined in Appendix A. Standard errors clustered by CEO-firm pair are reported in parentheses. ***, **, and * indicate significance at the 1%, 5%, and 10% level, respectively
The coefficient estimate of the key variable is β1. If the uncommon named CEO is driving the innovation, I expect innovation output to drop after the death of the CEO, i.e., to be negative. In column (1) where the dependent variable is
, I find the coefficient estimates of β1 are indeed negative and statistically significant, suggesting that compared to the control group, firms in the treatment group experience a significant reduction in patent counts after their CEO’s death. Nevertheless, I find little evidence with respect to the effect on citation per patent in column (2). Overall, the results suggest that my findings are robust after controlling for endogeneity issues such as omitted variables.
Next, I show the innovation dynamics of the DiD results in a regression framework to check whether the sample fulfills the parallel assumption that is crucial to DiD approach, namely, the trends in innovation outputs should be similar between the treatment and control sample in the absence of the treatment (i.e., death of the uncommonly named CEO). In particular, I use the same sample as described above but estimate the following model:
where Beforet−2 is a dummy that equals one if a firm-year observation is from two years before the death of the CEO and zero otherwise. Currentt is a dummy that equals one if a firm-year observation is from the year of the CEO’s death (year 0) and zero otherwise. Aftert1 and Aftert2 are dummy variables that equal one if a firm-year observation is from one or two after the death of the CEO (year t + 1 or t + 2) and zero otherwise, respectively. Therefore, the base year is the year immediately before the CEO’s death (year t-1). The coefficient estimates of key variables are β1,β2,β3, and β4. If the negative relation between an uncommonly named CEO’s death and firm innovation is driven by unparallel trends, for example, due to reverse causality, then we should observe significant and negative coefficient estimates of β1.
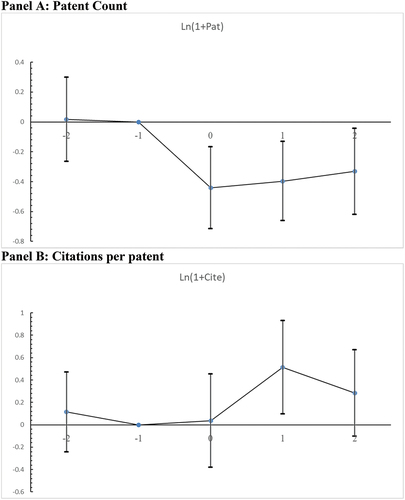
I visualize these coefficient estimates in Panels A and B of Figure for models of Ln(1+ Pat) and Ln(1+ Cite), respectively. Figure shows that in both panels, the coefficient estimates for the pre-CEO death period () are not statistically significantly different from zero. It suggests that there are no pre-existing trends that contribute to my results. In contrast, the coefficient estimates for the post-CEO death period (
,
, and
) are negative and statistically significant at the 10% level in Panel A, implying that patent count declines significantly after the death of uncommonly named CEO, and this decrease persists for up to 2 years. Surprisingly, the effect of the CEO’s death is almost immediate, which is unlikely caused by R&D activities. This is possibly due to the changes in the patenting process of the company, e.g., the firm’s scientists and lawyers are under lower pressure for finding patentable technologies (Balsmeier et al., Citation2017). On the other hand, in Panel B, I observe no significant drop in the citations per patent after the death uncommonly named CEO, with a marginal increase in the year immediately after.
Figure 2. Dynamics of innovation output around the death of uncommonly named CEO.
Overall, the results in the DiD analyses suggest that there is a positive, causal effect of hiring an uncommonly named CEO on firm innovation quantity, but it does not appear to improve innovation quality.
4.3. Innovation inputs
Next, I turn to the inputs of innovation and investigate the reason behind the positive association between CEO name uncommonness and corporate innovation. I repeat the baseline regressions as in EquationEquation (1)(1)
(1) but replace the dependent variable with two measures of innovation inputs: R&D expenditures divided by total assets and the annual asset growth rate. The asset growth rate is included because, in addition to investing in R&D activities internally, a manager can enhance innovations through mergers and acquisitions (Bena & Li, Citation2014), which can be captured by the growth of total assets. The results are reported in Table . In columns (1) to (3) where the dependent variable is R&D expenditures, the coefficient estimates of Uncommonness are all significantly positive; while in columns (4) to (6), where the dependent variable is the asset growth rate, I find little significance. These results suggest that CEOs with uncommon names promote innovation output via increasing investments in R&D.Footnote7
Table 4. Investment in innovation. This table shows the effect of CEO name uncommonness on corporate innovation input measures. Innovation inputs are measured by two variables. The first measure R&D/AT is R&D expenditures divided by total assets and the results are reported in columns (1)-(3). The second measure is Asset Growth, the annual asset growth rate, and the results are reported in columns (4)-(6). All other variables are as defined in Appendix A. Standard errors clustered by CEO-firm pair are reported in parentheses. ***, **, and * indicate significance at the 1%, 5%, and 10% level, respectively
4.4. Groundbreaking vs incremental patents
My results so far suggest that CEOs with uncommon names are likely to promote R&D investment and enhance innovation output quantity, measured by patent count, but do not have any effect on the average quality of innovation, measured by citations per patent. However, innovation is complex, and the raw patent counts and citation counts do not adequately reflect the quality of innovation and differentiate routine inventions from groundbreaking ones (Balsmeier et al., Citation2017). In particular, firms may pursue strategies that lead to impactful breakthroughs via exploration of unknown areas or exploit well-known knowledge to produce incremental findings, which is less risky but also of less quality. A significant benefit of using patent data is its level of granularity, which allows the investigation of multiple aspects of corporate innovation quality (Lerner & Seru, Citation2014). To this end, I follow prior studies (Balsmeier et al., Citation2017; Kogan et al., Citation2017) and examine the effect of CEO name uncommonness on patents in the known vs unknown areas, the proximity of patent classes, economic value, and citation distributions.
Patents filed in the area that is previously unknown to the firm are likely to be riskier and can potentially open up breakthroughs. Therefore, I first compute the number of patents in a known (unknown) area, which is defined as the ones that are in technology classes where the firm has (has not) applied for and eventually granted before a given year. The results are reported in Table . The coefficient estimates of Uncommonness are positive and significant in columns (1)—(3), where the dependent variable is Ln(1+ Known), however, I observe no significance in columns (4)-(6), where the dependent variable is Ln(1+ Unknown), suggesting that the positive effect of CEO name uncommonness is almost entirely driven by producing innovation in well-known areas.
Table 5. Patents in known vs unknown classes. This table shows the effect of CEO name uncommonness on the number of patents in previously known vs unknown areas. The dependent variable Ln(1+ Known) is the natural logarithm of the number of patents in technology classes that the firm has applied for and eventually granted before a given year. The dependent variable Ln(1+ Unknown) is the natural logarithm of the number of patents in technology classes that the firm has never applied for and granted before a given year. All other variables are as defined in Appendix A. Standard errors clustered by CEO-firm pair are reported in parentheses. ***, **, and * indicate significance at the 1%, 5%, and 10% level, respectively
While the above analysis provides initial evidence, I also test the effect on the following continuous measure of patent technological proximity between newly filed patents and those filed before.
where is the percentage of patents in technological class n filed by firm i in year t, and
is the percentage of patents in technological class n filed by firm i before year t (Balsmeier et al., Citation2017; Jaffe, Citation1989). A higher value of proximity indicates the newly filed patents are in similar technology areas as the existing patent portfolio. Results are reported in columns (1)—(3) of Table . Consistent with the findings in Table , the proximity measures in one, two, and three years are positively correlated with CEO name uncommonness, indicating these patents are likely in know areas.
Table 6. Patents proximity and economic value. This table shows the effect of CEO name uncommonness on the patent technological proximity between newly filed patents and those filed before as well as the patent’s economic value. The dependent variable Proximity is a continuous measure of patent technological proximity between newly filed patents and those filed before (Balsmeier et al., Citation2017; Jaffe, Citation1989). The dependent variable is the moving average of the economic value for the patents filed in a three-year window (t + 1 to t + 3) based on the patent value data compiled by (Kogan et al., Citation2017). All other variables are as defined in Appendix A. Standard errors clustered by CEO-firm pair are reported in parentheses. ***, **, and * indicate significance at the 1%, 5%, and 10% level, respectively
Although patent technological proximity is indicative of innovativeness and therefore quality of patents, one reasonable concern is that exploitations of known areas could be of more economic value to the filing firm, since these activities are less likely to fail. To address such a possibility, I use the economic value information of patents complied by Kogan et al. (Citation2017), who estimate the dollar values of individual patents filed by publicly listed companies till 2020 based on stock market reaction to the announcement of patent grant. Since firms may file different numbers of patents, I take the moving average of the economic value for the patents filed in a three-year window (t + 1 to t + 3). The resulting measure is coded as . The result is reported in column (4) of Table . I find that CEO name uncommonness is negatively associated with the average dollar value of patents in the three years after a given year, suggesting that CEO name uncommonness is associated with a reduced economic value of patents, in addition to a narrower innovation scope in known areas.
4.5. Citation distribution
To shed more light on the scientific impact of patents, I now turn to the citation distributions of patents (Balsmeier et al., Citation2017). The purpose is to identify patents that are highly impactful, moderately successful, and of low quality. Specifically, I sort patents into three groups based on the citation distribution of all patents filed in the same technological class in a given year. Patents belonging to the top quartile are coded as high-impact patents; those belonging to the bottom quartile are coded as low-impact patents, and all other patents are coded as middle-impact patents. Then I count all patents in these three categories and re-estimate EquationEquation (1)(1)
(1) but with the natural logarithm of one plus these patent counts as dependent variables. The results are reported in Table . For brevity, I only report the coefficient estimates of Uncommonness, although all controls along with year-fixed effects and firm-fixed effects are included in the model.
Table 7. Citation distributions. This table shows the effect of CEO name uncommonness on the number of patents with different scientific impacts based on the citation distributions. Specifically, I sort patents into three groups based on the citation distribution of the patents filed in the same technological class in a given year. The dependent variable Ln(1+ High Impact) is the natural logarithm of one plus the number of patents that belong to the top quartile of citation distributions, and the results are presented in Panel A. Ln(1+ Mid Impact) is the natural logarithm of one plus the number of patents that belong to the middle 50% of citation distributions, and the results are presented in Panel B. Ln(1+ Low Impact) is the natural logarithm of one plus the number of patents that belong to the bottom quartile of citation distributions, and the results are presented in Panel C. All control variables in EquationEquation (1)(1)
(1) and year fixed effects and firm fixed effects are included. All other variables are as defined in Appendix A. Standard errors clustered by CEO-firm pair are reported in parentheses. ***, **, and * indicate significance at the 1%, 5%, and 10% level, respectively
In Panel A and Panel B of Table , I find no effect of CEO name uncommonness on the patents with high- or mid-impacts. However, the largest influence is found in Panel C where the dependent variable is the number of low-impact patents. The coefficient estimates in Panel C are positive and highly significant at the 1% level. Moreover, the magnitude levels of the coefficients are the largest among all three panels. This evidence implies that uncommonly named CEOs are likely to promote innovation strategy that leads to inventions with lower scientific impacts.
5. Conclusion
In this paper, I investigate the relationship between CEO name uncommonness and corporate innovation. I join a growing body of literature that studies the effect of manager characteristics on corporate innovation. Consistent with the conjecture that CEOs with uncommon names prefer being distinctive by investing in innovative activities (Kang et al., Citation2021), I document a significant positive relationship between CEO name uncommonness and corporate innovation quantity but not quality. To mitigate endogeneity concerns, I use the death of the CEO as a plausible exogenous shock and find results are robust in the difference-in-differences setting. The increase in innovation output is likely driven by an increase in R&D investments. Moreover, I find that the impact of an uncommonly named CEO on innovation output is concentrated in the areas that are well-known to the company, of low economic value, and have a low scientific impact. Overall, the findings presented in this paper suggests that the heightened innovation activities by uncommonly named CEO exacerbate the investment distortions.
This study has several practical implications. In particular, the findings allow the board and investors to better predict corporate innovation strategy and its outcome. Of particular importance is the results regarding the economic value and scope of innovations. It suggests that CEOs with uncommon names may potentially be a good fit for companies that seek to pursue an exploitive innovation strategy.
There are several limitations of this study. While patent and citation data provides a high-quality measurement of corporate innovation activities and allows investigation of the scope and impact of innovation, it might suffer measurement errors and firms may choose not to patent. The findings in this study are based on observational data analyses, however, data availability prevents me from exploring the microprocess through which name uncommonness affects corporate innovation. Future studies may experimentally manipulate the focal variables of interest in a laboratory setting to better understand the underlying channel. Another limitation is that this study only focuses on one aspect of strategic distinctiveness, namely, corporate innovation activity and its outcomes, due to data limitations. Future research may investigate the outcomes of other dimensions of distinctive strategies employed by CEOs with uncommon names.
Disclosure statement
No potential conflict of interest was reported by the author(s).
Additional information
Funding
Notes
1. See, Baker and Wurgler (Citation2013) for a survey of this literature.
4. The extended matching file (till 2020) is retrieved from https://github.com/KPSS2017/Technological-Innovation-Resource-Allocation-and-Growth-Extended-Data. I thank the authors for making the file publicly available.
5. In main analyses, all right-hand-side variables are lagged by one, two, or three years.
6. For firm years with zero patents, I code the citation per patent as missing. The results are qualitatively similar if I replace the missing value with zeros. Results are available upon request.
7. In these analyses, observations with missing R&Ds are replaced with zeros. However, the results are qualitatively similar if I do not replace them with zeros. Therefore, the results presented here are not likely driven by the missing R&D issues described in Koh and Reeb (Citation2015). Results are available upon request.
References
- Aghion, P., Bloom, N., Blundell, R., Griffith, R., & Howitt, P. (2005). Competition and innovation: An inverted-U relationship. The Quarterly Journal of Economics, 120(2), 701–28. https://doi.org/10.1093/qje/120.2.701
- Aghion, P., & Howitt, P. (1992). A model of growth through creative destruction. Econometrica, 60(2), 323–351. https://doi.org/10.2307/2951599
- Aghion, P., Van Reenen, J., & Zingales, L. (2013). Innovation and institutional ownership. American Economic Review, 103(1), 277–304. https://doi.org/10.1257/aer.103.1.277
- An, D., Song, Y., & Carr, M. (2016). A comparison of two models of creativity: Divergent thinking and creative expert performance. Personality and Individual Differences, 90, 78–84. https://doi.org/10.1016/j.paid.2015.10.040
- Atanassov, J. (2013). Do hostile takeovers stifle innovation? Evidence from antitakeover legislation and corporate patenting. The Journal of Finance, 68(3), 1097–1131. https://doi.org/10.1111/jofi.12019
- Baker, M., Pan, X., & Wurgler, J. (2012). The effect of reference point prices on mergers and acquisitions. Journal of Financial Economics, 106(1), 49–71. https://doi.org/10.1016/j.jfineco.2012.04.010
- Baker, M., & Wurgler, J. (2013). Behavioral corporate finance: An updated survey. In George, M. C., Milton, H., & Rene, M. S. (Eds.) Handbook of the economics of finance (Vol. 2, pp. 357–424). Elsevier.
- Baker, M., & Xuan, Y. (2016). Under new management: Equity issues and the attribution of past returns. Journal of Financial Economics, 121(1), 66–78. https://doi.org/10.1016/j.jfineco.2016.03.001
- Balsmeier, B., Fleming, L., & Manso, G. (2017). Independent boards and innovation. Journal of Financial Economics, 123(3), 536–557. https://doi.org/10.1016/j.jfineco.2016.12.005
- Bao, H., Cai, H., DeWall, C., Gu, R., Chen, J., & Luo, Y. (2020). Name uniqueness predicts career choice and career achievement. https://doi.org/10.31234/osf.io/53j86
- Bell, R. A. (1984). Relationship of loneliness to desirability and uniqueness of first names. Psychological reports, 55(3), 950. https://doi.org/10.2466/pr0.1984.55.3.950
- Bena, J., Ferreira, M. A., Matos, P., & Pires, P. (2017). Are foreign investors locusts? The long-term effects of foreign institutional ownership. Journal of Financial Economics, 126(1), 122–146. https://doi.org/10.1016/j.jfineco.2017.07.005
- Bena, J., & Li, K. (2014). Corporate innovations and mergers and acquisitions. The Journal of Finance, 69(5), 1923–1960. https://doi.org/10.1111/jofi.12059
- Bertrand, M., & Mullainathan, S. (2003). Enjoying the quiet life? Corporate governance and managerial preferences. Journal of Political Economy, 111(5), 1043–1075. https://doi.org/10.1086/376950
- Cai, H., Huang, Z., & Jing, Y. (2019). Living in a changing world: The change of culture and psychology. https://psycnet.apa.org/doi/10.1093/oso/9780190679743.003.0023
- Chava, S., Nanda, V., & Xiao, S. C. (2017). Lending to innovative firms. The Review of Corporate Finance Studies, 6(2), 234–289. https://doi.org/10.1093/rcfs/cfx016
- Chemmanur, T. J., & Tian, X. (2018). Do antitakeover provisions spur corporate innovation? A regression discontinuity analysis. Journal of Financial and Quantitative Analysis, 53(3), 1163–1194. https://doi.org/10.1017/S0022109018000029
- Chen, S., Boucher, H. C., & Tapias, M. P. (2006). The relational self revealed: Integrative conceptualization and implications for interpersonal life. Psychological Bulletin, 132(2), 151. https://doi.org/10.1037/0033-2909.132.2.151
- Chen, S. S., Ho, K. Y., & Ho, P. H. (2014). CEO overconfidence and long‐term performance following R&D increases. Financial Management, 43(2), 245–269. https://doi.org/10.1111/fima.12035
- Chen, J., Leung, W. S., & Evans, K. P. (2018). Female board representation, corporate innovation and firm performance. Journal of Empirical Finance, 48, 236–254. https://doi.org/10.1016/j.jempfin.2018.07.003
- Chu, Y., Tian, X., & Wang, W. (2019). Corporate innovation along the supply chain. Management Science, 65(6), 2445–2466. https://doi.org/10.1287/mnsc.2017.2924
- Coffey, B., & McLaughlin, P. A. (2009). Do masculine names help female lawyers become judges? Evidence from South Carolina. American Law and Economics Review, 11(1), 112–133. https://doi.org/10.1093/aler/ahp008
- Custódio, C., Ferreira, M. A., & Matos, P. (2019). Do general managerial skills spur innovation? Management Science, 65(2), 459–476. https://doi.org/10.1287/mnsc.2017.2828
- Edwards, J., Caplan, R., & Harrison, R. (2002). Person-environment fit theory: conceptual foundations, empirical evidence, and directions for future research. Teoksessa CL Cooper (toim.). Theories of organizational stress (pp. 28–67). Oxford: Oxford University Press.
- Eggerth, D. E. (2015). Job satisfaction, job performance, and success. In P. J. Hartung, M. L. Savickas, & W. B. Walsh (Eds.), APA handbook of career intervention (Vol. 2, pp. 453–463). American Psychological Association.
- Faleye, O., Kovacs, T., & Venkateswaran, A. (2014). Do better-connected CEOs innovate more? Journal of Financial and Quantitative Analysis, 49(5–6), 1201–1225. https://doi.org/10.1017/S0022109014000714
- Fang, V. W., Tian, X., & Tice, S. (2014). Does stock liquidity enhance or impede firm innovation? The Journal of Finance, 69(5), 2085–2125. https://doi.org/10.1111/jofi.12187
- Galasso, A., & Simcoe, T. S. (2011). CEO overconfidence and innovation. Management Science, 57(8), 1469–1484. https://doi.org/10.1287/mnsc.1110.1374
- Gentry, R. J., Harrison, J. S., Quigley, T. J., & Boivie, S. (2021). A database of CEO turnover and dismissal in S&P 1500 firms, 2000–2018. Strategic Management Journal, 42(5), 968–991. https://doi.org/10.1002/smj.3278
- Graham, J. R., Kim, H., & Leary, M. (2020). CEO-board dynamics. Journal of Financial Economics, 137(3), 612–636. https://doi.org/10.1016/j.jfineco.2020.04.007
- Guedj, I., & Scharfstein, D. (2004). Organizational scope and investment: Evidence from the drug development strategies of biopharmaceutical firms. NBER working paper, 10933.
- Gu, Y., Mao, C. X., & Tian, X. (2017). Banks’ interventions and firms’ innovation: Evidence from debt covenant violations. The Journal of Law & Economics, 60(4), 637–671. https://doi.org/10.1086/696703
- Heaton, J. B. (2002). Managerial Optimism and Corporate Finance. Financial Management, 31(2), 33–45. https://doi.org/10.2307/3666221
- Hirshleifer, D., Low, A., & Teoh, S. H. (2012). Are overconfident CEOs better innovators? The Journal of Finance, 67(4), 1457–1498. https://doi.org/10.1111/j.1540-6261.2012.01753.x
- Jaffe, A. B. (1989). Characterizing the “technological position” of firms, with application to quantifying technological opportunity and research spillovers. Research Policy, 18(2), 87–97. https://doi.org/10.1016/0048-7333(89)90007-3
- Johnson, W. B., Magee, R. P., Nagarajan, N. J., & Newman, H. A. (1985). An analysis of the stock price reaction to sudden executive deaths: Implications for the managerial labor market. Journal of Accounting and Economics, 7(1–3), 151–174. https://doi.org/10.1016/0165-4101(85)90034-5
- Jones, J. T., Pelham, B. W., Carvallo, M., & Mirenberg, M. C. (2004). How do I love thee? Let me count the Js: Implicit egotism and interpersonal attraction. Journal of Personality and Social Psychology, 87(5), 665. https://doi.org/10.1037/0022-3514.87.5.665
- Kalist, D. E., & Lee, D. Y. (2009). First names and crime: Does unpopularity spell trouble? Social Science Quarterly, 90(1), 39–49. https://doi.org/10.1111/j.1540-6237.2009.00601.x
- Kang, Y., Zhu, D. H., & Zhang, Y. A. (2021). Being extraordinary: How CEOS’uncommon names explain strategic distinctiveness. Strategic Management Journal, 42(2), 462–488. https://doi.org/10.1002/smj.3231
- Knewtson, H. S., & Sias, R. W. (2010). Why Susie owns Starbucks: The name letter effect in security selection. Journal of Business Research, 63(12), 1324–1327. https://doi.org/10.1016/j.jbusres.2009.12.003
- Kogan, L., Papanikolaou, D., Seru, A., & Stoffman, N. (2017). Technological innovation, resource allocation, and growth. The Quarterly Journal of Economics, 132(2), 665–712. https://doi.org/10.1093/qje/qjw040
- Koh, P. S., & Reeb, D. M. (2015). Missing R&D. Journal of Accounting and Economics, 60(1), 73–94. https://doi.org/10.1016/j.jacceco.2015.03.004
- Krüger, P., Landier, A., & Thesmar, D. (2015). The WACC fallacy: The real effects of using a unique discount rate. The Journal of Finance, 70(3), 1253–1285. https://doi.org/10.1111/jofi.12250
- Laham, S. M., Koval, P., & Alter, A. L. (2012). The name-pronunciation effect: Why people like Mr. Smith more than Mr. Colquhoun. Journal of Experimental Social Psychology, 48(3), 752–756. https://doi.org/10.1016/j.jesp.2011.12.002
- Lerner, J., & Seru, A. (2014). The use and abuse of patent data. Bus. Sch., Harvard Univ. Work. Pap.
- Luong, H., Moshirian, F., Nguyen, L., Tian, X., & Zhang, B. (2017). How do foreign institutional investors enhance firm innovation? Journal of Financial and Quantitative Analysis, 52(4), 1449–1490. https://doi.org/10.1017/S0022109017000497
- Malmendier, U., & Tate, G. (2005). CEO overconfidence and corporate investment. The Journal of Finance, 60(6), 2661–2700. https://doi.org/10.1111/j.1540-6261.2005.00813.x
- Malmendier, U., & Tate, G. (2008). Who makes acquisitions? CEO overconfidence and the market’s reaction. Journal of Financial Economics, 89(1), 20–43. https://doi.org/10.1016/j.jfineco.2007.07.002
- Markus, H., & Cross, S. (1990). The interpersonal self. In L. A. Pervin (Ed.), Handbook of personality: Theory and research (pp. 576–608). Guilford Press.
- Mehrabian, A. (2001). Characteristics attributed to individuals on the basis of their first names. Genetic, Social, and General Psychology Monographs, 127(1), 59–88.
- Nelson, L. D., & Simmons, J. P. (2007). Moniker maladies: When names sabotage success. Psychological Science, 18(12), 1106–1112. https://doi.org/10.1111/j.1467-9280.2007.02032.x
- O’Connor, M., & Rafferty, M. (2012). Corporate governance and innovation. Journal of Financial and Quantitative Analysis, 47(2), 397–413. https://doi.org/10.1017/S002210901200004X
- Pelham, B., & Mauricio, C. (2015). When tex and tess carpenter build houses in Texas: moderators of implicit egotism. Self and Identity, 14(6), 692–723. https://doi.org/10.1080/15298868.2015.1070745
- Pelham, B. W., Mirenberg, M. C., & Jones, J. T. (2002). Why Susie sells seashells by the seashore: Implicit egotism and major life decisions. Journal of Personality and Social Psychology, 82(4), 469. https://doi.org/10.1037/0022-3514.82.4.469
- Popp, D., Juhl, T., & Johnson, D. K. (2003). Time in purgatory: determinants of the grant lag for US patent applications. National Bureau of Economic Research Cambridge.
- Porter, M. E. (1985). Competitive advantage: creating and sustaining superior performance. Free Press: N. Y. New York, NY. https://id.lib.harvard.edu/alma/990004736830203941/catalog
- Quigley, T. J., Crossland, C., & Campbell, R. J. (2017). Shareholder perceptions of the changing impact of CEOs: Market reactions to unexpected CEO deaths, 1950–2009. Strategic Management Journal, 38(4), 939–949. https://doi.org/10.1002/smj.2504
- Romer, P. M. (1986). Increasing returns and long-run growth. Journal of Political Economy, 94(5), 1002–1037. https://doi.org/10.1086/261420
- Sadowski, C. J., Wheeler, K. J., & Cash, M. (1983). Unusual First Names and achievement among male psychologists. The Journal of Social Psychology, 119(2), 181–185. https://doi.org/10.1080/00224545.1983.9922819
- Shefrin, H. (2001). Behavioral corporate finance. Journal of Applied Corporate Finance, 14(3), 113–126. https://doi.org/10.1111/j.1745–6622.2001.tb00443.x
- Statman, M., & Sepe, J. F. (1989). Project termination announcements and the market value of the firm. Financial Management, 18(4), 74–81. https://doi.org/10.2307/3665799
- Sunder, J., Sunder, S. V., & Zhang, J. (2017). Pilot CEOs and corporate innovation. Journal of Financial Economics, 123(1), 209–224. https://doi.org/10.1016/j.jfineco.2016.11.002
- Tajfel, H. (1982). Social psychology of intergroup relations. In M. R. Rosenzweig & L. W. Porter (Eds.), Annual review of psychology (Vol. 33, pp. 1-39). Annual Reviews.
- Twenge, J. M., Abebe, E. M., & Campbell, W. K. (2010). Fitting in or standing Out: Trends in American parents’ choices for children’s names, 1880–2007. Social Psychological and Personality Science, 1(1), 19–25. https://doi.org/10.1177/1948550609349515
- Urbatsch, R. (2014). Alphabetical effects on political careers. Names, 62(4), 229–238. https://doi.org/10.1179/0027773814Z.00000000093
- Zweigenhaft, R. L. (1977). The other side of unusual first names. The Journal of Social Psychology, 103(2), 291–302. https://doi.org/10.1080/00224545.1977.9713328
- Zweigenhaft, R. L. (1981). Unusual names and uniqueness. The Journal of Social Psychology, 114(2), 297–298. https://doi.org/10.1080/00224545.1981.9922763
Appendix A.
Definitions of variables
Table
Appendix B:
Alternative measures of name uncommonness
This table presents the results of baseline results using alternative definitions of name uncommonness. The dependent variable Ln(1+ Pat)i,t+n, is the natural logarithm of one plus the number of patents filed (and eventually granted) in one (t + 1), two (t + 2), and three (t + 3) years, and results are reported in columns (1)—(3), respectively. The dependent variable LnCitei,t+n, is the natural logarithm of one plus the average number of citations received per patent in one (t + 1), two (t + 2), and three (t + 3) years, and results are reported in columns (4)—(6), respectively. Uncommonness_Since1992i,t is an uncommonness measure of the CEO’s first name constructed based on the frequency of first names in the population since 1992. Uncommonness_SinceFirstBirthi,t is an uncommonness measure based on the frequency of first names in the population since the birth year of the oldest CEO in the sample. Year fixed effects Yeart and firm fixed effects Firmj are included in all regressions. Control variables are the same as in the baseline regression in Table . For the sake of brevity, their coefficients are not reported. All other variables are as defined in Appendix A. Standard errors clustered by CEO-firm pair are reported in parentheses. ***, **, and * indicate significance at the 1%, 5%, and 10% level, respectively.