
 ?Mathematical formulae have been encoded as MathML and are displayed in this HTML version using MathJax in order to improve their display. Uncheck the box to turn MathJax off. This feature requires Javascript. Click on a formula to zoom.
Abstract
This study investigates whether firm’s management uses split ratios to target low price anchors in order to impact post-split ownership. We report anchoring bias for the lowest ranges of prices in the equity market and find specific price anchors among individual investors in the secondary equity market. Initial founders/promoters may use these price anchors and target-specific post-split prices to achieve the desired ownership structure between individual and institutional investors. This study addresses the role of nominal prices in choosing to split shares in the context of a firm’s ownership structure. Our findings amplify the fact that the psychological biases of individual investor behaviour depend on share price levels, which affects the ownership structure of a firm. Our study makes three contributions. First, we provide evidence for anchoring basis among individual investors for the lowest price ranges. Thus, companies use higher split ratios to target the lowest price ranges to disperse ownership among individual investors. Second, we find that institutional investors reduce ownership in companies that target the lowest price anchors post-split. Third, promoters may use price anchors to disperse ownership among individual investors, thus maintaining control.
1. Introduction
In an efficient equity market, the stock price should be of no significance to investors. However, many firms maintain constant share prices in equity markets (Dyl & Weld, Citation2006; Weld et al., Citation2009). There seems to be an “anchoring bias” (Tversky & Kahneman, Citation1974) across firms to maintain constant market prices for shares in the secondary market. Previous research explores the role of “anchoring bias” with respect to nominal prices. In a recent study, Bae et al. (Citation2019) analyze share prices from 49 countries and find that firms revert to country-specific anchors for market prices via stock splits and reverse stock splits. They continue to manage the share prices throughout their listing history and attempt to maintain them within a range. They appear to follow a “price range norm” to make stocks attractive to investors. Baker et al. (Citation2009) propose the “catering theory of the nominal price”, in which firms offer low nominal prices using IPO Issue Price (IPR) and Post-Split Market Prices (PSMP), keeping in mind the demand among investors for those price ranges. There is mixed evidence to show that catering incentives affect companies’ choice of PSMPs and IPRs (Perez & Shkilko, Citation2017). This study investigates whether firms use price anchors to target specific ownership structures after stock splits.
Retail and institutional shareholders have divergent preferences regarding share prices. Retail investors prefer lower-priced stocks, whereas institutional investors prefer higher-priced stocks (Schultz, Citation2000). Thus, firms may target a specific IPR/IPO anchors to achieve their desired ownership structure post-IPO (Fernando et al., Citation2004; Gao and Cao, Citation2019). Similarly, they split shares to lower nominal price in the secondary market to attract retail investors who consider these stocks as having lower downside risks than the higher-market priced stocks, thus creating a “nominal illusion” (Birru & Wang, Citation2016). Thus, individual investors overestimate the skewness of the lower-priced stocks, which have a lower “reference point” (Kahneman & Tversky, Citation1979) compared to the higher-priced stocks. They estimate gains and losses with regard to a particular reference market price in the equity market and are more likely to believe that lower-priced stocks have a higher upside potential than high-priced stocks. This bias is more pronounced in investors who are strongly associated with socio-economic groups with a higher probability of investing in lotteries (Kumar, Citation2009). These investors consider low-priced stocks equivalent to a lottery. Hence, a person’s gambling preference may be reflected in their decision to invest in lower-priced stocks (Bali et al., Citation2017; Hu et al., Citation2022). As retail investors are wealth-constrained, they focus more on the number of shares than on the overall investment amount. Lower PSMPs enable more retail investors to buy shares in round lots, potentially increasing the number of trades (Schultz, Citation2000). However, the average size of trades may decline. Investors may use the “numerosity heuristic” to judge the value by considering the number of units without considering their size or value (Costa, Citation2020; Pelham et al., Citation1994; West et al., Citation2020). Retail investors also implement trading strategies based on stock prices.
Stock splits are natural experiments used to estimate these price anchors in equity markets. Founders (initial promoters) and management may use them to target specific ownership structures during post-market price splits (Amini et al., Citation2020). Our empirical findings highlight the economic significance of stock prices and how firms use price anchors to target the desired ownership in the secondary equity market. A large stock split ratio may indicate management’s efforts to reduce stock prices in the secondary market. We make three important contributions to behavioural finance literature. First, we find that companies use larger split ratios to target the lowest price anchors in the context of a firm’s ownership structure. While prior studies examine the differences in ownership structures pre- and post-split, the role of specific nominal prices (price anchors) is not addressed. The conceptualization of nominal price and shareholder ownership with other cross-sectional characteristics of a firm in the same empirical framework allows us to examine the incremental effect of lower prices and higher split ratios. Second, we provide another piece of empirical evidence to support the relationship between market price and initial promoter holdings in the context of a country where such a relationship has not been explored to the best of our knowledge. Finally, we synthesize a theoretical framework to understand the role of specific market price anchors in firms’ ownership structure.
The remainder of this paper is organized as follows: Section 2 presents the literature review. Section 3 develops the research gap and presents the hypotheses. Section 4 describes the sample and outlines the research methodology and model. Section 5 discusses the empirical results, discussions, .Section 6 specifies the policy implications, and finally section 7 concludes the study.
2. Literature review
This section provides a brief review of past literature covering various aspects nominal price significance, such as nominal price puzzle, nominal illusion, and how companies use split ratios to reduce market price levels in order to impact company’s post-split ownership structure.
2.1. Nominal price puzzle
Weld et al. (Citation2009) describe nominal price as a puzzle. They argued that companies maintain the nominal price in a specific range over the years in both the primary and secondary markets via regular stock splits in the secondary market. It was estimated that the average nominal price of US markets (all traded stocks in the NYSE and AMEX) is close to US$25 per share and that firms engage in stock splits to maintain this price. The average nominal price has remained constant since 1933 and has not kept pace with inflation at 3.5%. Investors pay more commissions to brokers after stock splits, as lower-priced stocks have higher bid-ask spreads. Bae et al. (Citation2019) suggest that companies use stock splits and reverse stock splits to reduce market prices and maintain price anchors in the market, respectively. The nominal price puzzle is explained through several hypotheses, namely trading range hypothesis (Baker and Gallagher, Citation1980), “pay to play” (Angel, Citation1997), and Signaling hypothesis (Brennan & Copeland, Citation1988a; McNichols & Dravid, Citation1990). The authors find these explanations to be inconsistent with current data, and the puzzle still exists if studied using conventional lenses. The puzzle becomes more acute when positive and significant markets react to actions that lead to constant nominal prices (such as stock splits).
2.2. Nominal illusion
Individual investors suffer from “nominal illusion,” wherein they perceive that a cheaper stock has more room to grow after the split (Birru & Wang, Citation2016). For example, a US$10 stock is farther from perceivable maximum than a $3000 stock, prompting investors to believe that low-priced stocks have more upside potential, thus creating a nominal illusion. Behavioral studies also present important arguments regarding stock splits. Nominal illusion among investors can be associated with framing biases (Thaler, Citation1985) and reference points (Kahneman & Tversky, Citation1979). Kahneman and Tversky (Citation1979) and Tversky & Kahneman (Citation1985) also argue that framing is controlled by the norms, habits, and expectations of individual decision-makers. As individual investors are more risk-averse (coefficient 2.25), they believe that lower stock prices have a lower downside risk than high-priced stocks, thus creating a lower reference price (point) in their minds. In a decision-making experiment, the buyer and seller are more willing to trade after a stock split (Svedsater et al., Citation2007). Next, we discuss how the difference in stock-level preferences impacts the ownership structure of a company. A recent study (Borsboom & Füllbrunn, Citation2021) establishes a connection between psychological biases and investor behavior, and shows their dependence on stock price levels. Individual investors process high- and low-priced stocks on different scales—small numbers on a linear scale and large numbers on a logarithmic scale (Roger et al., Citation2018).
2.3. Impact of lower market prices (or higher split ratios) and promoter holding on ownership
Changes in the number of institutional and individual shareholders are positively related to the split ratio or factor but do not impact ownership held by institutional investors (Sandip Mukherji et al., Citation1997). The higher the split ratio, the greater the price reduction in the secondary market; thus, individual investors become more optimistic after stock splits (Citation2019). The high price effect (higher prices) is stronger for companies that have difficulty connecting with retail investors (Chan et al., Citation2017). Thus, such companies may use different split ratios to reduce market prices in the secondary market to attract individual investors. As already stated, investor optimism for stock splits is associated with nominal illusion (Birru & Wang, Citation2016). Lower-priced stocks are perceived to have greater upside potential than higher-priced stocks. Taking advantage of the behavioral biases of individual investors, companies split shares to disperse firm ownership among individual investors. Thus, companies targeting a higher reduction from pre-split prices to post-split prices may use a higher split ratio to target a positive shift in ownership among individual investors. Individual investors increase trading around stock splits that splits nominal prices, which is associated with a shift towards less sophisticated retail investors (Dhar et al., Citation2003). In support of this, Muscarella and Vetsuvpens (Citation1996) find an increase in the number of lower-sized buy orders after the stock splits. Available evidence (Borsboom & Füllbrunn, Citation2021; Nguyen et al., Citation2017; Schultz, Citation2000) also support these findings.
The extant literature offers two theories on changes in ownership structure after stock splits. The first theory proposes that individuals are wealth-constrained and cannot afford stocks with a higher nominal price; therefore, firms actively split stocks to make them more affordable to retail investors (Conroy & Harris, Citation1999; Lamoureux & Poon, Citation1987; Schultz, Citation2000). The second argument is based on the increase in trading costs after the split. Conroy et al. (Citation1990) find an increase in bid–ask spreads after stock splits, which then increases the institutional investors’ trading costs. Prior research also documents that the percentage of institutional ownership decreases after stock splits, as institutional shareholders increase holding in an equitant stock with lower bid–ask spreads (Dennis & Strickland, Citation2002). On the contrary, institutional investors tend to avoid low-priced stocks (Falkenstein, Citation1996; Gompers & Metrick, Citation2001). Thus, companies, considering investors’ preferences in the equity market, offer different share price levels for different types of investors (individual vs. institutional) to attract them, conditional on the firm’s preferences as to ownership mix (Amini et al., Citation2020).
3. Research gap & hypothesis development
This section discusses a research gap based on the above literature review. We further develop a hypothesis to estimate the impact of each price range (price anchors) and split ratios on ownership structure in the secondary market.
3.1. Research gap
Lamoureux and Poon (Citation1987) and Schultz (Citation2000) focus on the positive impact of stock splits on individual shareholders, thus increasing ownership among low-priced stocks. Existing literature also supports the argument that the number of individual shareholders increases after a split in market price (Dhar et al., Citation2003), or a reduction in trading lot size (Amihud et al., Citation1999). Furthermore, Huang et al. (Citation2015) support the attention-grabbing hypothesis (signaling hypothesis) over the liquidity improvement hypothesis after the stock split. Companies use stock splits and reverse stock splits to bring back the price to the price anchors in the equity market (Bae et al., Citation2019). Companies use stock splits to attract gambling investors (individuals) and induce (large) shareholders to reduce wealth exposures to splitting firms (Hu et al., Citation2022). Thus, the rationale behind stock split decisions is to expand the investor base and increase liquidity (Baker and Gallagher, Citation1980). Furthermore, Franks and Mayer (Citation1997) argue that higher dispersion outside promoter holdings reduces the incentive for individual shareholders to monitor the current management. Thus, we argue that companies may use higher split ratios to target the lowest price anchors, thus attracting individual investors and achieving the desired ownership structure post-split. The conceptualization of nominal price and shareholder ownership with other cross-sectional characteristics of a firm in the same empirical framework allows us to examine the incremental effect of the lowest price ranges.
3.2. Hypothesis development
A recent study (Shue & Townsend, Citation2021) provides evidence that individual investors see share price changes in absolute terms rather than in percentages and have more extreme return responses to news for lower-priced shares such as stock splits. After a stock split, a price-based co-movement triggers similar market-priced stocks (Green and Hwang, Citation2009). Thus, certain investors categorize stocks based on price levels. Retail investors prefer lower-priced stocks, whereas institutional investors prefer higher-priced stocks (Schultz, Citation2000). Thus, there is a shift in ownership from higher-priced stocks to lower-priced stocks after a stock split. This leads to our first hypothesis that each post-price split (lowest to highest) has a differential impact on individual and institutional ownership.
Hypothesis 1 (H-1): The lowest ranges of post-split prices lead to the highest positive change in individual ownership and highest negative change in institutional ownership.
Companies that use higher split ratios highlight their intention to target the lowest price ranges in the secondary market. Companies use various split ratios to reduce market prices in the secondary equity market. Changes in the numbers of institutional and individual shareholders are positively related to the split ratio factor but do not impact ownership held by institutional investors (Sandip Mukherji et al., Citation1997). A higher split ratio is associated with a price reduction in the secondary market; thus, individual investors become more optimistic after stock splits (Cui et al., Citation2019). The individual investors’ optimism comes from the fact that a greater price reduction leads to a higher “nominal illusion” among individual investors, as they believe that low-priced stocks have more upside potential after price reduction. This leads to our second hypothesis.
Hypothesis 2 (H-2): The highest split ratio leads to the highest positive change in individual ownership.
Promoters lower stock levels to increase desperation among individual shareholders. Black (Citation1992) proposes a political model of corporate governance that is similar to the passivity model in which each shareholder holds a small fraction of the company's equity stock; this creates collective action problems for the shareholders. Indian companies have substantial promoter holdingsFootnote1; thus, they use stock levels to achieve the desired ownership post-split. To maintain control, promoters discriminate between shareholders to reduce the size of new shareholdings (Franks & Mayer, Citation1997). As per generalized catering hypothesis, managers use different price levels to attract different ownership (institutional vs. individuals) in the equity market (Amini et al., Citation2020). Thus, we propose that the level of promoter holdings (pre-split) may impact shareholder dispersions post-split. This leads to the third hypothesis.
Hypothesis 3 (H-3): Companies with a lower percentage of promoter holdings and a higher percentage of institutional holdings (pre-split) in the ownership structure target lower post-split prices to increase individual shareholding post-split.
4. Data, sample variables, research methodology, and model
4.1. Data
We take a sample of companies that split their shares between 2006 and 2020. This 15-year period encompasses both extreme bullish and bearish periods for the Indian equity markets. The total sample size is 707. According to Indian listing exchange regulations, listed Indian companies must provide ownership details of individual and institutional investors, both numerically and in percentage, in their quarterly filings. The mean post-split share price for the sample companies is INRFootnote2 140.48 (Tables ). The sample contains three split ratios: 1:2, 1:5, and 1:10. The mean split ratio for the sample companies is 1:6.64. We further observe that the mean change in individual ownership post-split is negative, signifying that individual ownership does not show a positive drift in all post-split ranges (Tables ). Specific price ranges in the secondary equity market could attract individual investors post-split. Thus, the stock split provides a natural experiment to estimate the impact of each price range on both individual and institutional ownerships. Companies may target lower post-split prices using various split ratios, i.e. the higher the split ratio, the greater the reduction from pre-split prices to post-split prices.
Table 1. Descriptive statistics
We conduct univariate and multivariate analyses to estimate the impact of post-split price ranges and split ratios on individual ownership. Data for the study are sourced from the center for monitoring the Indian Economy’s Prowess IQ database and the quarterly filings of split companies’. The summary statistics for the companies that split their shares in the secondary market are shown in Table . We use linear regression (using robust standard errors), as the data contain cross-sectional characteristics (across split firms) and also control for time using a time dummy. The sample variables are described in the next section.
4.2. Individual investors ownership in Indian capital market
Individual investor participation in the Indian equity market has been steadily increasing over the last couple of years. The increase is reflected in huge inflows by individual investors, a surge in new investor registrations, and a sharp jump in the share of individual investors in cash market turnover during this period. In the Indian equity market, individual investors are becoming increasingly important, as they contribute 40.7% of the total NSEFootnote3 turnover in FY2022. In April–November 2021, approximately 221 lakhs of individual DEMATFootnote4 accounts were added. Individual ownership in NSE-listed companies is 9.7%, and, in terms of the free-float market capitalization, individual investors hold 19.7%. As the promoter holds 44.90% of the overall NSE companies, they might use stock prices to target the dispersion of ownership among individual shareholders.
4.3. Sample Variables
We divide the sample variables that impact the company’s ownership post-split into three parts for analysis: Dependent variable, Independent variables, and Control variables.
4.3.1. Dependent Variable
Change in individual and institutional ownership: To estimate changes in individual ownership for firms after and before the stock split, the estimation window includes two quarters prior to the quarter (q) in which the split is effectuated, and the quarter thereafter (). We estimate the individual ownership percentage prior to the split in the quarter, that is, two quarters prior to the split record date (
). We use a longer window of two quarters instead of one to exclude the effect of split announcements on ownership during the intervening period.
We also estimate the change in institutional ownership before and after the stock split using the same estimation time window. We estimate the institutional ownership percentage prior to the split in the quarter, that is, two quarters prior to the split record date (. The portion of institutional ownership decreases after the stock split, as an institution increases holdings of an equitant stock with lower bid-asks to spread. Thus, we assess the changes in institutional ownership holdings and individual ownership before and after companies’ split.
4.3.2. Independent Variables
4.3.2.1. Post-split price ranges
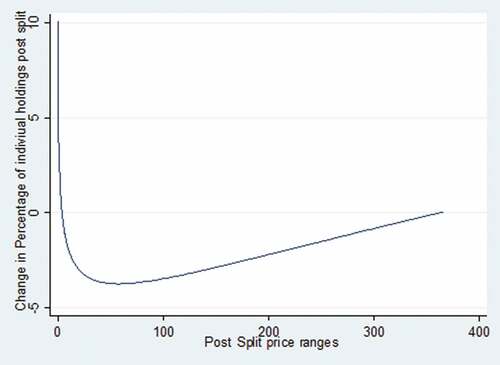
Our main independent variables are the various post-split price ranges (price anchors in the secondary market) between INR 0 and INR 200. The post-split price range of INR 200 is at the 90th percentile for the overall sample while INR 6.36 lies at the 10th percentile. We also observe that the lowest post-split price ranges show the highest positive changes in individual ownership (see Figure ). Therefore, we divide the lower price bands into much narrower ranges compared to higher ranges. Accordingly, we divide the overall post-split price sample into 0–10, 11–20, 21–30, 31–40, 41–50, 51–100, 101–150, 151–200, and 200+. Thus, we create eight binary dummy variables representing the nine price bands. To represent the various post-split price bands, we introduce binary dummies (1,0) to represent post-split price ranges in the model. Each post-split price range assumes a value of 1 if the post-split price falls within a specific post-split price range and 0 if it falls outside the post-split price range. The model controls for firm-specific factors that impact ownership in the secondary equity market.
Figure 1: Fractional polynomial relationship between post-split price and changes in individual ownership post split
4.3.2.2. Split ratios
Companies may use split ratios to reduce market prices in secondary markets. The level of reduction (percentage reduction) from pre-split market prices to post-split prices by companies is positively related to split ratios. The higher the split ratio, the greater the absolute reduction in market prices in the secondary equity market. Share prices are converted to lower market prices by using a higher split ratio, thus attracting a higher number of individual investors post-split. To represent the various split ratios, we introduce binary dummies (1,0) to represent split ratio in the model. Each split ratio assumes a value of 1 if the split ratio is within a specific split ratio and 0 if it falls outside the split ratio. The sample contains three split ratios: 1:2, 1:5, and 1:10. Thus, we create two binary dummies to estimate the impact of D1 representing the lowest split ratio 1:10 and D2 representing split ratio 1:2.
4.3.2.3. Level of promoter holdings (pre-split)
The level of promoter holdings could directly impact the level of ownership dispersion the promoter would like after the split. Promoters would likely disperse more among individual shareholders’ post-split. Thus, we expect a negative relationship between changes in individual holdings post-split and the level of promoter holdings pre-split.
4.3.2.4. Level of institutional holding (pre-split)
The level of institutional ownership is positively associated with pre-split high market-priced stocks. As higher market prices are split into lower market prices, it creates a higher level of dispersion among individual shareholders’ post-split. Thus, we expect a positive relationship between the level of institutional holdings pre-split and changes in individual holdings post-split.
4.3.3. Control variables
We include firm-specific variables that affect institutional and individual ownership. We control for the size, value, volatility, trading value, and time effects.
4.3.3.1. Market capitalization
Stoll and Whaley (Citation1983) find a positive association between the market value of equity and price per share for common stocks. Moreover, prior research shows that individual investors concentrate their holdings and trading activities on smaller-sized companies, lower-priced stocks, and lower institutional ownership firms (Kumar and Lee, Citation2006).
4.3.3.2. Price-to-book value
Companies with low price-to-book ratios target lower post-split prices to attract a lower price premium (as suggested by Baker et al., Citation2009), thus attracting more individual shareholders post-split. In addition, Disli et al. (Citation2020) estimate that investors’ anchor stocks prices for stock valuations because higher-priced stocks have higher market-to-book ratios than lower-priced stocks.
4.3.3.3. Volatility
It is measured by the standard deviation of monthly market prices 6 months before the split. Foucault et al. (Citation2011) and Tuominen (Citation2022) estimate retail trading’s effect on stock volatility and find a positive relationship between retail trading and splits, thus increasing stock volatility. Lower-priced stocks are also exposed to extreme returns, which is consistent with non-proportional thinking among individual investors (Shue & Townsend, Citation2021). Current literature findings contradict past evidence that stock splits substantially increase return volatility without increasing liquidity (Ohlson & Penman, Citation1985; Shue & Townsend, Citation2021).
4.3.3.4. Trading value
Trading value is a trade-based measure of liquidity proposed by Aitken and Comerton-Forde (Citation2003). Prior literature (see Anshuman, A & Kalay, Citation2002) propose a relationship between stock price levels and the distribution of liquidity trades across time. Further studies show that an optimal stock price level induces optimal discretionary trading (Brennan & Copeland, Citation1988; Cox et al., Citation2022). The model takes the log share turnover which is measured by the average of the share value turnover before the split.
The correlation matrix (Table ) shows a low positive correlation between post-split prices and changes in individual ownership post-split. Thus, we expect lower ranges of post-split prices to have a higher positive impact on the ownership of individual investors than higher ranges. Promoter holdings (pre-split) show a negative association with changes in individual ownership post-split (linked to higher dispersion post-split). Finally, the price-to-book value shows a negative association with changes in individual shareholders’ post-split.
Table 2. Correlation matrix
4.4. Research methodology and model
4.4.1. Research methodology
This empirical framework aims to explain the effect of post-split price ranges on individual and institutional ownership in the secondary equity market. We also estimate the impact of various split ratios (high to low) on individual ownership. Companies targeting higher split ratios show their intention to cater to low price anchors in the equity markets. We first conduct a univariate analysis to estimate the impact of each post-split price range and split ratio on changes in individual ownership. Then, we conduct a multivariate analysis, which includes the various post-split price bands, split ratios along with the concentration of promoter holding, percentage of institutional holdings (pre-split), and various controls.
The model analyzes the effects of various post-split price ranges (low to high) on changes in the percentage of individual holdings post-split (∆ and institutional holdings (∆
in the secondary market. The model also analyses the effects of the highest (1:10) and lowest split ratio (1:2) on the percentage of individual holdings post-split (∆
. We use linear regression (using robust standard errors) to analyze the impact of post-split price ranges, as the data have cross-sectional characteristics. To address heteroscedasticity, we use Huber-White robust standard errors in the model. The model controls for time effects (TDY).
We use the following model to estimate the effect of post-split prices on individual and institutional ownership in secondary markets. The model controls for firm-specific variables that impact individual and institutional ownership. We then extract two sub-samples (sub-section 5.2.3), one from the bearish period and one from the bullish period, to estimate the impact of each post-split price.
4.4.2. Regression models – effect of post-split price ranges (PSPR) and split ratios on ownership
Where in Where in -:
4.4.2.1. Dependent variable
∆—Change in individual ownership one quarter after the split minus two quarters before the stock split.
∆—Change in institutional ownership one quarter after the split minus two quarters before the stock split
4.4.2.2. Independent variables
The PSPR above represents post-split price ranges (eight ranges), and is the associated coefficient.
= assumes a value of 1 if falls within a particular range, and 0 otherwise
—Split 1:2, Split 1:5, and Split 1:10.
= assume a value of 1 if falls within a specific split ratio, and 0 otherwise. Thus, we create two binary dummies to estimate the impact of D1 representing the lowest split ratio 1:10 and D2 representing split ratio 1:2.
= Promoter holding prior to stock split quarter wherein q is the split quarter
Institutional holding prior to stock split quarter wherein q is the split quarter
represents the coefficient for the percentage
of institutional holding pre-split and α is the coefficient for percentage
of promoter holdings pre-split.
4.4.2.3. Control variables
:γ1 to γ4are the coefficients of the firm-specific control variables.
Xj represents the control variables, market capitalization, price-to-book ratio, pre-split volatility, and average turnover pre-split.
Time Dummy (TDY)—Controlling for time effects for all years (2006–2020)—14 time dummies representing 15 years
Split stock for i (denoted by i)
5. Empirical results and discussion
5.1. Univariate analysis
As observed (in the sample description), the mean change in individual holdings is negative; therefore, we perform univariate analysis to estimate the effect of various post-split prices on changes in individual holdings post-split. The split sample is divided into nine price bands, and the mean difference of individual holdings (after split minus before split-) is estimated against each price post-split range. We find that the percentage of individual investors holds maximum ownership at the lowest ranges of pre- and post-split prices (INR 0–10; 11–20; Table and Figure 1). The changes in market prices due to the split (from high to low after the split) show significantly positive changes against the lowest market price ranges (0–10 and 11–20). Changes in individual holdings decrease as the post-split price increases. The results show that individual shareholders hold maximum ownership and change ownership towards the lowest market price ranges.
Table 3. Univariate analysis: split ratios and changes in individual holdings
Table 4. Univariate analysis: post-split ranges and changes in individual holdings
We then estimate the impact of each split ratio on the changes in individual ownership post-split. A large stock split ratio may indicate the management’s efforts to reduce stock prices in the secondary equity market. We also find that the greatest positive change in individual holdings (after/before split) is positively related to the highest split ratio. Split ratio 1:10 shows the highest positive change in individual holding as compared to split ratios 1:2 and 1:5 (Table ). Split ratio 1:10 also converts the pre-split market price to an average of post-split price of INR 50. Of the sample split companies, 43.19% split shares using a split ratio of 1:10.
The result of the univariate analysis motivates us to perform multivariate analysis, which controls for other factors that impact ownership.
5.2. Multivariate analysis
Taking cues from the results of the univariate analysis, we conduct a multivariate analysis, along with all post-split price bands, split ratios, independent variables, and control variables. We use linear regression (using robust standard errors) to estimate the effect of each post-split range, split ratios, level of promoter holdings, and level of institutional holding pre-split–on individual ownership. To address heteroscedasticity, we use Huber–White robust standard errors in the model. The model includes time effects. We also check for multi-collinearity issue for both models (VIF factors).
5.2.1. Effect of post-split price ranges
Table displays the results from the estimation of secondary market variables – Effect of PSPR on individual and institutional investors post-split (multivariate analysis).
Table 5. Linear regression model (with robust standard errors)—effect of split ratios on individual ownership
Table 6. Linear regression model (robust standard errors)—effect of PSPR on individual ownership and institutional ownership
The regression coefficients for dummy variables D1, D2, and D3, which represent PSPRs of INR 0 to 10, INR 11 to 20, and INR 21 to 30, respectively, have positive and significant coefficients for the change in ownership among individual investors post-split (∆. The regression coefficients for dummy variables D1 and D2, which represent post-split price ranges of INR 0–10 and INR 11–20, respectively, have negative and significant coefficients for the change in ownership in institutional investor holdings post-split (∆
. They are similar to the price ranges at which individual investors hold maximum ownership and the univariate analysis (Table ). These results support H1, signifying that unlike institutional investors, individual investors prefer the lowest ranges of post-split prices. The results also support Sheridan Titman et al. (Citation2022), who state that unsophisticated investors increase holdings just prior to the split, while sophisticated investors sell their positions after the split.
The results also show that the percentage of promoter holding (pre-split) has a negative and significant coefficient (-) of −0.0601 against the change in individual ownership post-split (∆). The results also support H3, which indicates that promoters with lower levels of shareholdings in a company would like to disperse shareholdings among individual investors to maintain control. Initial promoters aim to diffuse ownership among retail shareholders to increase the passivity associated with them to retain control. The percentage of institutional investors (pre-split) has a positive and significant coefficient of 0.215. This confirms that companies that split shares have a higher percentage of institutional investors in their ownership structure (pre-split). Thus, they support lower post-split prices to have a higher positive impact on retail investors and maintain existing control.
Among the control variables, price-to-book has a negative and significant coefficient that impacts the dispersion of ownership among individual shareholders’ post-split.
5.2.2. Effect of split ratios on individual ownership
displays the results of the impact of various split ratios on individual ownership holding post-split (multivariate analysis).
The results show (Table ) that the largest split ratio (1:10) has the highest positive and significant impact on individual investor ownership compared to the lowest split ratios 1:2. The regression coefficients for the dummy (D1) representing the split ratio 1:10 are positive and significant for the change in ownership of individual investor holdings post-split. The findings support hypothesis H2. Companies using the highest 1:10 split ratio are targeting post-split prices at an average of INR 50 (Table ), and individual investors also positively increase holdings at post-split price ranges INR 0–10, INR 10–20, and INR 20–30 (Table ).
Among the control variables, price-to-book has a negative and significant coefficient that impacts the dispersion of ownership among individual shareholders’ post-split.
We further divide the sample into two parts (bullish and bearish periods) to estimate the impact of price ranges on ownership.
5.2.3. Sub-period analysis—bullish and bearish periods
According to recent studies, investors might think that high-priced stocks may be more stable during crises because they have sufficient resources to survive the market downturn (Phillips, Citation2020; Pean Marin J et. al., Citation2022). However, a company’s motivation to split shares is higher when general economic conditions are good (May et al., Citation2017).
Thus, we extract two sub-samples from the overall stock split sample and statistically estimate whether individual investors continue to drift towards the lowest price anchors after stock splits in bearish or bullish equity markets.
The two sub-periods are as follows: the bullish period for the Indian equity market (2006–2007) and the bearish period during the global crisis (2008). In 2008, the broader equity market (NIFTY 500Footnote5) has corrected by 56.16%. From 2006 to 2007, the NIFTY 500 has increased by 113%. Our two sub-samples comprise companies that split their stocks during bullish and bearish periods.
The regression results (Table ) show that during the bullish period, individual investors significantly increase the holdings of stocks that split between INR 0 and INR 10. However, during the bearish period, there was no significant impact on any price range after the stock split. Individual investors continue to shift towards the lowest price anchors (after split) in bullish markets. This may be because share prices in bullish markets are elevated; thus, individual investors feel that the stock split at the lowest levels (INR 0–10) gives them an opportunity to buy the same stock at a cheaper price. On the contrary, in bearish markets, stocks naturally correct to lower levels; thus, people prefer lower-priced stocks in the secondary market.
Table 7. Linear regression (with robust standard errors) estimates for sub-sample (bullish and bearish period)
5.3. Discussion
The results show that individual investors engage in non-proportional thinking (Shue & Townsend, Citation2021); thus, they gravitate towards the lowest price ranges. On the other hand, Gompers and Metrick (Citation2001) find that institutional investors tend to avoid the lowest-priced stocks as they increase transaction costs. The results also show specific price anchors in the secondary market where individual investors increase ownership and institutional investors decrease ownership. Companies use split ratios to reduce prices in the secondary market. Companies use the highest split ratio (1:10) to target shares at an average price of INR 50; this ratio also has the maximum positive change in individual ownership below INR 50 (i.e. INR 0–10, INR 10–20, and INR 20–30). The results are in line with the findings of Titman et al. (Citation2020), who use transaction-level data from the Chinese market and find that individual investors are net buyers after split announcements.
There seems to be an information asymmetry between institutional and individual investors before the split; thus, institutions make abnormal gains net of brokerage commissions by trading in splitting stocks (Chemmanur et al., Citation2015) in line with the information production theory (M. J. Brennan & Hughes, Citation1991). The generalized catering hypothesis (Amini et al., Citation2020) further states that managers offer various share price levels to different types of investors (individual vs. institutional) to attract them, conditional on the firm’s preferences as to the ownership mix. The results also support the findings of Black (Citation1992), who argues that dispersion among individual shareholders increases the control of existing management.
6. Implications of the study
The results show that the highest split ratio and lowest price ranges have a significant positive impact on individual ownership. Companies offer low-price stocks using the highest split ratios in the secondary equity market, which further increases the gambling preferences of individual investors. Companies also experience increases in speculative features post-split (Hu et al., Citation2021). Low price bias is detrimental to individual investors because it increases the costs when trading low-priced stocks (Métais & Roger, Citation2022). Companies that are more vulnerable to insider trading are likely to split in the future (Nguyen et al., Citation2017). Thus, financial regulators need to implement minimum price ranges for stock splits because the lowest prices expose individual investors to increased return volatility without permanently increasing liquidity for the company. This is also supported by Titman et al. (Citation2022), who disclose that “suspicious” companies use stock splits to artificially increase prices of stocks acquired by non-sophisticated investors. Thus, retail investors are exposed to volatility risk in post-split stocks without any substantial increase in the long-term performance of the stocks.
7. Conclusion, limitations, and future research
Our findings amplify the fact that psychological biases of individual investor behavior depend on share prices, which affect the firm’s ownership structure. These results also support the behavioral biases of individual investors, who prefer lottery-like stocks at the extreme end of the equity market. The results also provide evidence that companies may use higher split ratios to offer low-priced stocks to attract individual investors, thus achieving higher positive dispersion in the company’s ownership. This study makes three contributions. First, we provide evidence for anchoring bias among individual investors for the lowest price ranges. Companies use higher split ratios to target low price anchors in the secondary market. One reason for the low-price anchors could be that individual investors process small numbers on a linear scale and large numbers on a logarithmic scale. Individual investors also hold maximum ownership at the lowest ranges and react positively to splits by increasing ownership at the lowest price ranges in the secondary market. Second, we find that institutional investors reduce ownership in companies that target the lowest price ranges post-split. Third, promoters may use specific price anchors to disperse ownership among individual investors, thus maintaining control.
One limitation of this study is that we focus on price anchors in one country. These price anchors are likely to vary by country, and their multi-country impact may be assessed. This study could further explore whether low price anchors exist in primary markets and whether companies use specific price anchors to achieve specific ownerships post IPO.
Disclosure statement
No potential conflict of interest was reported by the author(s).
Additional information
Funding
Notes on contributors

Harsimran Sandhu
Harsimran Sandhu is working as professor of finance with IMT Ghaziabad. He has completed more than 18 years in the area of banking and financial services, of which 16 years were with Standard Chartered Bank. During his tenure with SCB, Harsimran was a part of the leadership team for wealth management, branch banking, foreign exchange, and wealth lending. He was also part of the global management group (International Investment committee), which drives the investment strategies for the Investors. Harsimran completed his PhD from IIM Indore. He has presented papers at various academic conferences and also published research papers in ABDC Ranked Journals.
Notes
1. As of September 2021, promoter holdings in India is approximately 44.90% of all National stock exchange listed companies while retail investors hold 7.36%. (Source: primeinfobase.com)
2. Indian National Rupee
3. NSE (National Stock Exchange): NSE was incorporated in 1992. It was recognized as a stock exchange by SEBI in April 1993 and commenced operations in 1994 with the launch of the wholesale debt market, followed shortly after by the launch of the cash market segment.
4. DEMAT account is similar to a bank account for your share/stock certificates and other securities that are held in an electronic format. All investors who want to invest in equity markets needs to have a DEMAT account.
5. The NIFTY 500 Index has 96.1% of the free float market capitalization of the stocks listed on the Indian stock exchange. The total traded value for the last six months ending March 2019 of all Index constituents is approximately 96.5% of the traded value of all stocks on NSE.
References
- Aitken, M., & Comerton-Forde, C. (2003). How should liquidity be measured? Pacific-Basin Finance Journal, 11(1), 45–19. https://doi.org/10.1016/S0927-538X(02)00093-8
- Amihud, Y., Mendelson, H., & Uno, J. (1999). Number of shareholders & stock prices: Evidence from Japan. The Journal of Finance, 54(3), 1169–1184. https://doi.org/10.1111/0022-1082.00141
- Amini, S., Buchner, A., Cai, C. X., & Mohamed, A. (2020). Why do firms manage their stock price levels? Journal of International Financial Markets, Institutions and Money, 67, 101220. https://doi.org/10.1016/j.intfin.2020.101220
- Angel, J. (1997). Tick size, share prices, and stock splits. Journal of Finance, 52(2), 655–681. https://doi.org/10.1111/j.1540-6261.1997.tb04817.x
- Anshuman, A, V. R., & Kalay, A. (2002). Can splits create market liquidity? Theory and evidence. Theory and Evidence Journal of Financial Markets, 5(1), 83. https://doi.org/10.1016/S1386-4181(01)00020-9
- Bae, K. H., Bhattacharya, U., Kang, J., & Rhee, S. G. (2019). Nominal stock price anchors: A global phenomenon? Journal of Financial Markets, 44, 31–41. https://doi.org/10.1016/j.finmar.2018.12.006
- Baker, H. K., & Gallagher, P. L. (1980). Management's view of stock splits. Financial Management, 73–77.
- Baker, M., Greenwood, R., & Wurgler, J. (2009). Catering through nominal share prices. The Journal of Finance, 6(6), 2559–2590. https://doi.org/10.1111/j.1540-6261.2009.01511.x
- Bali, T. G., Brown, S. J., Murray, S., & Tang, Y. (2017). A lottery-demand-based explanation of the beta anomaly. Journal of Financial and Quantitative Analysis, 52(6), 2369–2397. https://doi.org/10.1017/S0022109017000928
- Birru, J., & Wang, B. (2016). Nominal price illusion. Journal of Financial Economics, 119(3), 578–598. https://doi.org/10.1016/j.jfineco.2016.01.027
- Black, B. (1992). Institutional investors and corporate governance: The case for institutional voice. Journal of Applied Corporate Finance, 5(3), 19–32. https://doi.org/10.1111/j.1745-6622.1992.tb00223.x
- Borsboom, C., & Füllbrunn, S. (2021). Stock price level effect. Munich Personal RePEc Archive.
- Brennan, M., & Copeland, T. (1988). Beta changes around stock splits: A note. Journal of Finance, 43(4), 1009–1013. https://doi.org/10.1111/j.1540-6261.1988.tb02618.x
- Brennan, M., & Copeland, T. (1988a). Stock splits, stock prices and transaction costs. Journal of Financial Economics, 22(1), 83–101. https://doi.org/10.1016/0304-405X(88)90023-2
- Brennan, M. J., & Hughes, P. J. (1991). Stock prices and the supply of information. The Journal of Finance, 46(5), 1665–1691. https://doi.org/10.1111/j.1540-6261.1991.tb04639.x
- Chan, K., Li, F., Lin, J. C., & Lin, T. C. (2017). What do stock price levels tell us about the firms? Journal of Corporate Finance, 46, 34–50. https://doi.org/10.1016/j.jcorpfin.2017.06.013
- Chemmanur, T., Hu, G., & Huang, J. (2015). Institutional investors and the information production theory of stock splits. The Journal of Financial and Quantitative Analysis, 50(3), 413–445. https://doi.org/10.1017/S0022109015000162
- Conroy, R. M., & Harris, R. S. (1999). Stock splits and information: The role of share price. Financial Management, 28–40. https://doi.org/10.2307/3666181
- Conroy, R., Harris, R., & Benet, B. (1990). The effects of stock splits on bid-ask spread. Journal of Finance, 45(4), 1285–1295. https://doi.org/10.1111/j.1540-6261.1990.tb02437.x
- Costa, P. (2020). Numerical anchoring, perceived returns, and asset prices. Working Paper. https://scholar.harvard.edu/files/pcosta/files/jmp_-_jan_23.pdf Harvard.edu
- Cox, J., Van Ness, & Van Ness, R. (2022). Stock splits and retail trading. Financial Review, 57(4), 731–750. https://doi.org/10.1111/fire.12294
- Cui, C., Li, F. W., Pang, J., & Xie, D. (2019). A behavioural signalling explanation for stock splits: Evidence from China. https://dx.doi.org/10.2139/ssrn.3541201
- Dennis, P., & Strickland, D. (2002). The effect of stock splits on liquidity and excess returns: Evidence from shareholder’s ownership composition. https://doi.org/10.1111/1475-6803.00063
- Dhar, R., Goetzmann, W., & Zhu, N. (2003). The impact of clientele changes: Evidence from stock splits. working paper no. 03–14, Yale ICF.
- Disli, M., Inghelbrecht, K., Schoors, K. J., & Stieperaere, H.(2020). Stock price anchoring. SSRN Electronic Journal, Available at SSRN 3749398 https://doi.org/10.2139/ssrn.3749398
- Dyl, E., & Weld, W. (2006). The share price puzzle. The Journal of Business, 79(4), 2045–2066. https://doi.org/10.1086/503656
- Falkenstein, E. G. (1996). Preferences for stock characteristics as revealed by mutual fund portfolio holdings. The Journal of Finance, 51(1), 111–135. https://doi.org/10.1111/j.1540-6261.1996.tb05204.x
- Fernando, C. S., Krishnamurthy, S., & Spindt, P. A. (2004). Are share price levels informative? Evidence from the ownership, pricing, turnover and performance of IPO firms. Journal of Financial Markets, 7(4), 377–403. https://doi.org/10.1016/j.finmar.2004.01.001
- Foucault, T., Sraer, D., & Thesmar, D. J. (2011). Individual investors and volatility. The Journal of Finance, 66(4), 1369–1406. https://doi.org/10.1111/j.1540-6261.2011.01668.x
- Franks, J., & Mayer, C. (1997). Corporate ownership and control in the UK, Germany and France. Journal of Applied Corporate Finance, 9(4), 30–45. https://doi.org/10.1111/j.1745-6622.1997.tb00622.x
- Gao, S., & Cao, F. (2019). The anchoring effect of underwriters’ proposed price ranges on institutional investors’ Bid prices in IPO auctions: Evidence from China. International Review of Economics & Finance, 63, 111–127. https://doi.org/10.1016/j.iref.2018.08.013
- Gompers, P. A., & Metrick, A. (2001). Institutional investors and equity prices. The Quarterly Journal of Economics, 116(1), 229–259. https://doi.org/10.1162/003355301556392
- Green, T. C., & Hwang, B.-H. (2009). Price-based return co-movement. Journal of Financial Economics, 93(1), 37–50. https://doi.org/10.1016/j.jfineco.2008.09.002
- Huang, G., Liano, K., & Pan, M. (2015). The effects of stock splits on stock liquidity. Journal Economics & Finance, 39(1), 119–135. https://doi.org/10.1007/s12197-013-9250-6
- Hu, C., Lin, J. C., & Liu, Y. J. (2022). What are the benefits of attracting gambling investors? Evidence from stock splits in China. Journal of Corporate Finance, 74, 102199. https://doi.org/10.1016/j.jcorpfin.2022.102199
- Hu, C., Liu, Y. J., & Xu, X. (2021). The valuation effect of stock dividends or splits: Evidence from a catering perspective. Journal of Empirical Finance, 61, 163–179. https://doi.org/10.1016/j.jempfin.2021.01.006
- Kahneman, D., & Tversky, A. (1979). Prospect theory: An analysis of decision under risk. Econometrica, Econometric Society, 47(2), 262–293. https://doi.org/10.2307/1914185
- Kumar, A. (2009). Who gambles in the stock market? The Journal of Finance, 64(4), 1889–1933. https://doi.org/10.1111/j.1540-6261.2009.01483.x
- Kumar, A., & Lee, C. M. (2006). Retail investor sentiment and return comovements. The Journal of Finance, 61(5), 2451–2486.
- Lamoureux, C., & Poon, P. (1987). The market reaction to stock splits. Journal of Finance, 45(5), 1347–1370. https://doi.org/10.1111/j.1540-6261.1987.tb04370.x
- May, H., Chi-Chur, C., Malone, C., & Young, M. (2017). Real determinants of stock split announcements. International Review of Economics and Finance, 51, 574–598. https://doi.org/10.1016/j.iref.2017.07.027
- McNichols, M., & Dravid, A. (1990). Stock dividends, stock splits, and signaling. Journal of Finance, 45(3), 857 879. https://doi.org/10.1111/j.1540-6261.1990.tb05109.x
- Métais, C., & Roger, T. (2022). Are retail investors less aggressive on small price stocks? Journal of Financial Markets, 59, 100685. https://doi.org/10.1016/j.finmar.2021.100685
- Mukherji, S., Kim, Y. H., & Walker, M. C. (1997). The effect of stock splits on the ownership structure of firms. Journal of Corporate Finance, 3(2), 167–188. https://doi.org/10.1016/S0929-1199(96)00014-4
- Muscarella, C. J., & Vetsuvpens, M. R. (1996). Stock splits: Signaling or liquidity? The case of ADR ‘solo-splits’“. Journal of Financial Economics, 42(1), 3–26. https://doi.org/10.1016/0304-405X(95)00872-C
- Nguyen, V., Tran, A., & Zeckhauser, R. (2017). Stock splits to profit insider trading: Lessons from an emerging market. Journal of International Money and Finance, 74, 69–87. https://doi.org/10.1016/j.jimonfin.2017.02.028
- Ohlson, J. A., & Penman, S. H. (1985). Volatility increases subsequent to stock splits. Journal of Financial Economics, 14(2), 251–266. https://doi.org/10.1016/0304-405X(85)90017-0
- Pelham, B. W., Sumarta, T. T., & Myaskovsky, L. (1994). The easy path from many too much: The numerosity heuristic. Cognitive Psychology, 26(2), 103–133. https://doi.org/10.1006/cogp.1994.1004
- Pena-Marin, J., Adaval, R., & Shen, L. (2022). Fear in the stock market: How COVID-19 affects preference for high-and low-priced stocks. Journal of the Association for Consumer Research, 7(1), 115–123. https://doi.org/10.1086/711930
- Perez, M. F., & Shkilko, A. (2017). Catering through nominal share prices revisited. Critical Finance Review, 6 (1), 43–75. Critical Finance Review. https://doi.org/10.1561/104.00000042
- Phillips, M. (2020). Investors bet giant companies will dominate after crisis. New York Times, April 28, https://www.nytimes.com/2020/04/28/business/coro
- Roger, T., Roger, P., & Schatt, A. (2018). Behavioural bias in number processing: Evidence from analysts’ expectations. Journal of Economic Behaviour & Organization, 149, 315–331. https://doi.org/10.1016/j.jebo.2018.02.026
- Schultz, P. (2000). Stock splits, tick size, and sponsorship. Journal of Finance, 55(1), 429–450. https://doi.org/10.1111/0022-1082.00211
- Shue, K., & Townsend, R. R. (2021). Can the Market Multiply and Divide? Non‐Proportional Thinking in Financial Markets. The Journal of Finance, 76(5), 2307–2357. https://doi.org/10.1111/jofi.13059
- Stoll, H., & Whaley, R. (1983). Transactions costs and the small firm effect. Journal of Financial Economics, 12(1), 57–80. https://doi.org/10.1016/0304-405X(83)90027-2
- Svedsater, H., Gamble, A., & Garling, T. (2007). Money illusion in intuitive financial judgments: Influences of nominal representation of share prices. The Journal of Socio-Economics, 36(5), 698–712. https://doi.org/10.1016/j.socec.2007.01.006
- Thaler, R. (1985). Mental accounting and consumer choice. Marketing Science, 4(3), 199–214. https://doi.org/10.1287/mksc.4.3.199
- Titman, S., Wei, C., & Zhao, B. Stock price manipulation: Corporate actions and the exploitation of retail investors in China. SSRN Working Paper, 2020. https://dx.doi.org/10.2139/ssrn.3569429
- Titman, S., Wei, C., & Zhao, B. (2022). Corporate actions and the manipulation of retail investors in China: An analysis of stock splits. Journal of Financial Economics, 145(3), 762–787.
- Tuominen, P. (2022). Does nominal price matter? An Australian perspective. https://aaltodoc.aalto.fi/bitstream/handle/123456789/115590/bachelor_Tuominen_Petteri_2022.pdf?sequence=1
- Tversky, A., & Kahneman, D. (1974). Judgment under uncertainty: Heuristics and biases. science, 185(4157), 1124–1131. https://doi.org/10.1126/science.185.4157.1124
- Tversky, A., & Kahneman, D. (1985). The framing of decisions and the psychology of choice. In Behavioral decision making (pp. 25–41). Springer: Boston, MA.
- Weld, W., Michaely, R., Thaler, R. H., & Benartzi, S. (2009). The nominal price puzzle. Journal of Economic Perspectives, 23(2), 121–142. https://doi.org/10.1257/jep.23.2.121
- West, J., Azab, C., Ma, K., & Bitter, M. (2020). Numerosity: Forward and reverse stock splits. Journal of Behavioral Finance, 21(3), 323–335. https://doi.org/10.1080/15427560.2019.1672168