
 ?Mathematical formulae have been encoded as MathML and are displayed in this HTML version using MathJax in order to improve their display. Uncheck the box to turn MathJax off. This feature requires Javascript. Click on a formula to zoom.
Abstract
This paper assesses the impact of US policy responses to the Covid-19 pandemic on various technology-related assets such as cryptocurrencies, financial technology, and artificial intelligence stocks using fractional integration techniques. More precisely, it analyzes the behavior of the percentage returns in the case of nine major coins (Bitcoin—BITC, Stella—STEL, Litecoin—LITE, Ethereum—ETHE, XRP (Ripple), Dash, Monero—MONE, NEM, Tether—TETH) and two technology-related stock market indices (the KBW NASDAQ Technology Index—KFTX, and the NASDAQ Artificial Intelligence index—AI) over the period 1 January 2020–5 March 2021. The results suggest that fiscal measures such as debt relief and fiscal policy announcements had positive effects on the series examined during the pandemic, when an increased mortality rate tended instead to drive them down; by contrast, monetary measures and announcements appear to have had very little impact and the Covid-19 containment measures none at all.
1. Introduction
Following its initial outbreak in Wuhan, China, in December 2019, Covid-19 was declared a global pandemic by the World Health Organization in March 2020 (Salisu et al., Citation2020) and had a significant impact on both the real economy and international financial markets. Baker et al. (Citation2020) concluded that it affected stock markets more than any other infectious disease, including the Spanish Flu. Al-Awadhi et al. (Citation2020) found that both the daily growth in reported cases and the increasing number of deaths caused by Covid-19 resulted in a sharp fall in Chinese stock returns. Baffes and Nagle (Citation2020) found that the pandemic caused the largest slump in crude oil prices since the Gulf War. Other studies reporting a negative impact of the Covid-19 pandemic on crude oil and conventional asset prices include Sharif et al. (Citation2020), Salisu et al. (Citation2020), Topcu and Gulal (Citation2020), Ashraf (Citation2020), Zhang et al. (Citation2020), Salisu et al. (Citation2021), Okorie and Lin (Citation2021), Mazur et al. (Citation2021), Tiwari et al. (Citation2021), and Le et al. (Citation2021), among others.
Governments around the world adopted restrictive measures (such as lockdowns and travel restrictions) aimed at containing the rapid spread of the virus; these negative effects on the economy and stock markets (see, e.g., Ben Ayed, Citation2022), and therefore had to be accompanied by supportive measures. For example, in the case of US, the introduction of relief schemes such as the Coronavirus Aid, Relief, and Economic Security (CARES) Act was followed by an increase in US aggregate stock indices, namely the NASDAQ, S&P 500 and DJI, by 7.33%, 7.3%, and 7.73%, respectively. Caporale et al. (Citation2022) and Abakah et al. (Citation2021) provided evidence of the positive impact of US government Covid-19 policy responses on US sectoral and aggregate indices, respectively. Mazey and Richardson (Citation2020) documented a similar impact in the case of New Zealand, and Huynh et al. (Citation2021) in the case of Australia. Finally, Salisu et al. (Citation2020) analysed the global impact of the higher degree of uncertainty generated by the pandemic.
Given their recent exponential growth (Gil-Alana et al., 2020; Abakah et al., Citation2021; G.M. Caporale et al., Citation2022; Corbet et al., Citation2020 etc.) it is of particular interest to examine the effects of the pandemic on technology-related assets such as cryptocurrencies, Fintech and Artificial Intelligence stocks. It is noteworthy that the former are decentralized and not controlled by government or central banks, which makes somewhat disconnected from the real economy (Caferra & Vidal-Tomás, Citation2021).
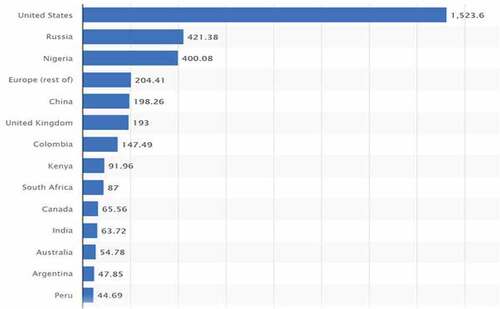
Unlike previous studies (see the literature review below for details), the present one focuses on the effects of US policy responses on the cryptocurrency markets, since the US is the main country in terms of trading volumes on online exchanges (see, Figure for Bitcoin). The analysis is also carried out for other technology-related assets, namely Fintech and Artificial Intelligence (AI) stocks, that have become increasingly popular (Kommel et al., Citation2019; Lee & Shin, Citation2018). In particular, FinTech is expanding rapidly and is expected to reach a market value of approximately $324 billion by 2026, at the compound annual rate of about 23.41% over the period 2021–2026.Footnote1 Two of the seven categories included in Fintech are blockchain and cybersecurity, which directly link it to cryptocurrencies and motivate its inclusion in our analysis together with those.
Figure 1. Bitcoin trading volume on online exchanges in various countries worldwide in 2020 (in million U.S. dollars). Source: Statista.Footnote2
Specifically, fractional integration techniques are used to analyse the effects of US policy responses to the pandemic on nine major cryptocurrencies (Bitcoin—BITC, Stella—STEL, Litecoin—LITE, Ethereum—ETHE, XRP (Ripple), Dash, Monero—MONE, NEM, Tether—TETH), and also on the KBW NASDAQ Technology Index (KFTX) for the Fintech market and the NASDAQ CTA Artificial Intelligence and Robotics Index (AI) for companies engaged in the artificial intelligence and robotics segment of the technology, industrial, medical, and other economic sectors. In particular, the contribution of this paper to the literature is twofold. First, it provides evidence on both the direct impact of the pandemic and the effects of US policy responses on those markets, such a comprehensive analysis not having been carried out before. Second, it uses a very general and flexible approach allowing for fractional values of the integration/cointegration parameter d and thus for a much wider range of possible stochastic behaviours of the series under examination. The layout of the paper is as follows: Section 2 reviews the relevant literature; Section 3 describes the data; Section 4 outlines the econometric framework; Section 5 presents the main empirical findings; Section 6 offers some concluding remarks.
2. Literature review
There exist several studies on the impact of the COVID-19 pandemic on various types of financial assets. For instance, Corbet et al. (Citation2020) analysed the dynamic linkages between the Chinese stock market and cryptocurrencies and reported that the latter do not act as hedges or safe havens but instead amplify contagion. González et al. (Citation2021) showed that the connectedness between price returns of cryptocurrencies and gold increased significantly during economic turmoil such as during the outbreak of COVID-19. In a similar study, Conlon et al. (Citation2020) examined the safe haven properties of Ethereum, Bitcoin, and Tether from the standpoint of international equity index market participants and found that Ethereum and Bitcoin are not a safe haven for most of the global equity markets examined. Shehzad et al. (Citation2021) showed that gold yielded higher returns than Bitcoin for investors on the London stock exchange in February and March 2020. Khelifa et al. (Citation2021) found different results depending on the estimation techniques used and the geographical areas considered.
Yousaf and Ali found that, in response to the higher volatility of cryptocurrencies during the Covid-19 pandemic, governments and investors tried to reduce risk by revising their policies and portfolio strategies, respectively. Sarkodie et al. (Citation2021) used the robust Romano-Wolf multiple hypothesis testing approach and found that Litecoin prices surged by 3.20–3.84%, Bitcoin by 2.71–3.27%, Ethereum by 1.43–1.75%, and Bitcoin Cash by 1.34–1.62% during the pandemic. Usman and n.d.uka (Citation2022) obtained evidence of long memory applying using fractional integration techniques to various cryptocurrencies before and during the Covid-19 pandemic. Mnif & Jarboui, Citation2021) carried out multifractal analysis and concluded that Bitcoin was the most efficient cryptocurrency before the pandemic but subsequently became less efficient than Ethereum. Lahmiri and Bekiros (Citation2020) provided further evidence of higher volatility of cryptocurrencies during the pandemic using approximate entropy and largest Lyapunov exponents approaches.
The initial impact of the pandemic was clearly very severe. On 8 March 2020 (by which time several European countries had already introduced lockdown measures) a massive sale of cryptocurrencies led to the loss of about $21 billion in the total market capitalisation value within 24 hours; this was followed by Black Monday in the stock market on 9 March 2020. Shortly after, on 11 March 2020, the World Health Organisation declared Covid-19 a global pandemic, and two days later, on 13 March 2020, the cryptocurrency markets lost more than half of their total capitalisation value. However, they had fully recovered by the end of May 2020, and subsequently exceeded the $300 billion dollar threshold at the end of July, the $500 billion one at the end of November, and finally recorded a peak market value of over $760 billion on 31 December 2020. Various papers have investigated the effects of the Covid-19 pandemic (and in some cases of policy responses) on the cryptocurrency and technology markets; these include Le et al. (Citation2021); Tiwari et al. (Citation2021); Corbet et al. (Citation2020); Mnif & Jarboui, Citation2021); Rubbaniy et al. (Citation2021); Umar et al. (Citation2021); Iqbal et al. (Citation2021); Nasreen et al. (Citation2021). Their evidence generally suggests a severe, though not long-lasting impact of the health crisis on those markets.
Note that none of the studies discussed above examine both the impact of the health crisis caused by COVID-19 and the effects of policy responses on cryptocurrencies, technology, and AI stocks within the same framework, and none adopt an econometric approach that allows for a wide range of stochastic processes. As already mentioned, the present study improves on the previous literature on this topic in both respects, since it takes into account both the epidemiological situation caused by COVID-19 and the various policy measures taken by the US government, and also adopts a general modelling framework including various types of stochastic behaviour.
3. Data description
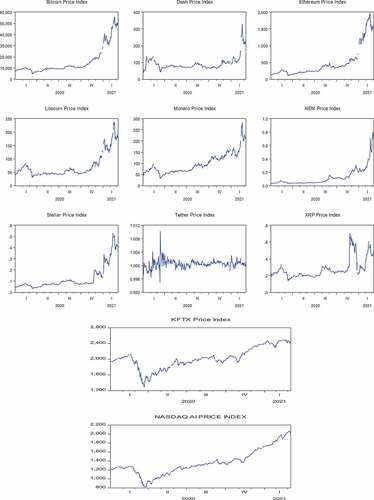
To analyse the cryptocurrency markets, the most representative coins are selected, namely those that have been in existence for more than 3 years with a market capitalization above the average for the market as a whole as of 5 March 2021. Specifically, daily prices are collected for nine major coins (Bitcoin—BITC, Stella—STEL, Litecoin—LITE, Ethereum—ETHE, XRP (Ripple), Dash, Monero—MONE, NEM and Tether—TETH) from https://coinmarketcap.com. Two more series are used for the analysis, namely the KBW NASDAQ Technology Index (KFTX) constructed to track the performance of listed financial technology (Fintech) firms in the US following Le et al. (Citation2021), and the NASDAQ Artificial Intelligence Robotics (AI) index constructed to track the performance of AI firms following Tiwari et al. (Citation2021). The sample period goes from 1 January 2020 to 5 March 2021. Figure displays time series plots of the series examined. It can be seen that in all cases there were sharp falls at the peak of the pandemic followed by a recovery.
Figure 2. Price indices of cryptocurrencies, FinTech and AI.
The Covid-19 policy response measures have been taken from the Oxford Coronavirus Government Response Tracker (https://ourworldindata.org/policy-responses-covid.com). The Containment and Health Index is a composite measure based on: workplace closures, school closures, public events cancellations, public gatherings restrictions, public transport closures, stay-at-home restrictions, public campaigns restrictions, internal movement restrictions, restrictions on international travels, testing policy, magnitude of contact tracing, covering of face and vaccine policy. The index on any given day is calculated as the mean score of the 13 metrics, each taking a value between 0 and 100. A higher score indicates a stricter response (i.e. 100 = strictest response).
The fiscal policy response variables include: income support, which provides information about the extent to which the US government has covered salaries or provided universal basic income, direct cash payments, or similar, to people who lost their jobs or could not work; debt or contract relief, which indicates whether the US government froze loan repayments and other types of utility payments, banned evictions etc. during the pandemic. Finally, the effective Federal Funds rate is included to account for monetary policy responses
We also construct shift dummies corresponding to key dates when the US government made monetary policy and fiscal policy announcements. In the case of the former, the chosen date is 15 March 2020, when the Federal Funds rate was lowered by 150bp to 0–0.25bp. As for fiscal announcements, the following dates were selected: 28 December 2019, when President Trump signed a US $ 868bn (about 4.1% of GDP) coronavirus relief and government funding bill as part of the Consolidated Appropriations Act of 2021; 8 August 2020, when he issued executive orders, mostly to address the expiration of certain Coronavirus reliefs provided by previous legislation; 11 March 2021, when the House of Representatives approved the American Rescue Plan, which provides another round of coronavirus relief with an estimated cost of $1,844bn (about 8.8% of 2020 GDP).
Finally, following Ozkan et al. (Citation2021), the direct impact of the pandemic is taken into account by using two alternative measures of the Covid-19 mortality rate (DR), namely (i) the ratio of the number of confirmed Covid-19 deaths to the total number of confirmed cases, which is widely referred to as the case-fatality rate (DR1), and (ii) the crude fatality rate (DR2), defined as the number of deaths per 100,000 of the population.
4. Methodology
We consider the following regression model:
where y(t) denotes the percentage returns of each of the market indices considered (namely Bitcoin—BITC, Stella—STEL, Litecoin—LITE, Ethereum—ETHE, Ripple—XPR, Dash—DASH, Monero—MONE, NEM, Tether—TETH, KFTX, and AI) which are calculated as the first differences of the logged series, β is a vector of unknown parameters to be estimated including a constant; z(t) = (1, CHI (t), ISP(t), DRP(t), EFFR(t), MMFPM(t), FP(t), DR(t))T is a vector including the regressors, where CHI stands for the Containment Health Index, ISP for Income Support Policy, DRP for Debt-Relief Policy, EFFR for the Effective Federal Funds Rate, MMFPM and FP are two dummies corresponding to policy announcements concerning (i) Monetary and Macro-Financial Policy Measures and (ii) Fiscal Policy, and DR for the Mortality Rate per 100,000 people. x(t) is assumed to be an I(d) process with the differencing parameter d to be estimated from the data; finally u(t) is an I(0) process, which is assumed in turn to be a white noise and a weakly autocorrelated process. Note that the second equation in (1) implies that x(t) is integrated of order d (where L is the lag operator, i.e., Lkx(t) = x(t-k)), and thus if d > 0 the series displays long memory, with higher values of d indicating higher dependence between the observations, even if they are far apart in time. We use this methodology because of its generality and flexibility compared with other more classical approaches such as unit root tests (e.g., Dickey and Fuller (Citation1979); Elliott et al. (Citation1996); Ng and Perron (Citation2001); etc) that simply consider integer degrees of differentiation. By allowing d to be any real value we can also consider nonstationary process with mean reverting behaviour, which occur if the differencing parameters is in the interval [0.5, 1).
The estimation is carried out for the d-differenced regression following a parametric approach developed in L. A. Gil-Alana & Robinson, Citation1997); his procedure tests the null hypothesis:
in (1) for any real value do. Thus, under the null hypothesis Ho (2), the two equalities in Equationequation (1)(1)
(1) can be expressed as
where and
and noting that u(t) is I(0) by construction, the estimation of β can be carried out using OLS (GLS). Using this approach one obtains the range of values of do for which the null hypothesis cannot be rejected at a given significant level, where the value that produces the lowest statistic in absolute value coincides with Whittle estimate of d (this method being based on that function). The testing procedure has a standard N(0,1) limiting distribution, which holds independently of the inclusion of exogenous regressors or deterministic terms, and also independently of the inclusion or not of autocorrelated disturbances. In addition, it is the most efficient method in the Pitman sense against local departures from the null (see, e.g., L. A. Gil-Alana and Robinson (Citation1997) for a full description of this procedure).
5. Empirical results
First we report the results under the assumption of white noise errors using in turn each of the two measures of the mortality rate (see, Tables ), and then the corresponding estimates when allowing for weakly autocorrelated process as in the non-parametric model of Bloomfield (Citation1973); see, Tables ).
Table 1. Estimated coefficients for the returns with DR1 and white noise errors
Table 2. Estimated coefficients for the returns with DR2 and white noise errors
Table 3. Estimated coefficients for the returns with DR1 and Bloomfield errors
Table 4. Estimated coefficients for the returns with DR2 and Bloomfield errors
Table displays the results when assuming white noise errors and using DR1. It can be seen that the constant is significant in the majority of cases, whilst DRP is significant and positive for eight out of the eleven series examined, EFFR is positive in the case of TETH and negative for KFTX and AI, and insignificant in all other cases. MMFPM is significant and positive for three cryptocurrencies (BITC, ETHE, TETH) and the Fintech index (KFTX), and FP for eight cryptocurrencies as well as the AI index. Finally, DR1 is also significant and negative in nine cases, whilst CHI (the Covid-19 containment measures) and ISP are not significant. Note also that the null of d = 0 cannot be rejected in the majority of cases and evidence of anti-persistence (d < 0) is obtained only for KFTX.
Table presents the estimates for the corresponding model including DR2 instead of DR1. It can be seen that the estimates of d are now smaller than in the previous case. Short memory is detected in most series and anti-persistence in the case of TETH and KFTX. The most significant regressors are the constant, DRP and FP (the latter two having a positive effect) and DR2 (with a negative effect). EFFR is significant only for TETH (with a positive impact) and for KFTX and AI (with a negative effect). Again, CHI and ISP play no role. Note that the estimates of d in Table and 1 imply short memory or I(0) behaviour since the confidence intervals include 0 and thus this hypothesis is not rejected in any case.
Table includes the estimated coefficients when using DR1 as the mortality rate and allowing for autocorrelated (Bloomfield) errors. The results are consistent with previous ones. DRP is significant and positive in a number of cases (BITC, STEL, LITE, ETHE, MONE, NEM). There is also is a significant and positive impact of MMFPM on NEM and TETH and of FP on most series. Finally, significant and negative coefficients on EFFR are estimated for TETH and KFTX, and the coefficient on DR1 is also generally negative when significant whilst those on CHI and ISP are insignificant.
Finally, Table reports the results for the model including DR2 and under the assumption of autocorrelated disturbances. TETH is the only series showing anti-persistence. In all the other cases, the null of d = 0 (short memory) cannot be rejected. The constant is significant in many cases. Significant and positive coefficients on DRP, FP, EFFR and TETH are estimated for most series, whilst the coefficient on DR2 is significant but negative and those on CHI, ISP and MMFPM are now insignificant. Note that, as before, Tables provide evidence of I(0) behaviour, with the exception of KFTX and AI, with d being significantly positive and implying the presence of long memory and long-lasting effects of shocks.
On the whole, these findings suggest that fiscal measures such as debt relief and fiscal policy announcements had a positive impact on the markets examined during the pandemic, when an increased mortality rate tended instead to drive them down; by contrast, there is little evidence of an impact of monetary measures and announcements, and the Covid-19 containment measures appear not to have had any impact. These are particularly interesting results compared to those obtained by previous studies such as Le et al. (Citation2021); Tiwari et al. (Citation2021); Corbet et al. (Citation2020); Mnif & Jarboui, Citation2021); Rubbaniy et al. (Citation2021); Umar et al. (Citation2021); Iqbal et al. (Citation2021); Nasreen et al. (Citation2021); specifically, none of those studies had provided evidence of the significant, positive impact of both fiscal measures and announcements on those markets.
6. Conclusions
This paper examines the impact of US policy measures on various cryptocurrencies as well as two technology-related stock market indices during the Covid-19 pandemic. This is an interesting issue to address given the fact that the US is the main country in terms of trading volumes on online exchanges for cryptocurrencies and also for technology stocks. Specifically, the analysis is conducted for the percentage returns in the case of nine major cryptocurrencies (Bitcoin—BITC, Stella—STEL, Litecoin—LITE, Ethereum—ETHE, XRP (Ripple), Dash, Monero—MONE, NEM, Tether—TETH) and two technology-related market indices (the KBW NASDAQ Technology Index—KFTX, and the NASDAQ Artificial Intelligence index—AI) over the period from 1 January 2020 to 5 March 2021. The adopted framework allows for both the direct impact of the pandemic (through a higher mortality rate) and the effects of US policy actions and announcements on the markets being investigated. Moreover, a very general and flexible approach allowing for fractional values of the integration parameter d is used; this includes a wide range of stochastic behaviours of the series of interest. As a robustness check, two measures of the mortality rate are considered in turn and also two alternative assumptions are made about the disturbances, which are modelled as a white noise and an autocorrelated process (as in Bloomfield, Citation1973) respectively. The results provide clear evidence that, despite the direct negative impact of the pandemic, US fiscal measures and announcements had a positive effect on the markets examined, whilst monetary actions and announcements appear to have had a very limited impact and the Covid-19 containment measures none at all. However, there are also some interesting differences between sectors. In particular, changes in the effective rate mainly affect technology and AI stocks which are more related to other developments in financial markets, whilst most cryptocurrencies, being virtual currencies, appear not to be equally connected and thus are not responsive. Interestingly, fiscal announcements, with their expected impact on the real economy, affect most types of stocks since they have a direct influence on investors’ expectations and thus on their trading strategies. This represents useful information to be used by policymakers in the event of future pandemics.
Future research could investigate additional issues such as the possible presence of nonlinearities (for instance, using a model with Chebyshev polynomials as in Cuestas and Gil-Alana (Citation2016), or alternative methods like those based on Fourier functions (Caporale et al., Citation2022; L.A Gil-Alana & Yaya, Citation2021) or neural networks (Yaya et al., Citation2021), endogenous structural breaks (applying the tests developed by Bai and Perron (Citation2003) and, in the specific context of fractional integration, by Gil-Alana (Citation2008) and Hassler and Meller (Citation2014) and gradually evolving parameters (by carrying out recursive and/or rolling estimation).
Acknowledgement
Luis A. Gil-Alana gratefully acknowledges the financial support from the Grant PID2020-113691RB-I00 funded by MCIN/AEI/ 10.13039/501100011033. Comments from the Editor and two anonymous reviewers are gratefully acknowledged.
Disclosure statement
No potential conflict of interest was reported by the author(s).
Additional information
Funding
Notes
References
- Abakah, E. J. A., Caporale, G. M., & Gil-Alana, L. A. (2021). The impact of containment measures and monetary and fiscal responses on US financial markets during the covid-19 pandemic. cesifo workiing. CESifo, Munich. Paper available at https://www.econstor.eu/bitstream/10419/236705/1/cesifo1_wp9163.pdf
- Al-Awadhi, A. M., Alsaifi, K., Al-Awadhi, A., & Alhammadi, S. (2020). Death and contagious infectious diseases: Impact of the COVID-19 virus on stock market returns. Journal of Behavioral and Experimental Finance, 27, 100326. https://doi.org/10.1016/j.jbef.2020.100326
- Ashraf, B. N. (2020). Stock markets’ reaction to COVID-19: Cases or fatalities? Research in International Business and Finance, 54, 101249. https://doi.org/10.1016/j.ribaf.2020.101249
- Baffes, J., & Nagle, P. (2020). The outlook for commodity markets, and the effects of coronavirus, in six charts. Published on Apr 23, 2020: https://blogs.worldbank.org/voices/outlook-commodity-markets-and-effects-coronavirus-six-charts
- Bai, J., & Perron, P. (2003). Computation and analysis of multiple structural change models. Journal of Applied Econometrics, 18(1), 1–14. https://doi.org/10.1002/jae.659
- Baker, S., Bloom, N., Davis, S. J., Kost, K., Sammon, M., & Viratyosin, T. (2020). The unprecedented stock market reaction to COVID-19. Covid Economics: Vetted and Real-Time Papers, 1(3). National Bureau of Economic ReCambridge, Massachusetts.
- Ben Ayed, W. (2022). The Tunisian stock market before invoking article 80 of the constitution: The (in)direct impact of government interventions during the sanitary crisis. Journal of Business and Socio-economic Development. https://doi.org/10.1108/JBSED-02-2022-0022
- Bloomfield, P. (1973). An exponential model in the spectrum of a scalar time series. Biometrika, 60(2), 217–226. https://doi.org/10.1093/biomet/60.2.217
- Caferra, R., & Vidal-Tomás, D. (2021). Who raised from the abyss? A comparison between cryptocurrency and stock market dynamics during the COVID-19 pandemic. Finance Research Letters, 43, 101954. https://doi.org/10.1016/j.frl.2021.101954
- Caporale, G. M., Gil-Alana, L. A., & Abakah, E. J. A. (2022). US policy responses to the covid-19 pandemic and sectoral stock indices: A fractional integration approach. Applied Economics, 1–10. https://doi.org/10.1080/00036846.2022.2086686
- Caporale, G. M., Gil-Alana, L., & Yaya, O. S. (2022). “Modelling persistence and non-linearities in the US Treasury 10-year bond yields”, forthcoming. Economics Bulletin.
- Conlon, T., Corbet, S., & McGee, R. J. (2020). Are cryptocurrencies a safe haven for equity markets? An international perspective from the COVID-19 pandemic. Research in International Business and Finance, 54, 101248. https://doi.org/10.1016/j.ribaf.2020.101248
- Corbet, S., Larkin, C., & Lucey, B. (2020). The contagion effects of the COVID-19 pandemic: Evidence from gold and cryptocurrencies. Finance Research Letters, 35, 101554. https://doi.org/10.1016/j.frl.2020.101554
- Cuestas, J. C., & Gil-Alana, L. A. (2016). A nonlinear approach with long range dependence based on Chebyshev polynomials. Studies in Nonlinear Dynamics and Econometrics, 23, 445–468.
- Dickey, D. A., & Fuller, W. A. (1979). Distribution of the estimators for autoregressive time series with a unit root. Journal of the American Statistical Association, 74(366), 427–431.
- Elliott, G., Rothenberg, T. J., & Stock, J. H. (1996). Efficient tests for an autoregressive unit root. Econometrica, 64(4), 813–836. https://doi.org/10.2307/2171846
- Gil-Alana, L. A. (2008). Fractional integration and structural breaks at unknown periods of time. Journal of Time Series Analysis, 29(1), 163–185. https://doi.org/10.1111/j.1467-9892.2007.00550.x
- Gil-Alana, L. A., & Robinson, P. M. (1997). Testing of unit root and other nonstationary hypotheses in macroeconomic time series. Journal of Econometrics, 80(2), 241–268. https://doi.org/10.1016/S0304-4076(97)00038-9
- Gil-Alana, L. A., & Yaya, O. (2021). Testing fractional unit roots with non-linear smooth break approximations using Fourier functions. Journal of Applied Statistics, 48(13–15), 2542–2559. https://doi.org/10.1080/02664763.2020.1757047
- González, M. D. L. O., Jareño, F., & Skinner, F. S. (2021). Asymmetric interdependencies between large capital cryptocurrency and gold returns during the COVID-19 pandemic crisis. International Review of Financial Analysis, 76, 101773. https://doi.org/10.1016/j.irfa.2021.101773
- Hassler, U., & Meller, B. (2014). Detecting multiple breaks in long memory. The case of US inflation. Empirical Economics, 46(2), 653–680. https://doi.org/10.1007/s00181-013-0691-8
- Huynh, N., Nguyen, D., & Dao, A. (2021). Sectoral performance and the government interventions during COVID-19 pandemic: Australian evidence. Journal of Risk and Financial Management, 14(4), 178. https://doi.org/10.3390/jrfm14040178
- Iqbal, N., Fareed, Z., Wan, G., & Shahzad, F. (2021). Asymmetric nexus between COVID-19 outbreak in the world and cryptocurrency market. International Review of Financial Analysis, 73, 101613. https://doi.org/10.1016/j.irfa.2020.101613
- Khelifa, S. B., Guesmi, K., & Urom, C. (2021). Exploring the relationship between cryptocurrencies and hedge funds during COVID-19 crisis. International Review of Financial Analysis, 76, 101777. https://doi.org/10.1016/j.irfa.2021.101777
- Kommel, K. A., Sillasoo, M., & Lublóy, Á. (2019). Could crowdsourced financial analysis replace the equity research by investment banks? Finance Research Letters, 29(June), 280–284. https://doi.org/10.1016/j.frl.2018.08.007
- Lahmiri, S., & Bekiros, S. (2020). The impact of COVID-19 pandemic upon stability and sequential irregularity of equity and cryptocurrency markets. Chaos, Solitons & Fractals, 138, 109936. https://doi.org/10.1016/j.chaos.2020.109936
- Le, T. L., Abakah, E. J. A., & Tiwari, A. K. (2021). Time and frequency domain connectedness and spill-over among fintech, green bonds and cryptocurrencies in the age of the fourth industrial revolution. Technological Forecasting and Social Change, 162, 120382. https://doi.org/10.1016/j.techfore.2020.120382
- Lee, I., & Shin, Y. J. (2018). Fintech: Ecosystem, business models, investment decisions, and challenges. Business Horizons, 61(1), 35–46. https://doi.org/10.1016/j.bushor.2017.09.003
- Mazey, S., & Richardson, J. (2020). Lesson‐drawing from new Zealand and covid‐19: The need for anticipatory policy making. The Political Quarterly, 91(3), 561–570. https://doi.org/10.1111/1467-923X.12893
- Mazur, M., Dang, M., & Vega, M. (2021). COVID-19 and the March 2020 stock market crash. Evidence from S&P1500. Finance Research Letters, 38, 101690. https://doi.org/10.1016/j.frl.2020.101690
- Mnif, E., & Jarboui, A. (2021). Resilience of Islamic cryptocurrency markets to covid-19 shocks and the federal reserve policy. Asian Journal of Accounting Research. https://doi.org/10.1108/AJAR-01-2021-0004
- Nasreen, S., Tiwari, A. K., & Yoon, S. (2021). Dynamic connectedness and portfolio diversification during the coronavirus disease 2019 pandemic: Evidence from the cryptocurrency market. Preprints 2021060291. https://doi.org/10.20944/preprints202106.0291.v1)
- Ng, S., & Perron, P. (2001). Lag length selection and the construction of unit root tests with good size and power. Econometrica, 69(6), 1519–1554. https://doi.org/10.1111/1468-0262.00256
- Okorie, D. I., & Lin, B. (2021). Stock markets and the COVID-19 fractal contagion effects. Finance Research Letters, 38, 101640. https://doi.org/10.1016/j.frl.2020.101640
- Ozkan, A., Ozkan, G., Yalaman, A., & Yildiz, Y. (2021). Climate risk, culture and the covid-19 mortality: A cross-country analysis. World Development, 141, 105412. https://doi.org/10.1016/j.worlddev.2021.105412
- Rubbaniy, G., Tee, K., Iren, P., & Abdennadher, S. (2021). Investors’ mood and herd investing: A quantile-on-quantile regression explanation from crypto market. Finance Research Letters, 102585.
- Salisu, A. A., Ebuh, G. U., & Usman, N. (2020). Revisiting oil-stock nexus during COVID-19 pandemic: Some preliminary results. International Review of Economics & Finance, 69, 280–294. https://doi.org/10.1016/j.iref.2020.06.023
- Salisu, A. A., Vo, X. V., & Lawal, A. (2021). Hedging oil price risk with gold during COVID-19 pandemic. Resources Policy, 70, 101897. https://doi.org/10.1016/j.resourpol.2020.101897
- Sarkodie, S. A., Ahmed, M. Y., & Owusu, P. A. (2021). COVID-19 pandemic improves market signals of cryptocurrencies–evidence from Bitcoin, Bitcoin cash, Ethereum, and Litecoin. Finance Research Letters, 102049, 049. https://doi.org/10.1016/j.frl.2021.102
- Sharif, A., Aloui, C., & Yarovaya, L. (2020). COVID-19 pandemic, oil prices, stock market, geopolitical risk and policy uncertainty nexus in the US economy: Fresh evidence from the wavelet-based approach. International Review of Financial Analysis, 70, 101496. https://doi.org/10.1016/j.irfa.2020.101496
- Shehzad, K., Bilgili, F., Zaman, U., Kocak, E., & Kuskaya, S. (2021). Is gold favourable than bitcoin during the COVID-19 outbreak? Comparative analysis through wavelet approach. Resources Policy, 73, 102163. https://doi.org/10.1016/j.resourpol.2021.102163
- Tiwari, A. K., Abakah, E. J. A., Le, T. L., & Leyva-de la Hiz, D. I. (2021). Markov-switching dependence between artificial intelligence and carbon price: The role of policy uncertainty in the era of the 4th industrial revolution and the effect of COVID-19 pandemic. Technological Forecasting and Social Change, 163, 120434. https://doi.org/10.1016/j.techfore.2020.120434
- Topcu, M., & Gulal, O. S. (2020). The impact of COVID-19 on emerging stock markets. Finance Research Letters, 36, 101691. https://doi.org/10.1016/j.frl.2020.101691
- Umar, Z., Jareño, F., & de la O González, M. (2021). The impact of COVID-19-related media coverage on the return and volatility connectedness of cryptocurrencies and fiat currencies. Technological Forecasting and Social Change, 172, 121025. https://doi.org/10.1016/j.techfore.2021.121025
- Usman, N., & Nduka, K. N. (2022). Announcement Effect of COVID-19 on Cryptocurrencies. Asian Economics Letters, 3(Early View), 29953. https://doi.org/10.46557/001c.29953
- Yaya, O., Ogbonna, O., Furuoka, F., & Gil-Alana, L. A. (2021). A new unit root test for unemployment hysteresis based on the autoregressive Neural Network. Oxford Bulletin of Economics and Statistics, 83(4), 960–981. https://doi.org/10.1111/obes.12422
- Zhang, D., Hu, M., & Ji, Q. (2020). Financial markets under the global pandemic of COVID-19. Finance Research Letters, 36, 101528. https://doi.org/10.1016/j.frl.2020.101528