
 ?Mathematical formulae have been encoded as MathML and are displayed in this HTML version using MathJax in order to improve their display. Uncheck the box to turn MathJax off. This feature requires Javascript. Click on a formula to zoom.
Abstract
In Africa, socio-economic inclusion is often predicated on the degree of access to finance that individuals have to consummate economic activities. This study is centered on this interlink with a focus on Nigeria and South Africa. From the 17 years of data (2004–2020) sourced from the Emissions Database for Global Atmospheric Research (EDGAR), International Monetary Fund (IMF) financial statistics, and the World Bank Development Indicator, the study attempted to empirically validate the existence or absence of a long-run significance of the variables used. Result confirmed that proximity to bank branches and access to credit by the private sector are vital ingredients of sustainable economic growth in both countries, while automated teller machine does not. Thus, this concluding evidence provides an avenue for expansionary policy drive for concerned authorities.
PUBLIC INTEREST STATEMENT
The study mainly looked at the key determinant of socio-economic inclusion such as: credit to the private sector, bank branches and automated teller machines, and how the trio help sustain economic growth in Africa. The vital take-away is that, access to credit, and proximity to banking services has positive implication on the economy. It helps in boosting economic activities and pave way for social inclusion. Thus, it is important that authorities are enjoined to create the enabling environment for the drivers of socio-economic activities for ultimate benefit of the economy.
1. Introduction
Since the advent of a new measure of assessing economic growth, the mantra had been that of sustainability. In order words, attention is shifting or had shifted from the regular monetary measure of production, where growth is merely a function of C + I + G + (N-X), or R = N/D and, or, that of GDP/Pop. Where, C = consumption, I = investment, G = government spending and (N-X) = difference in imports and exports. Where R = real gross domestic product; N = nominal gross domestic product and D = deflated gross domestic product. Where GDP = gross domestic product and Pop = population, to a more inclusive social, economic, and environmental growth action where; the pivotal means of measuring economic growth rest on its sustainability through human socio-economic actions (Fatoki, Citation2019; Nassar & Strielkowski, Citation2022).
Like Andrews et al. (Citation2021), Deloitte (Citation2019), Babajide et al. (Citation2015), and Basiago (Citation1999) observed, a one-stop-shop definition of social and economic inclusion is still elusive. Although, on one hand, social inclusion is seen as affording all people the best opportunities to enjoy and prosper in the society. This is affirmed in the Australian Social Inclusion Board description in 2008, which sees social inclusion as the act leading to people having resources, opportunities and capabilities to attain educational training, employment, and use of local services. Also, the United Nations Educational, Scientific and Cultural Organization (UNESCO) says social inclusion is inclusiveness for all where every individual has an active role to play (Deloitte, Citation2019).
On the other hand, Ibrahim et al. (Citation2022), Ighoshemu & Ogidiagba (Citation2022), Andrews et al. (Citation2021), and Wagdi and Hasaneen (Citation2019) opined that economic inclusion is the gradual integration of individuals and households into a broader economic and community development process. Accordingly, the aim of the integration is to address multiple challenges such as in access to markets and services, formal institutions such as in banking services (Nte et al., Citation2022)
Thus, as a measure of continuous social and economic inclusion, Khan et al. (Citation2022), Akintoye et al. (Citation2022), Babajide et al. (Citation2021), Fakunle and Ajani (Citation2021), Okunlola, Alatise et al. (Citation2020), Babajide et al. (Citation2020), Olanrele et al. (Citation2020), and Binuyo and Aregbeshola (Citation2015) assert that access to banking services such as in: proximity to account ownership, use of debit cards, automated teller machine/point-of-sales, provides a sense of social inclusion. Likewise, accessing credit for business establishment, acquisition, expansion increases economic inclusion benefits for ultimate economic growth.
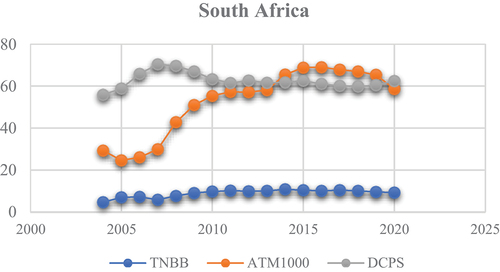
Comparatively, the Word Bank describes social/economic inclusion as access to financial services provided by the financial institutions per 1,000 adult population (Babajide et al., Citation2020). For instance, in Nigeria, the total number of access to bank branches per 1,000 adult population was 4.700 in 2004. It dipped to 3.780 in 2005 but peaked at 5.210 in 2006. Subsequently, this figure oscillated through to 2010 to stand at 6.56, and now at 4.4500 in 2020 (World Bank open data, Citation2021). Likewise, in South Africa, bank branches per 1000 adult population stood at 4.69, 7, 7.23, 5.88 and 7.6800 in 2004 through 2008. There was an increase in this figure in 2014 and 2020 at 10.83 and 9.2200 respectively (World Bank open data, Citation2021).
Similarly, records show that automated teller machine per 1,000 adult population in Nigeria stood at 0.6800 in 2004 and 2005 respectively. This figure rose to 1.78, 4.48, and 8.640 in the years 2006 through to 2009. There was an oscillatory trend through till 2020 at 16.15 per 1,000. For South Africa, 29.25, 58.04, 68.96, and 58.59 per 1,000 adult population was recorded in 2004, 2013, 2016 and 2020 was reported respectively.
Also, economic inclusion through access to credit showed that credit to the private sector oscillated throughout the period in review in Nigeria but maintained consistent rise in South Africa. For instance, in 2004, domestic credit to the private sector was #8.45 billion in Nigeria. This figure rose in 2007 to 2009 at #13.39 billion to #19.60 billion but dipped slightly in 2010. Thereafter, it recorded an up/downward swing for the rest of the period. In the case of South Africa, domestic credit to the private sector maintained a steady state at the beginning of the period in review, recording just a slight fall only in 2008. However, it retained its increase and rose steadily throughout the entire period.
Specifically, does the interplay of socio-economic inclusion as in access to banks services and credit, influence any form of economic growth potentials more or else sustaining it? How much of this contribution can be measured? To answer these questions, the study focuses on validating its outcome in Nigeria and South Africa, as being self-acclaimed the two rivalry but biggest economies in the continent.
2. Literature review
Unlike in previous decades, where economic growth measurement is premise on concepts such as gross domestic product, real/nominal/deflated gross domestic product or gross domestic product per capita today, the tide has changed (Armeanu et al., Citation2017; Emissions Database for Global Atmospheric Research -EDGAR, Citation2021; Jin et al., Citation2020). Globally, it is becoming increasingly echoed that economic growth should be determined on the basis of human inclusive actions, linked to its social, economic or environmental activities (Jin et al., Citation2020). Inasmuch as the basic assumptions of the “Principles of Population” and that of “Limit to Growth” hypotheses by Malthus and Meadows hold, global resources depletion will continue to dominate a vocal point of social-economic-environmental sustainability (Armeanu et al., Citation2017).
Literally, sustainable economic growth is a tripartite word. Sustainability, on one hand, means ensuring continuity of action which maintains certain degree of steady state from the previous or present act and, which do not limit the potential for future growth (Andrews et al., Citation2021; Deloitte, Citation2019, UNDP, 2017; Basiago, Citation1999). On another hand, economic simply relates to the state of the entire system. That is, interrelated component of whole. It also describes how this system is managed for present generation and living it in good condition for the future generation. Also, growth connotes visible increase in a state of action.
According to Basiago (Citation1999), sustainable economic growth in history is predicated upon the possible depletion or extinction of natural resources used by humans for their daily activities. This action is incapably linked to earlier economists thought like Malthus, who suggested the population geometric growth progression and that of subsistence growth in arithmetic progression hypotheses. Accordingly, he observed that, there will come a time when natural resources, to which human race depends, is depleted. As such, there is a need to an alternative growth pattern. This new thinking birthed the need for sustainable economic growth.
One of such sectors expected to act as a catalyst to fulfilling the sustainability economic growth mantra and that of the sustainable development goals is the financial institution. Banking sector sits as a pillar that integrate these actions (Babajide et al., Citation2020, Citation2021; Okunlola, Alatise et al., Citation2020). Access to the banking services in terms of account opening, remote banking services—automated teller machines, point-of-sales, mobile transfers, internet banking; credit/advances and many more constitutes some of the major functions rendered by banks in this regard (Babajide et al., Citation2020).
The composite shows to an extent the interrelationship subsisting between sustainable economic growth and inclusion. It shows that it is an intertwining process leading to all inclusion. However, there are varying measures to which these intertwining features can be examined thus, the study merely examined that relating to financial inclusion. As such, the study, like that of Okunlola, et al. (Citation2020), observed that the interplay of banking services especially in access to bank branch, automated teller cum access to domestic credit pose a greater chance of incorporating needed inclusion (Basiago, Citation1999)
Figure 1. Socio-economic inclusion link path to sustainable economic growth.
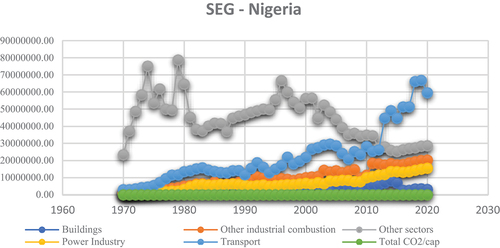
Sustainable economic growth is premised on total carbon emission (C02) across construction—building, power industry, transport industry, industrial combustion, and other industrial sectors. Figure depicts Nigeria’s sustainable economic growth per sector. As shown, emission from other sector showed the highest contributory sector to sustaining economic growth. This is closely followed by transport combustion, other industrial combustion, power industry and building industry. Overall, total emission maintained a rather relatively steady state of growth.
Figure 2. SEG—Nigeria.
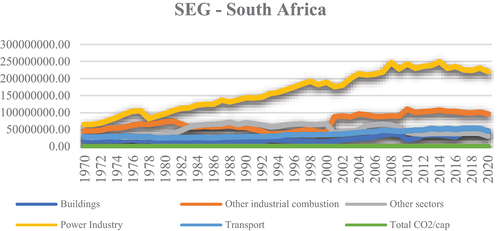
As against that of Nigeria, South Africa’s sustainable economic growth in showed that the highest emission contribution is that of power industry. This is closely followed by other industrial combustion. Next to this is other sectors which oscillate through the period. Also, building and transport is next. Overall, total CO2 omission indicate that South Africa maintained a relatively low state of emission (EDGAR, 2022)
Figure 3. SEG—South Africa.
depicts the visual trend in Nigeria' social and economic inclusion as used in the study. The trend analysis shows that all variables oscillated throughout the period in review. For instance, domestic credit to the private sector showed that it was relatively stable between 2004 through to 2006. This figure however rose astronomically thereafter reaching its peak in 2009 and 2010. Thereafter, there was a decline in domestic credit, nose-diving from 2010 through 2013 before it increases again in 2014 and 2016 declining in 2018 and 2019 respectively (World Bank 2022).
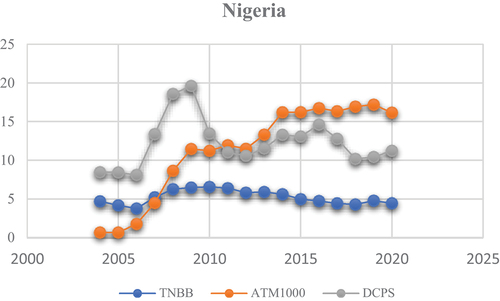
Similarly, automated teller machine maintained steady rise throughout 2004 to 2010. It rose further again in 2014 through to 2020. This is an indication of possible increase inclusion in access to near-banking operations. Further, the total number of bank branches oscillated along the same trend but did not the peak exhibit by other variables. Particularly, total number of bank branches reached its peak somewhere around 2009 ad 2010. This trend was maintained relatively but with a slight decline thereafter
In South Africa, total number of bank branches is relatively stable throughout the entire period. The trend depicts that this trend is maintained for the period in review. Similarly, automated teller machine maintained a low trend at the beginning of the period in review. This trend soar from 2007 throughout the period. Though, 2015 recorded its peak period for the deployment of automated teller machines in the country. Further, domestic credit to the private sector showed that it maintained a steady rise from the beginning of the period in review throughout the entire period. Although, like most variables, credit to private sector dipped slightly in 2010 through 2015, it did maintain this state for the rest of the period as indicated in (World Bank 2022)
2.1. Some empirical summation
While it appears that the concept of sustainable economic growth is new, the interlinked concept of inclusion has always been a matter arising in both private and public fora. Scholars such as Ibrahim et al. (Citation2022), Khan et al. (Citation2022), Andrews et al. (Citation2021), Babajide et al. (Citation2021), and Babajide et al. (Citation2020); Okunlola, Alatise et al (Citation2020), Bongers and Diaz-Roldan (Citation2019), Islam and James (Citation2019), Babajide et al. (Citation2015), Binuyo and Aregbeshola (Citation2015), Basiago (Citation1999), and Kruja (Citation2013) are among others that have examined related studies.
For instance, Ibrahim et al. (Citation2022) studied a tripartite relationship between inflation, foreign direct investment and economic growth in Sub-Saharan Africa. With the use of a panel estimation of thirty-six (36) countries, findings showed that inflation plays a major role among the set variables
Also, the study of Babajide et al. (Citation2021) examined the interplay of banking activities in relation to financial inclusion. They examined deposit mobilization in rural and urban areas, access to credit in similar fashion and number of bank branches using the vector autoregressive error correction mechanism. The period of their study was thirty-three years. Their output showed that access to credit and deposit mobilization in the rural areas is statically significant in explaining gross domestic product per capita. This result is similar in their earlier study of Babajide et al. (Citation2015) and Onaolapo (Citation2015).
In another similar topic, Babajide et al. (Citation2020) compared banking performance using Nigeria and South Africa as a case study. Total loan, customer deposit, is among the variables that were examined. With the aid of auto regressive distributed lag regression, their result showed that total loan and customer deposit re statistically significant across section.
In a similar comparative study, Binuyo and Aregbeshola (Citation2015) evaluated the impact of demographic characteristics on the choice of banking products. South Africa and Nigeria were the point of concern. Accordingly, to the snowballing sampling selection, examined using a mixed of descriptive/inferential statistics and Chi-Square statistics, findings confirmed a low probability value but high significant relationship in the choice of bank products selection.
Andrews et al. (Citation2021) demystified the concept of sustainable economic growth in an all-inclusion fashion. Accordingly, the concept of sustainability was examined in tripartite manner. In essence, social, economic and environmental sustainability was conceptualized. This was done in an exploratory manner linking the concept of social-economic-environment with that of inclusive growth. The study merely provided a conceptual framework to the study of sustainability.
Khan et al. (Citation2022), Akintoye et al. (Citation2022), Okunlola, Alatise et al, (Citation2020) also examined social and economic inclusion on the basis of activities performed by banks and its impact on gross domestic product. Again, social inclusion was proxied by access to account opening, number of banks branches (rural and urban) while economic inclusion mirrored access to loan for business expansion. Data used covered 1982 to 2017b period. From the result of the auto regressive distributed lag, it shows that rural bank branches and deposits are significant in explaining gross domestic product.
Jin et al. (Citation2020) did a global assessment of sustainable development study premised on modification of human development index using entropy method. They study in tandem with the global goal of sustainable development goals (SDGs) raised additional global awareness in which these goals ae pursued national. Accordingly, he prescribed the National Sustainable Development Index (NSDI) as modification to achieving the overall targets of sustainable development.
Bongers and Diaz-Roldan (Citation2019) examined sustainable economic growth through the eye policy and technology shocks stabilization. In the short and long-run model formulated, they argued that all seventeen goals are attain enable at the 2030 target date. Thus, a simulation exercise was conducted to confirm whether or not this is so. The outcome of the result further provided a policy framework to the study of sustainable economic growth.
Wagdi and Hasaneen (Citation2019) study also examine the challenges confronting the success of entrepreneurs in contributing to economic growth sustainability in Nigeria and Egypt. Among observed challenges are socio-economic factors present in financial and non-financial challenges, economic, environmental and lack of business model (Akintoye et al., Citation2022; Chehabeddine et al., Citation2022). The survey study provided a framework to which these challenges may be tackle for greater economic benefits. This assumption is also provided for in the green finance management expressed in Nassar and Strielkowski (Citation2022) with focus on Middle-East area.
L. Batrancea et al. (Citation2020), I. Batrancea et al. (Citation2020), and Armeanu et al. (Citation2017) study concerns were to identify drivers of sustainable economic growth in Europe. Thus, twenty-eight (29) European countries was examined. From the Panel—fixed/random effect and generalized method of movement study, result showed that expenditure per student in higher education, expenditure on research and development ad employment are positively linked to sustainable economic growth whereas; science and technology, corruption perception index is negatively signed.
Kruja (Citation2013) study provided an understanding framework to the concept of sustainable economic development in the 21st century. In his exploratory study, he argued that the traditional measurement of growth is inadequate at determining growth per head. Accordingly, he observed the gross domestic product only response to the measurement of a few rather than collective whole. Thus, he supported the link of social-economic-environmental concept expressed in sustainable economic growth.
Basiago (Citation1999) examined the concept of sustainable economic growth through the eye of urban planning and development. Basically, he theoretically x-rays economic, social and environmental sustainability in the context of development theory to urban planning. This he did with emphasis on how cultural inclination could impact on achieving the goals.
3. Methodology
In a bid to ascertain whether or not social, economic inclusion and sustainable economic growth are interlinked in the countries specified, a Panel data estimation methodology approach is used. Customarily, a need to subject the series into a Panel unit root examination preceded the Panel estimation methodology. As such, a Levine, Lin & Chu t*, ADF/PP- Fisher chi-square test was first confirmed. The outcome of this, led to estimating a three-stage Panel co-integration test of intercept, intercept and trend and, no intercept no trend analysis specified in Pedroni (Citation1999, Pedroni, Citation1993, Citation1997). Thereafter, the study proceeded to estimating the Panel analysis of Panel Fixed Effect (PFE), Panel Random Effect (PRE) and the Hausman test in vector autoregressive (var) environment having specified the lag-selection criteria automatically. The study also performed a pre-test—descriptive statistics wherein, the symmetry, flatness/peakness, platykurtotic and associated probabilities of the series were ascertained. Data used are: total number of bank branches per 1000 adults (TBB), total number of automated teller machines per 1000 adults (ATM), domestic credit to the private sector (DCPS) mirrored the study’s regressors. Wherein, total c02 per capita (buildings/transport/power/industrial combustion/others) represents the study explained variable. Data used span seventeen years, from 2004 to 2020. The World Bank Development Indicator (WDI), International Monetary Fund (IMF) financial statistics and, Emissions Database for Global Atmospheric Research (EDGAR) formed data sources for the study.
3.1. Model specified
In the ordinary form of a mathematical cause-effect relationship equation, the following formula applies:
Wherein: ϒ = explained variable; f = function; χ1.χn = regressors at nth; SEG = sustainable economic growth; Tbb = total number of banks branches per 1000 adults; ATM = automated teller machine per 1000 adult; Dcps = domestic credit to private sector.
When this is transformed econometrically, Equationequation 1(1)
(1) becomes;
Where: α0 slope of regression; Ω1 = coefficients of the parameter; εt = error term
3.1.1. Panel unit root (PUR) specified
The study Panel unit root is examined under Levin, Lin & Chu t* (LLC), Breitung (BT), Im Pesaran & Shin (IPS) and Fischer-Type Test (FTT). For this test, the null hypothesis is that all panels contain a unit root, implying that if rejected, at least some tests are stationary and result can be taking on a majority outcome (Baltagi, Citation2013).
PUR is specified thus:
Accordingly, the lag order (p) can vary over different countries. For LLC procedure, two auxiliary regressions are estimated: ΔYit on ΔYit-L and dmt to obtain the residuals (ƹit), and regression of Yit-1 on ΔYit-L and dmt to obtain the residual and vice versa. While the IPS test computes an average of Augment Dickey-Fuller statistics across the different panel units and it is derived by Yit = άi + piYit-1 + ƹit (Los and Gardebroek, Citation2015).
3.1.2. Estimating panel co-integration
The I(1) outcome of the series led to estimating the Panel co-integration. This is affirmed in Pedroni’s (Citation1995a, Citation1997) extension of the Engle-Granger based assumption as a basis for determining the existence of a long-run co-integration relationship. This is performed by assuming several tests that allow for heterogenous intercept and trend coefficients across cross-sections. As such, an AR coefficients of individual within-dimension and group between-dimension is proposed as a further test of the existence of a cointegration or not.
Thus, this is specified as follows:
where: t = 1, … T, i = 1, … N, m = 1,.M; Y & β are assumed to be of order one I(1), λi & χi = represent the individual and trend effect.
Pedroni (Citation1997) further proposes that testing for the existence or otherwise of the cointegrating series, the null is specified as in the residual ƹit, which will be to obtain whether or not the residual are I(1). In performing this process, each series are made to undergo an auxiliary process that generate the following for each level:
As such, Pedroni (Citation1993), Pedroni (Citation1995b), Citation1999) were able to determine the process to which construction of more than one process of determining cointegration among variables. Thus, testing for a null hypothesis under a two-way, three level test (within-dimension and between-dimension), individual and group statistic. That is, a ƒi = ƒ <, and ƒ, < 1, in a total of eleven parametre degrees of property N & T. where, the standardized statistic is asymptotically normally distributed is made possible and as shown:
where: = M & σ is the Monte Carlo generated adjustments terms.
3.1.3. Estimating the panel vector autoregression
In the advent of absence of a co-integration, the study performed a vector autoregression (VAR) estimates to ascertain the existence of a significant long-run relationship. This is performed in the unrestricted var environment and, lag length selection was done automatically. Similarly, the Fixed Effect (FE), Random Effect and the Hausmann test was performed. Thereafter, the Granger causation of the series is also performed. Strictly speaking, a Panel var—granger causality is estimated under the following estimation model (Note*: Equationequation 6(6)
(6) is transformed).
3.1.4. Fixed effect/random effect model
FE = Yit = X!itβ+λi+φt+ ƹit
Where φt contains the omitted variables, constant over cross-sections for FE, at every time point t.
3.2. Hausman test assumption
H0: Random Effects (RE) model is appropriate
Ha: Fixed Effects (FE) model is appropriate
By implication, the decision criterion is to reject null (H0) if probability value falls below 0.0 5 percent level of significant, otherwise accept alternative (Ha).
Thus;
Where x denotes the Moore-Pensore pseudo-inverse of the matrix proof of the equation, while the Vars are the estimates of the true covariance matrices. It signifies a three-step process that [prob> chi 2] <0.05, then Ho is rejected, implying that the Random Effect Model (RE) is appropriate; otherwise, the Fixed Effect Model is appropriate.
4. Results and analysis
The normality distribution estimation of the variables is checked via the skewness, kurtosis and Jaque-Bera in . Judging from the outcome, SEG, TBB, ATM and DCPS are positive, and are normally distributed around their mean having showed that they are 0 respectively. Further, the Kurtosis of the series showed that they are all flat—indicating that they are all < 3 thus, the series are reported as platykurtic—having lesser kurtosis than the distribution with fewer outliers. Also, the outcome of the Jaque-Bera, which is measured inversely from its corresponding probability, indicate that all series are statistically significant. By implication, this explains that the series are normally distributed.
Table 1. Descriptive result
4.1. Panel unit root test
After ascertaining the normality distribution of the variables, the study proceeded to estimate the Panel unit root test as shown in . Against this backdrop, the Levin Lin & Chu t* (LLC t*), ADF—Fisher and PP-Fisher parameters are considered. As of a rule, common significant outcome from each of the parameter is used as criteria in accepting or rejecting the presence of a unit root or not. Thus, the presence or absence of stationarity is checked for sustainable economic growth—D(SEG). The result indicates that, this variable’s common probability showed that it is not stationary at level. However, after first difference, it became stationary. The common probability for LLC t*, ADF/PP -Fisher shows that, all parameters fall below the 0.05 percent level of significance hence, it is concluded that D(SEG) is integrated of order one.
Table 2. Panel unit root result
Similarly, the Panel unit root outcome for total number of banks branches per 1000 adult D(TNBB) exhibited similar trend. This series did not become stationary at level but after first difference across all parameters. As such, it is also concluded that D(TNBB) is integrated of order one. Also, the outcome of D(ATM) is reported in similar fashion. It is also integrated of order one having not become stationary at level across parameters. Domestic credit to private sector D(DCPS) also showed that it did not become stationary a level but after undergoing first difference.
4.2. Panel co-integration estimates
On the strength of the outcome of the Panel unit root test, the study tested the existence of a long-run co-integration relationship between socio-economic inclusion and sustainable economic growth for both countries as shown in . In the words of Basiago (Citation1999), the assumption of a single equation test for the existence of cointegration as contained in Engel test is not sufficient. As such, a three-stage and eleven parameters assumption as indicated in the Table is adopted. The decision of these parameters is concluded based on common result. From the table, individual/group intercept, individual/group intercept and trend and, individual/group no intercept and no trend are assumed under the AR coefficients within-dimension and between-dimension. From the common result across all the three-level testing and individual/group AR coefficients, it shows that a significant cointegration relationship between social, economic inclusion and, by implication, the relationship between total number of banks branches per 1000 adults, sustainable economic, total number of automated teller machine per 1000 adults, domestic credit to the private sector and sustainable economic growth do not exist. As such, this shows there is no long-run cointegrating relationship among the variables.
Table 3. Panel co-integration results
4.3. Estimating short-run dynamic
This process entails that the lag selection criteria is determined. Often this is performed in the vector autoregressive environment as shown in .
Table 4. Lag selection criteria
The optimum lag selection indicated is lag (−2) as the most optimal for determining the process of short-run dynamics and performing the Granger causality test. From the result, lag (−2) is common across the various lags selection criteria. Thus, LR (−2), FPE(−2), AIC (−2), SC(−2) and HQ(−2).
4.4. Short-run dynamics—VAR
Since the outcome of the long-run co-integration showed that there is the absent of a long-run relationship between socio-economic inclusion and sustainable economic growth, the study proceeded to estimate the short-run dynamics of the series in a vector autoregression environment as indicated in .
Table 5. VAR process
Similarly, the short-run dynamics is ascertained in the vector autoregression estimation environment. The standard error (()) and the t-statistic ([]) are compared. However, the latter is often reported in most scholarly studies. Often, the ([]) is determined on a t = 2 or t > 2 basis, indicating a statistically significant relationship whereas, t < 2 indicate an insignificant relationship. This study also reported that of the t-statistical assumption. From the result, TBB showed that it is statically insignificant to SEG in the short-run having showed that it is t < 2. Likewise, that of DCPS is statically insignificant in explaining SEG in the short-run as well. However, ATM showed that it is statistically significant in explaining SEG in the short-run having displayed a t = 2 value.
4.5. Fixed effect/random effect estimates process
The study also checked the presence of significant relationship between socio, economic inclusion and sustainable economic growth by fixing associated characteristics of the variables that are used in the study. Accordingly, the fixed effect takes cognizance of the unobserved characteristics that are hitherto excluded in the pooled assumption of estimating a cross-sectional variable. Thus, the fixed effect controls for the individual countries universal effect with unique different intercept but it is time invariant. This process also varies the non-stochastic error term over each cross sections and period. As a result, the group mean is fixed and none random.()
Table 6. Fixed/random effect result
Implicitly, the fixed effect controls for the unique characteristic among the cross-sectional variables such as the variance in sustainable economic growth, total number of banks branches per 1,000 adults, automated teller machine per 1,000 adults and domestic credit to private sector.
Thus, from the result, total number of bank branches per 1,000 adults showed that it is negatively signed and also statistically insignificant judging by its corresponding probability at a value of 0.57 percent which is higher than 0.05 percent preferred level of significance. In order words, keeping all other things fixed across the countries of examination, TBB is negatively signed and statistically insignificant in explaining sustainable economic growth. Likewise, the result of the automated teller machine per 1,000 adult across-section is also negative and statistically insignificant. However, the coefficient of domestic credit to the private sector is positive and statistically significant judging by its corresponding probability at 0.04.
Importantly, one inherent weakness of the fixed effect is that it assumes fixed characteristics across sections. This does neglect the unique characteristics which otherwise would have resulted in better outcome should these fixed controls be relaxed. Thus, fixed effects may erroneously fixed specific characteristics such as time restriction, causal inferences, low statistical power, and imprecise interpretation of coefficients, imprudent comparison and other undefined variables. To cater for these limitations, the random effect model is estimated.
Having confirmed fixed effect outcome of the variables, the random effect estimation was also checked. Basically, the difference inherent in both is that the later allows for the control of time invariant assumption and, making variation a unique effect across observations. Thus, the random effect randomizes the uncorrelated time invariant in the series of the study. In effect, there is the randomization of uncorrelated time invariant independent variables against the dependent variable, which can be controlled using the generalized least square (GLS) process if the assumptions are valid. Generally, a GLS is a technique that estimates the unknown parametres in a regression when certain level of correlation between model residuals in a model are not known.
From the result, total number of banks branches per 1,000 adults is negatively signed but statistically significant from its corresponding probability at 0.02 percent. Further, the outcome of ATM showed that it is positively signed but statistically insignificant through its prob = 0.217. That of DCPS showed that it is positively signed and statistically significant as indicated by the prob = 0.0000.
Reconciling the outcome of fixed effect and random effect, Hausman Citation1978 test is used. This implies that, given associated weaknesses in predicting a FE/RE outcome, decision is taking under Hausman assumption. In Hausman test, alt: Ho and Ha conditions are assumed. First, Ho is assumed that, if outcome is greater than 0.05 percent significant level then, random effect model is not rejected and, it is thus, appropriate for prediction. Otherwise, if Ha outcome is less than 0.05 percent level of significant, it is thus, appropriate in taking decision.
Thus, since the assumption of Ho holds in this study then, the random model is appropriate. By implication, the random model showed that out of the three independent variables examined, two: TBB and DCPS are statistically significant in explaining sustainable economic growth across the two countries examined.
4.6. Granger causality
The study also confirmed the directional causation of each variable among each other using the Granger causality (GC) test. Again, GC is often examined on the basis of 0.05 percent level of significance. As such, the Ho and Ha are accepted and or rejected on this criterion. Normal acceptance and rejection conditions hold as well. Thus, from the outcome of the GC, TBB Granger causes SEG and the null is rejected. Whereas, SEG does not granger cause TBB is accepted. Also, ATM adult Granger causes SEG and, SEG Granger cause ATM null hypotheses is rejected. Further, the null hypothesis of DCPS does not Granger cause SEG is accept while, that of SEG does not granger cause DCPS is rejected. Further, the null hypothesis of ATM per 1,000 does not granger cause TBB is accepted while that of TBB does not granger cause ATM is also accepted. Also, DCPS does not Granger cause TBB is rejected while, that of TBB does not Granger cause DCPS is accepted. Similarly, the null hypothesis of DCPS does not Granger cause ATM is rejected while, that of ATM’1k adult does not Granger cause DCPS is accepted ().
Table 7. Granger causality result
5. Conclusion, policy implication, and recommendation
The overall conclusion of the study stem from the fact that the appropriateness and adequate provision of drivers of socio-economic inclusion, especially as used in this study, provides a vital path to sustaining economic growth over the long-run in both countries. Specifically, the positive and significant outcome of access to credit by the private sector clearly provides a conclusion that demonstrates the vital interlink between monetary authority actions and the socio-economic inclusion objectives. Likewise, the proximity to banking services provides similar conclusion as of the former variable.
From this conclusion, it is imperative as a matter of policy implication and implementation that, monetary authorities, across the two regions, and indeed in Africa, incorporate policy-actions that drives deliberate socio-economic inclusive goals through these channels. First, ensure adequate access to credit for private business individuals, groups and organizations. Two, ensure deliberate policy actions that breeds inclusion and that ensures that banking services are brought closer to the unbanked environment.
On the whole, the study recommends amongst other things that, authorities should put in place some measurable parameters which provides evidence of performance of the goal of socio-economic inclusion among the drivers of the objective. Likewise, provides some technical sanctions to any erring drivers that fails to align with the goal.
On the part of limitation, in spite of scarce and scanty data limitation across Africa on socio-economic inclusion, the study, based on location, opted for the often acclaimed biggest economies by size in Africa. Similarly, this limitation informed the number of periods the study reviewed. For future study, it is recommended that more measures of socio-economic indices and number of countries increased.
Acknowledgements
Financial contribution of individual authors’ is fully acknowledged. The usual disclaimer applies.
Disclosure statement
There is absence of potential conflict of interest by the author(s).
Additional information
Funding
Notes on contributors
Olajumoke Rebecca Ogunniyi
Olajumoke Rebecca Ogunniyi is a Senior Lecturer, Department of Accounting, KolaDaisi University, Nigeria. She holds a Ph.D & M.Sc., Accounting from Babcock University, and B.Sc., from Olabisi Onabanjo University.

Abiodun Funso Okunlola
Abiodun Funso Okunlola is currently appointed as a Postdoctoral Research Fellow, Department of Business Management, at the University of South Africa (UNISA). He holds a PhD Finance degree from Covenant University, Nigeria. He is also an alumnus of the University of Port Harcourt, Nigeria.
Michael Akinade Alatise
Michael Akinade Alatise obtained a Bachelor of Science degree in Accounting with Second Class Upper division from Olabisi Onabanjo University, Ago Iwoye, Ogun State, M.Sc and PhD degrees in Accounting from Babcock University respectively.
Rafiu Adewale Aregbeshola
Rafiu Adewale Aregbeshola is a Professor of International Business (Finance) and Business Strategy. Presently, he lectures in the Deparment of Business Management, University of South Africa (UNISA). Aregbeshola is an alumnus of the University of Witwatersand, UNISA, South Africa, & Olabisi Onabanjo University, Nigeria.
References
- Akintoye, I. R., Ajayi, M., Joshua, A., & Okunlola, A. F. (2022). Business sustainability through e commerce: A myth or reality in Nigeria. Business: Theory and Practice, 23(2), 408–19. https://doi.org/10.3846/btp.2022.16657
- Andrews, C., Montesquiou, A., Sanchez, I. A., Dutta, P. V., Paul, B. V., Samaranayake, S., Heisey, J., Clay, T., & Chaudhary, S. (2021). The state of economic inclusion report 2021: The potential to scale. www.worldbannk.org
- Armeanu, D. S., Vintila, G., & Gherghina, S. C. (2017). Empirical study towards the drivers of sustainable economic growth I EU-28 countries. Sustainability MDPI, 10(4), 1–22.
- Babajide, A. A., Adegboye, F. B., & Omankhanlen, A. E. (2015). Financial inclusion and economic growth in Nigeria. International Journal of Economics and Financial Issues, 5(3), 629–637. https://www.econjournals.com/index.php/ijefi/article/view/1154
- Babajide, A. A., Okunlola, F. A., Adedoyin, L., Okafor, T., & Isibor, A. (2020). Analysis of Banks profitability: Domestic and Foreign comparison. WSEAS Transactions on Business and Economics, 17, 946–955. https://doi.org/10.37394/23207.2020.17.93
- Babajide, A. A., Okunlola, F. A., Lawal, A. I., Akinjare, V. B., & Lawal-Adedoyin, B. B. (2021). Financial inclusion implication on per capita income of Nigeria. Asian Economic and Financial Review, 11(8), 603–617. https://doi.org/10.18488/journal.aefr.2021.118.603.617
- Baltagi, B. H. (2013). Dynamic panel data model. Handbook Chapter. https://doi.org/10.4337/9780857931023.00016.
- Basiago, A. D. (1999). Economic, social and environmental sustainability inn development theory and urban planning practice. The Environmentalist, 19(2), 145–161. https://doi.org/10.1023/A:1006697118620
- Batrancea, I., Rathnaswamy, M. K., Batrancea, L., Nichita, A., Gaban, L., Fatacean, G., Tulai, H., Bircea, I., & Rus, M. I. (2020). A panel data analysis on sustainable economic growth in India, Brazil, and Romania. Journal of Risk and Financial Management, 13(8), 170. https://doi.org/10.3390/jrfm13080170
- Batrancea, L., Rathnaswamy, M. M., Batrancea, I., Nichita, A., Rus, M. I., Horia, T., Fatacean, G., Masca, E. S., & Morar, I. D. (2020). Adjusted net savings of CEE and Baltic nations in the context of sustainable economic growth: A panel data analysis. Journal of Risk and Financial Management, 13(10), 234. https://doi.org/10.3390/jrfm13100234
- Binuyo, A. O., & Aregbeshola, R. A. (2015). Evaluation of banks products appeal across demographic consideration: A comparative study of Nigeria and South Africa. Journal of Economics and Behaviour Studies, 7(5), 103–226. https://doi.org/10.22610/jebs.v7i5(J).610
- Bongers, A., & Diaz-Roldan, C. (2019). Stabilization policies and technological shocks: Towards a sustainable economic growth path. Sustainability MDPI, 11(25), 1–19. https://doi.org/10.3390/su11010205
- Chehabeddine, M. R., Grabowska, S., & Adekola, A. F. (2022). Building a model for securing regional development from ecological threats. Insights into Regional Development, 4(2), 22–40. https://doi.org/10.9770/IRD.2022.4.2(2)
- Deloitte. (2019). The economic benefits of improving social inclusion. Special Broadcasting Service (SBS), August, Accessed from: www.deloitte.com/au/benefits-improving-social-inclusion.com.au
- Emissions Database for Global Atmospheric Research -EDGAR., (2021). Accessed from: www.edgar.jrc.ec.europa.eu/report_2021
- Fakunle, S. O., & Ajani, B. K. (2021). Peculiarities of ICT adoption in Nigeria. Insights into Regional Development, 3(4), 51–61. http://doi.org/10.9770/IRD.2021.3.4(4)
- Fatoki, O. (2019). Green entrepreneurial orientation and firm performance in South Africa. Entrepreneurship and Sustainability Issues, 7(1), 247–262. http://doi.org/10.9770/jesi.2019.7.1(19)
- Hausman, J. (1978). Specification tsts in econometrics. Econometrica, 46, 1251–1271.
- Ibrahim, M., Aluko, O. A., Vinh Vo, X., & Djomo Choumbou, R. F. (2022). The role of inflation in financial development-economic growth link in sub-Saharan Africa. Cogent Economics & Finance, 10(1), 1–14. https://doi.org/10.1080/23322039.2022.2093430
- Ighoshemu, B. O., & Ogidiagba, U. B. (2022). Poor governance and massive unemployment in Nigeria: As causes of brain drain in the Buhari administration (2015-2020). Insights into Regional Development, 4(2), 73–84. https://doi.org/10.9770/IRD.2022.4.2(6)
- IMF data. (2021). www.imf.org
- Islam, A., & James, B. (2019). Governance, capital and economic growth in the Arab Region. The Quarterly Review of Economics and Finance, 73.
- Jin, H., Qian, X., Chin, T., & Zhang, H. (2020). A global assessment of sustainable development based on modification of the human development index via the entropy method. Sustainability MDPI, 12(3251), 1–20.
- Khan, N., Zafar, M., Okunlola, A. F., Zoltan, Z., & Robert, M. (2022). Effects of financial inclusion on economic growth, poverty, sustainability, and financial efficiency: Evidence from the G20 countries. Sustainability, 14(19), 12688. https://doi.org/10.3390/su141912688
- Kruja, A. (2013). Sustainable economic development, a necessity of the 21st century. Mediterranean Journal of Social Sciences, 4(10), 93–98. https://doi.org/10.5901/MJSS.2013.v4n10p93
- Los, E., & Gardebroek (2015), Unravelling the links between agriculture and economic growth: A panel time series approach for post WW II Africa. 10th New Frontiers in Africa Economic History Workshop is Africa growing out of poverty?
- Nassar, N., & Strielkowski, W. (2022). Transition towards green financial sector for gaining newly perceived competitiveness by adopting a green management model. Insights into Regional Development, 9(3), 71–88. https://doi.org/10.9770/IRD.2022.4.1(5)
- Nte, N. D., Oluka, N. L., & Feartherstone, C. R. (2022). Small states, statescraft and the challenges of national security: The case of Guyana. Insights into Regional Development, 4(1), 89–104. https://doi.org/10.9770/IRD.2022.4.16
- Okunlola, F. A., Alatise, M. A., Ogunniyi, O. R., & Adejumo, M. O. (2020). Financial inclusion for sustainable economy: Empirical evidence from Nigeria. WSEAS Transactions on Business and Economics, 17, 205–214. https://doi.org/10.37394/23207.2020.17.22
- Okunlola, F. A., Babajide, A. A., & Isibor, A. (2020). Empowering women through micro finance: Empirical evidence from Ibadan, Oyo state, Nigeria. Academy of Entrepreneurship Journal, 26(1), 1–12.
- Olanrele, I. A., Lawal, A. I., Dahunsi, S. O., Babajide, A. A., & IseOlorunkanmi, J. O. (2020). The impact of access to electricity on education and health sectors in Nigeria’s rural communities. Entrepreneurship and Sustainability Issues, 7(4), 3016–3035. https://doi.org/10.9770/jesi.2020.7.4(30)
- Onaolapo, A. R. (2015). Effects of financial inclusion on the economy growth of Nigeria (1982 2012). International Journal of Business and Management Review, 3(8), 11–28.
- Pedroni, P. (1993). Panel Cointegration: Endogenous growth and business cycles in open economies. Columbia University Dissertation, UMI Publishers.
- Pedroni, P. (1995a). Panel Cointegration: Asymptotic and Finite Sample Properties of Pooled time series tests with an application to the PPP Hypothesis. Indiana University Working Papers in Economics, (95–013).
- Pedroni, P. (1995b) Endogenous growth, human capital, and cointegration for Multi-country Panels. Working paper, Indiana University.
- Pedroni, P. (1997). Panel cointegration: Asymptotic and finite sample properties of pooled time series tests with an application to the PPP hypothesis New result. Indiana University.
- Pedroni, P. (1999). Critical values for cointegration tests in heterogenous panesl with multiple regressors. Oxford Bulletin of Economics and Statistics, Special Issues, 653-670.
- Wagdi, O., & Hasaneen, A. (2019). Obstacles and success factors for entrepreneurship: A comparative analysis between Egypt and Nigeria. Entrepreneurship and Sustainability Issues, 7(2), 962–976. http://doi.org/10.9770/jesi.2019.7.2(12)
- World Bank open data. (2021). Accessed from: www.data.worldbank.org