
 ?Mathematical formulae have been encoded as MathML and are displayed in this HTML version using MathJax in order to improve their display. Uncheck the box to turn MathJax off. This feature requires Javascript. Click on a formula to zoom.
Abstract
The paper employs partial and biwavelet coherence techniques to examine the time-frequency dependence structure of international remittance inflow on economic growth by moderating the effect of exchange rates. We investigate the comovements of remittance and economic growth from 1980 to 2020. We observed heterogeneous patterns in the comovements structure of international remittance inflow and economic growth at various timescales. By examining the biwavelet coherence, the comovements are noticeable at elevated occurrences, implying that exchange rates, when acting as moderator in the nexus between remittance and economic growth, can hamper economic growth. Findings from the partial wavelet coherence reveal that exchange rates influence remittance and economic growth connectedness in emerging and frontier economies in Africa. Consequently, in situations where radical changes occur in exchange rates, the implemented policies of emerging African countries seem to have largely influenced the comovements between remittance inflow and economic growth. The risk posed by exchange rates on remittance inflow requires sustainable policies to prevent widespread spillovers, mostly during severe economic downturns. We posit that implementation of exchange rate mechanisms are central to parity which is essential to mitigating potential risk.
1. Introduction
African member states often struggle to meet import demands as domestic investment increases. International Remittance serves as one of the main sources of foreign exchange, often exceeding export revenues, official development assistance (ODA), and foreign direct investment (FDI; Gheasi & Nijkamp, Citation2017). Remittance is more than twice the size of official aid and two-thirds of FDI for emerging economies. African economies account for a third of the total remittance inflow in the world. In Africa, the composition of remittances is gradually shifting to intraregional flows over the past ten (10) years (Arizala et al., Citation2018). International remittance inflow has been impacted by financial crises and COVID-19 pandemic alongside FDI. Remittances declined more stably for emerging economies and, in some cases, increased for frontier economies as opposed to FDI inflows (World Bank, Citation2022). The resilience of remittance far outstrips FDI, especially in middle-income and low-income economies (Maslii et al., Citation2022). The rise in remittance to Africa is attributed to the high level of migration from African countries and the decline in transaction costs as technology improves with a faster and lower transfer cost.
Notwithstanding, Hien et al., Citation2020) found that there is a probability that a rise in remittance inflow could impact developing and frontier economies if real exchange rates rise.
In West Africa, Nigeria is the highest remittance receiver, followed by Ghana. In 2021, Nigeria’s remittance inflow increased by 11.2 per cent after a fall of 28 per cent in 2020 due to an increase in the use of informal channels (World Bank, Citation2022). Sub-Saharan Africa, excluding Nigeria, experienced a surge in inflow by a 16 per cent margin, which accounted for 30 billion USD in 2021. Egypt is the largest remittance receiver in North Africa, accounting for 7.6 per cent of the 61 billion USD inflow in 2021. Morocco received 10.4 billion USD, representing a 40 per cent increase (World Bank, Citation2022). These North African countries also serve as transit migration routes for migrants from West Africa. They are stages for prospective migrants to Europe and receivers of in-transit migrant remittances, making them temporary host countries (World Bank, Citation2022). South Africa as a country may act as a host and transit country for West, Central, and East African migrants. South Africa, however, received 0.9 billion USD in Remittance in 2021. Kenya received 3.7 billion in 2021 and Uganda’s 1.1 billion USD in remittances. Severe droughts in parts of East Africa saw a rise in migration trends, leading to increased remittances to the region (World Bank, Citation2022).
This upsurge in remittances has several implications for the host and countries of origin as the mass movement of people continues to increaseFootnote1 (Kumar, Citation2021, Citation2019; Kumar et al., Citation2021). The volume of financial remittance from African migrants to their home countries has also increased. Remittance has become one of the main important sources of international capital inflow in size and growth for Africa. However, with unrecorded flows through informal channels, the true size is undetermined, and it affects economic growth (Meyer & Shera, Citation2017).
African economies in recent years have seen a rise in economic growth (Lawal et al., Citation2020; Salisu et al., Citation2020). However, the impact of variations in the exchange rate on remittances could potentially impede growth in these economies. The agrarian nature of African economies continues to make them a primary source of raw materials for trade with other developing and developed economies. These latter economies depend on the industrialized economies for finished goods through imports. The economy of African countries will, thus, experience a dampening trade effect (Hu & Oxley, Citation2017). Exchange-rate variations shape growth as growth in domestic currency through appreciation could result in a significant decrease in remittance inflow. Exchange rate variations can alter remittance inflow and further influence economic growth (Dutta & Partha, Citation2018).
However, a continuous flow of international remittance to African economies affects the exchange rates and economic growth, which remains contested in the literature. The variance in the literature is perhaps attributed to the variations in methodology and challenges in assessing plausible and consistent data. Regardless of the inflow of remittances and its importance as part of international capital inflow, empirical studies on the moderating effect of exchange rates on the relationship between remittances and economic growth in African economies is rare. Despite the interest in exchange rate volatility in academia and policy circles, no study has systematically reviewed the moderating effect of exchange rates on international remittance inflow and economic growth in the African context. Even those in other jurisdiction have overlooked the international remittance inflow impact during exchange volatility. The research employs linear and nonlinear causality tests and wavelet (biwavelet and partial wavelet) coherence analyses to bring a renewed focus and understanding to the relationship. The study employs annual data from 1980 to 2021 for South Africa, Uganda, Morocco, and Ghana. We contribute to literature on the remittance and growth effect on African economies, focusing on exchange rate volatility.
Foreshadowing the results of this study, evidence from the literature shows that the exchange rate has no substantial effect on remittances and economic growth in Ghana. At the same time, countries with stabilization policies such as Morocco, Uganda, and South Africa are impacted by exchange rates.
This study is organized, in sections: Section 2 covers the theoretical and empirical background, Section 3 discusses the data and methodology, Section 4 presents the results, while Section 5 gives the study’s policy implications and conclusions.
2. Theoretical background
The relationship between economic growth and remittance has received scholarly attention. In examining this relationship, many inconclusive, positive or negative arguments have been made with no specific theoretical solution. In addition, arguments have been made based on theoretical models. Researchers examining this relationship have made extensions to growth models.
The Solow Growth ModelFootnote2 which was built on the Keynesian-Harrod-Domar model which is the basis for modern theories on economic growth under the neoclassical growth model. The model examines changes in the level of economic growth output as population growth, savings, and technology rates change. When economies have the same rate of population saving and technology growth rate, the model predicts that they will converge as they have the same steady state. However, economies with variations in the state of population, savings and technology model have no absolute convergence. In these economies where the initial capital stock is low, variation in savings rate do not encourage growth.
The Solow growth model assumes an exogeneous savings rate whereas, extending the Solow growth model to the Ramsey growth model considers the household which chooses the optimal saving rate. In the Solow growth model, although the savings rate does not affect the long-run growth rate, it however affects capital and output. On the other hand, the Ramsey growth modelFootnote3 explores variations in savings rates across different economies, which in turn explain the variations in their levels of income. Extensions of these neoclassical models to include remittances are premised on the role of remittances in the household budget constraint. It is argued in both models that if there is no change in savings and investment rates, there will be no impact on the economy.
However, where there is convergence in growth with other countries, economies with low economic activity would potentially positively impact productivity. Supposing that remittance is channelled through investment which changes the growth path towards convergence, growth is achieved in the short term, and remittance is channelled through capital investment; both human, physical, and new enterprises will act to reduce macroeconomic volatility (Hosny, Citation2020; Kumar, Citation2021; Kumar et al., Citation2021). However, when it is channelled through consumption, it has a limited impact on competitiveness in trade and economic growth (Feeny et al., Citation2014).
Additionally, the Marshall-Lerner theory, which argues the effect of exchange rates on economic growth, is seen in how measures such as tariffs and subsidies affect imports and exports (Boyd et al., Citation2001). In countries of origin where tariffs and quotas are used as control measures, appreciation of the country’s currency may occur. However, the theory argues that countries of origin can improve their trade balance by depreciating their local currency under these circumstances. For example, when the demand for imported goods falls, the prices of imported goods increases. An appreciation of the local currency is thus, achieved. However, in the case of exports, a depreciation in the local currency leads to a rise in exports as prices for exported goods decline.
Furthermore, host countries are impacted by this effect and often put-up barriers through tariff on imported goods from the country of origin. This position has been a debate among economists in the global trade market. The effect of a general rise in the prices of goods and services will eventually lead to a decline in aggregate demand. A decline in demand, in turn, changes economic growth and causes unemployment. The resulting possibility of a trade war between the countries, as is seen in the US-China case, is a clear example. In 1946 Marshall-Lerner proposed changes to the Marshall, Citation1923) theory on the price elasticity of demand using exchange rate policy as a tool to bring balance to trade (Dong, Citation2017). From this proposition, countries of origin can improve their trade balance eventually by using a currency depreciation strategy. Bahmani-Oskooee et al. (2016a) examined the effect of change mechanisms employed by countries of origin during the currency depreciation process by extending the M-L theory.
Alternatively, the J-curve theory asserts that a decline in currency value in the short run leads to increased spending on imports. Thus, consumers pay a higher price for imported goods in the country of origin using the local currency. This effect is due to the rise in foreign currency value in the country of origin. However, the price of exports is less expensive in the short term after a fall in currency value. The country-of-origin firms receive lower pay for goods and services than the initial price. This opposite effect is based on the demand for imported goods, which will decline eventually in the country of origin. The same goes for the effect on exports (Ivanovski et al., Citation2020).Footnote4
These two theories have been used to examine various economic data by Dogru et al. (Citation2019) on exchange rate fluctuations in tourism in Canada, Mexico, and the U.S. using monthly data from 1996 to 2017. Using autoregressive distributed lag cointegration and error correction mode we found that the M-L proposition and the J-curve positively impact the U.S. trade balance when there is a decline in the U.S. dollar value. They found that an appreciation in the U.S. dollar negatively impacts U.S. tourism to Canada and the U.K. However, there is no known impact on US-Mexico tourism. Thus, the study supports the M-L condition while rejecting the J-curve proposition.
3. Empirical review
Empirical evidence on the effect of remittance on growth has found a positive impact among developing countries (Bashir, Citation2020; Bucevska, Citation2022; Chaudhary, Citation2022; Ekanayake & Moslares, Citation2020; Ellahi & Omer, Citation2020; Oteng-Abayie et al., Citation2020; Safadar, Citation2022).Footnote5
In the case of remittances, exchange rates, and economic growth, very few studies have been conducted examining their relationship. Rapetti (Citation2020), examining exchange rate and economic growth using a systematic survey, significant positive relationship for developing economies; however, it does not consider the impact of remittances. Thus, examining all their variables is not often examined, as in the following studies. McFarlane et al. (Citation2022) examined the relationship between remittances and exchange rates in Jamaica from 1977 to 2019 and found that remittance leads to an increase in the value of the exchange rates. Using autoregressive bounds and the Granger causality test, they conclude that the Dutch disease effect exists. In Bangladesh, the exchange rate positively impacted growth using time series data from 1990 to 2020, applying the ordinary Least Squares method (Khan, Citation2021). Nguyen (Citation2017), examining Vietnam, found a significant positive effect of remittances on economic growth enabled by the exchange rate regime. Thus, a rise in remittance inflow could lead to a fall in exchange rates. Senadza and Diaba (Citation2017) find that eleven of the sub-Saharan markets examined had no significant impact from exchange rate variations. The study used a pooled mean group estimators for dynamic data from 1993 to 2014. They found that in the short run, exports experienced a significant negative relation with imports.
A few panel studies have been conducted in recent years, which examined this relationship. Hien et al., Citation2020), examining exchange rates, remittance, and economic growth relationships for thirty-two countries in Asia, found a positive and meaningful relationship. The study used the Generalized Methods of Moments (GMM) and Linear Dynamic Panel Data (DPD) model from 2006–2016. They found that the Dutch disease effect on the Asian economies was characterized by low remittance to GDP ratio and vice versa. Jena and Sethi (Citation2019), using autoregressive distributed lag bounds, found economic growth and remittances to impact the real exchange rate significantly positively.
The movement of people across borders continues to impact the interdependence of economies at economic, social, governance, and environmental levels. African countries are a part of this impact. Despite the importance of remittance inflow on economic development, the effect, moderated by the exchange rate has received little to no attention in the literature. Studies on the subject have consistently examined the causality effect due to the neglect of the moderating effect of exchange rate and the nonlinear causal effect. The few studies that examined the relationship included one or two in their group study without investigating the moderating effect of the exchange rate (Senadza and Diaba Citation2017). Often, studies do not examine the combined and individual effects of all three components. Studies focus on the factors contributing to the impact of remittances and exchange rates on growth. The present study seeks to fill this gap by examining the linear, nonlinear relationship and time-frequency comovements properties vis-à-vis the influence of moderating macroeconomic variables.
4. Methodology
4.1. Data
Based on availability of data we employ yearly time series for remittances, economic growth (proxied by changes in gross domestic product ) and exchange rate from 1980 to 2020. The data was sourced from the World Development Indicator database (World Bank, Citation2022).Footnote6
We obtained data uniformity by matching to downplay on nonsynchronous timestamp and further converted to growth rates. We analyzed the data and filled up the missing values. It should be noted that when using a collected dataset which may contain incomplete data, with missing attribute values leads to wrong analysis. Incomplete dataset could be due to variations in source, network, or mistaken entries, among others. In our dataset, the nature of the missing data (missing at random) MAN was filled using the missing value imputation (MVI) technique of the under moving average (Lin and Tsai, Citation2020).
To ensure consistency, we obtained three (3) macroeconomic datasets for selected remittance-dependent countries, which are changes in gdp, exchange rates and remittances from the four selected African countries, namely, Ghana, South Africa, Morocco, and Uganda. These countries were selected based on the amount of remittance inflow that explains the changes in their gdp. We also considered the countries based on the leading receiver of remittance subject to the availability of data. These selected countries are, respectively, the second largest recipients of international remittance inflows within their regional economic communities in Africa (ECOWAS, AMU, SADC, and EAC). It should be noted that based on missingness in the datasets for exchange rates, Nigeria, Egypt, and Kenya were dropped. We did so because of the inconsistencies in the data for exchange rates which are crucial to the study.
4.2. Linear granger causality test
In this study, we have employed the standard Granger Causality to assess the existence or non-existence of a linear association among between remittances and economic growth (i.e., changes in gdp) for the selected African economies.
Empirical evidence on causality has been invariably based on Granger test (Granger, Citation1969), as a conventional method for testing causality. The Granger test assumes parametric linear, time series model for estimating the conditional mean. However, it requires the linearity assumption to be present as the test estimates the whether the lags of one variable fits in the equation of another variable. The test is based on residuals which is sensitive only to causality in the conditional mean. The covariables from this approach, however, may influence the conditional distribution in responding to nonlinear ways for which nonlinear causality test performed (Bekiros & Diks, Citation2008a)
The study assumes that (,
,t
1) to scalars rated strictly as stationary time series dataset (namely, I(0)). We assert that (
) time series granger causes another time series (
(Granger, Citation1969). If the current value of one variable is related to the previous value of itself and another variable. The vector autoregression (VAR) model is employed (Sims, Citation1980).
Where and
are the endogenous variables,
and
represent the residuals from the model. To test the causality of
on
we set the null hypothesis of
does not cause
, as
. The second null hypothesis is of
does not cause
as
.
Model is as follows;
Where and
represent the intercept, REM is the remittance inflow, GDP is economic growth,
and
are the coefficients to be estimated, and
represents the lag order selected based on the Akaike Information Criteria (AIC). The null hypothesis for Equationequation (1)
(1)
(1) states that remittances do not Granger cause economic growth. For Equationequation (2)
(2)
(2) economic growth does not cause Granger remittance. Furthermore, we apply the Wald test to examine the joint hypothesis for
=0 and
= 0.
4.3. Nonlinear granger causality test
We embark on this study under the assumption that remittance and economic growth relationships are linear in nature. However, it is reasonable to examine the argument for nonlinearity.Footnote7 Parametric linear Granger causality test have been shown to have low power when nonlinear alternatives are present.Footnote8 Nonparametric approaches have become appealing as they directly place an emphasis on the prediction without imposing a linear function form. Over the years, different nonparametric test has been proposed with (Hiemstra & Jones, Citation1994) modifying the work of (Baek & Brock, Citation1992). The resulting nonlinear dynamic relationship test can detect nonlinear Granger-causality relationship between variables. The test examines whether the past values influence the present and future values. This test, however, has been found not to be generally compatible with Granger causality test which leads to spurious rejections for the null hypothesis (Diks & Panchenko, Citation2006). The limitations to the (Hiemstra & Jones, Citation1994) test is overcome with the test statistic developed by (Diks & Panchenko, Citation2006).
We have employed the D&P test (Diks & Panchenko, Citation2005, Citation2006) over the (Hiemstra & Jones, Citation1994), an altered test developed by Baek and Brock in 1992. Hiemstra and Jones approach set the lower stringent i.i.d hypothesis. However, in the D&P test, there is no general compatibility of the Granger causality. The H&J test leads to a parasitic rebuff of the stated null hypothesis for testing Granger causality. Thus, the study uses the D&P test as it does not exhibit this limitation.
We assume static and feeble dependents, namely, ,
, allow
, be the k length leading to the vector of
and
, the
the lag length of
and finally,
the
lag length of
(
,
1). We assume a null hypothesis; on Granger causality regarding the fixed distribution of the (
+
k) vector component
=(
,
,
), the time subscript can be dropped. The joint probability density function
(a,s,w) along with its marginals under null should ensure:
The latter states that S and W are independently conditionally on X = x for each fixed value of x. D&P demonstrate that this reformulated null hypothesis implies:
where the proposed estimator for q is:
Where, =I(
||
), with I(
) being the metered function and
, the sample size of the series relies on the bandwidth. Therefore, by denoting
(
as the local concentration of the assessor of the vector
at
, will be:
The (
), Statistics is expressed as follows:
D&P test prove if =
with (D > 0,1/4 <
<1/3), thus,
(
converged the series for the standard normal distribution:
Where is the projected as the standard error,
(
). The probability of eliminating the null is decreased using the D&P nonparametric test.
4.4. Wavelet methods
Wavelet transformation is widely used in financial analysis to deal with problems of non-stationarity in time series. Wavelet transformation is made up of two types, namely, Continuous Wavelet Transformation (CWT) and Discrete Wavelet Transformation (DTW). The discrete transformations are centred on an orthogonal wavelet. However, these wavelet transformations are used for nonorthogonal wavelet functions (Aloui et al., Citation2018).Footnote9 We use CWT, which is good for identifying and isolating periodic signals. It provides stability between time- frequency localization to give an improved trade-off between the detected undulations, peaks, and gaps. However, DWT is only appropriate for reducing and compressing noise in the data (Wu et al., Citation2020).Footnote10
4.4.1. Continuous Wavelet Transformation (CWT) and coherence
CWT is a useful method for assessing the changing aspects of nonstationary variables across time and domain space. Using the wavelet function, we decomposed the time series to ensure a localized time-frequency space and zero mean. Information about the local neighbourhood was obtained based on the decomposition. Morlet wavelet was employed by examining the frequency and time spaces behaviour of the time series data. Specification of the wavelet coherence (W.C.) is specified below:
If, is the stabilization component certifying unit for the variation of wavelet
=1;
represents location boundary, giving the precise location of the wavelet, where s represents the level of expansion in boundary. It defines in what manner the wavelet is spread out.
The Morlet wavelet:
Where represents the main occurrence of the wavelet. Extracting from literature,
is to 6. Moreover, with the convolution employed on a discrete sequence, a scaled and translated wavelet, the CWT is given as:
Estimating the exact wavelet onto a time series, we obtained
. Similarly, the key benefit of a CWT lies in its ability to decompose and rebuild the function of
The power spectrum evaluation was assessed using Eq (C4) with the variance measurement.
The AR (1) allows for the modelling of the red noise in the background of the spectrum. Given the null hypothesis, we allow for the pockets found in the peaks of the wavelet power spectrum (WPS) to be evaluated for their significance level. We use the Monte Carlo simulation. The resulting local WPS is found in the distribution of the individual time n and scale s (Torrence & Webster, Citation1999).Footnote11
Given:
f is denoted , representing the mean spectrum at Fourier frequency in the given data. Given that the wavelet scale aligns with the Fourier frequently (s
1/f), v = 1 represents a real wavelet, and v = 2 represents a complex wavelet. Given as
as the variance of the variable.
We probe the combined behaviour of time and frequency in the economy; a CWT must be given to pinpoint the common power amongst the variables (Aloui et al., Citation2018). CWT power allows for the region’s location for which the macroeconomic variable co-moves in time and frequency. In the case of a particular macroeconomic variable series (χ) and another macroeconomic series (Y), given the individual wavelet spectra and
the CWT for macroeconomic series can be given as follows:
Given that u represents the position of s, the scale *, represents the complex conjugation. The CWT indicates the area, time, and space have the highest common power. Thus, (s) represents the complicated conjugate of
. The cross-wavelet power |
| evaluates the shared area covariance on every individual level. W.C. for two-time series is given as χ =
and y =
.They represent the frequency groups and time gaps for which the series covary. We allow for the detection of comovements among macroeconomic variables. The W.C. is, thus, the square absolute value of the normalized WPS. Hence, the squared wavelet coefficient is expressed as follows:
Given S as the smoothing parameter, it seeks to balance the resolution and significance level. Any problems in the WPS and the wavelet cross-spectrum (WCS) are removed. The stabilizing function of W.C. for PWC and MWC cases, the same principle is applied.
The expression “coherence” fulfils the inequality equation 0 . Values near 0 point to a low correlation; however, values near 1 point to a robust correlation. In examining macroeconomic comovements, coherence is the most suitable.
The phase form is centred on the lag of oscillation between two the variables as a frequency, assuming that , explains the phase difference in the economy; the phase difference between χ(t) and y(t) is given as:
Given and
, we assume that smoothed CWT has two parts, namely, the imaginary and real. The wavelet coherence map shows the directional arrows. The arrows distinguish the various phase forms. For example, where x(t) and y(t) are in-phase (antiphase), the arrow points to the right (left). Equally, when the arrows point downwards (or upward), it indicates y(t)/x(t) is in the lead.
4.4.2. Partial wavelet transform and coherence
Partial wavelet coherence follows a simple concept of correlation which is the comovements between two series. The PWC cancels the effects of any other confounding variable. Wavelet coherence was employed to measure the linear correlations while highlighting the intermittent correlations. The PWC map highlights the significance level for real correlation among the variables. It should be noted that it does not produce a pure correlation between the macroeconomic variables. The possibility that other factors may influence them in the economy. This possibility is dealt with using partial correlation.
The following comovements under wavelet transform coherence represent the different possible variable combinations.
It follows as:
In the application of the wavelet measure PWC, we eliminated the influence of other factors in the time series data, given s (t) wavelet coherence between χ(t) and y (t) (see Gurley, Kijewski & Kareem, Citation2003: Ng & Chan, Citation2012). The equation below shows PWC partial correlation in its squared form.
Given:
Given is like as
; interpretations for the equations range from 0 to 1. From the results of the PWC, where a low region
, and high region
; shows time series y does not affect x. Alternatively, the variance of x is dominated by the z time series. In the case where there is no significant level of difference among
and
, it means there is no significant level of influence from y and z on x. For our study, we denote our variables as a remittance by x and economic growth (gdp) by y, while the exchange rate denotes as z. The wavelet transformation could potentially result in a random number when the process is mixed. Leading to identification problems in the independent process during the significance test. We employed Monte Carlo methods in examining PWC, just as in the case of W.C.
5. Empirical results
5.1. Summary measures
We examine and present summary measures of the relationship between remittances and economic growth moderated by the exchange rate for four African economies. The growth data were used for the analysis. The descriptive statistics of the selected variables are reported in Table .
Table 1. Descriptive statistics
In our analysis, the growth data is annual in nature. Descriptive statistics of the macroeconomic data are represented in Table , which demonstrates the variations in the distribution of the series. Additionally, our sample period is from 1980 to 2020, with 41 observations.
5.1.1. Linear and nonlinear causality analysis
Table in appendix A shows the linear causality test for Ghana, South Africa, Uganda, and Morocco. The results show no direct relationship between remittance and GDP for all four selected countries at all the optimal lag lengths. Thus, no significant relationship exists between remittance and economic growth, confirming the results of Lawal et al. (Citation2020). By examining the relationships of causality, we employ linear and nonlinear analysis to confirm or reject the existence of causality among the macroeconomic variables. In line with the above reasoning, we relaxed the assumption of linearity between remittance and economic growth. We employed the D&P test, which allows for nonlinearity testing to be conducted for all four countries. First, we evaluated stationarity in the series for nonlinear causality. We applied the D&P test to the transformed series by eliminating the linear prognostic power using a vector autoregressive (VAR) model. Thus, casual linkages from the selected residual to the next are regarded as a nonlinear prognostic power.Footnote12 The lag length is determined by the VAR measurement based on the Akaike information criteria (AIC).
Table presents the D&P test outcomes where the variables of interest for all four countries are found, and they do not have any nonlinear causal linkages. We cannot reject the nonlinear causality relationship of the VAR residual series for the selected African countries, given that there is no indication of nonlinear dependence being seen. We implemented the same approach as Bekiros and Diks (Citation2008a, b) with our expansion of the bandwidth set equal to 0.5,1.5, and 2.0 for the test. We can argue that for all the countries examined, there is no significant linear, unidirectional causality from remittance to economic growth. Thus, there is weak evidence of nonlinear causal linkages in the series examined.
5.1.2. Bivariate and partial wavelet coherence results
Next, we employ a second approach by examining the relationship between remittance and changes in gdp for four (4) remittance-dependent economies. In this step, the pairwise wavelet coherence plots were considered a reference point before delving into the PWC (partial wavelet coherence). We employed biwavelet Coherence (W.C.) to evaluate the strength of interdependence for the examined domain. From the biwavelet coherence plots, we displayed time on the horizontal axis and frequency on the vertical axis. A warm colour region is displayed on the plot where time-frequency space has a pairwise time series covarying. Again, areas where the region’s colour is represented by red (warmer colour), indicate a significant interrelation between the paired time series. Regions where the regions are blue (colder colours) reflect a significantly lower dependence. These explain the colour pallet on the W.C. plot, which explains the level of strength when measuring the interdependence among the paired time series.
The region of colour found within the cone of influence (COI) is referred to as the crosshatch. In the plots presented, the thick grey contour represents 95% significance and confidence level of interdependence. The confidence level is attained from Monte Carlo model employed in the analysis. Regions found beyond the area of significance, be it blue (cold colour), indicate the time and frequency where no level of dependence exists among the series under examination. However, area, where red (warmer colour) is found indicate interdependence among the series.
In the plotted W.C., the lead/lag phase is represented by black arrows. The arrows point out the relationship that exists between the paired series. In W.C. plots, a zero-phase variation can be observed. The plot indicates that at any point in time, a paired series moves simultaneously due to a specific measure. Arrows pointing to the right on a W.C. plot indicate that the series is in phase and moving in the same direction. However, arrows that point to the left indicate antiphase.
Furthermore, where an antiphase is observed, the movement of the paired series is found to be in opposing directions. When the arrows move right-down or in a (left-up) form, it indicates that the first series in the pair is leading. On the other hand, where the arrows are right-up (left-down), the second series in the pair is said to be leading.
Figs highlight the biwavelet and partial wavelet coherence plots for remittance, gdp, and exchange rates. These maps cover Ghana, South Africa, Uganda, and Morocco. The exchange rate is examined as a covariate variable for this study. The results from the bivariate investigation can be found on the left-hand side. We also presented the PWC plots, which can be found on the right-hand side.
From Figure , Ghana’s comovements between remittances and gdp are primarily concentrated in a 0–8-year cycle. Pockets of islands were observed during the 0-7-year cycle. An intense connectedness between 1990 to 1995 and 2005 to 2010 occurred twice during the study period.
Figure 1. The left-hand side of plot represents the wavelet coherence between remittance and GDP. Right-hand position plots of partial wavelet coherence show remittance and GDP, removing the effect of exchange rates. The crosshatch reveals regions within the cone of influence (COI). The thick gray contour signifies the 95% confidence level. Arrows on the right-hand side suggest the comparative phase connection, leftward arrows represent antiphase, and upward pointing arrows imply remittance as leading.
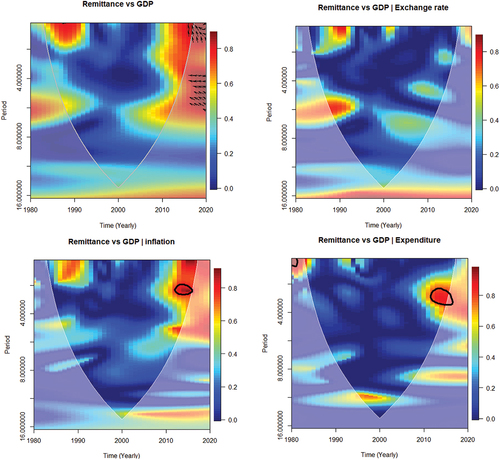
Figure 1. Continued.
From an overvalued currency under the fixed exchange rate system, where the cedi was pegged to one or more currencies, to the managed float where exchange rates were weekly determined at auction. This system moved the pegged rate to either a flexible or floating exchange rate regime. The country moved to a flexible exchange rate system in June 1978. Under the flexible exchange rate system, the Ghana cedi in terms of the US dollar was adjusted to account for the economic, financial, and balance of payment issues the country faced at the time. However, over the years the currency has continued to depreciate. This because the positive impact of the flexible exchange rate was short lived as GDP increased and inflation declined during the period with government trade liberalization policies being implemented (Nimoh & Addai-Asante, Citation2018). This is clearly seen in the years to follow with Ghana coming off recession in 1994 based on the economic reform backed by the Bretton Woods system. Ghanaian households dependent on remittances for livelihoods received an elevated level of remittances inflow for support. The uneven economic recovery of Ghana with exports on the rise, foreign exchange inflows rose backed by crop production (cocoa) and minerals.
Nevertheless, with low salaries and public service rates, the high poor Ghanian bore the negative effect of the austerity program, leading to a rise in remittance dependency. During the 1980s, under the austerity program, much skilled labour emigrated for greener pastures to the West. These people, in turn, supported their families through remittances in the face of difficulty.
From 1999 to 2007, the discovery of commercial oil production quantities and the rebasing of its accounts pushed the per capita gross domestic product (GDP) above USD1000. From the plot in 2007, interdependence between remittance and economic growth was low as confidence in the market grew (Aryeetey & Baah-Boateng, Citation2015). This feat was furthered by Ghana’s heavy debt forgiveness and commitment to the United States Millennium Challenge Corporation support, among other programs (Osei et al., Citation2020). The forgiveness of Ghana’s debt led to strong projections and capital inflows (investment), reducing the dependency level on remittances. However, these structural changes in the economy were led by a decline in agriculture sectors’ share in employment, leading to low productivity and muting growth effect in the economy (Osei & Jedwab, Citation2016).
From 2008, Ghana, however, was heavily impacted by the financial crisis, which saw the reversal of the gains made. For the average Ghanaian, the decline in growth momentum translated into their livelihoods as level and quality of education and skills declined. Since 2010, we find the interdependence has been high as levels of unemployed graduates rise, coupled with a rise in interest rates and inflation, and job creation continues to decline. Thus, increasing the dependence on remittance. The financial crisis of 2008 has continued to impact growth in Ghana.
The pattern of comovements between remittance and economic growth is in antiphase and pointing straight up to with a clear case of remittance leading 2016 to 2020. We find that remittance leads to due to several factors. A rise in emigration from the country due to a lack of decent jobs and low-income levels among graduates and skilled employees was seen. Thus, increasing remittance dependency among Ghanaian households. COVID-19 pandemic from 2019 to 2020 was a major factor in remittance dependency increment as quarantine and closure of borders reduced trade and slowed growth. After emerging from the health pandemic, Ghana continues to grapple with the lingering effects on its economy. The effect is seen in the 2022 World Currency report, with Ghana’s currency ranked as the worst performing currency in the world based on a 30-year analysis (Bloomberg, Citation2022). With a low level of competitiveness in foreign goods on which Ghana is highly dependent, depreciation in the currency has avertedly slowed growth, although competitiveness in domestic goods has risen as the balance of trade increased. In the petroleum sector, Ghana’s fuel is purchased from overseas as the country does not refine its oil products. The rise in fuel prices in Ghana has been due to, in part, the war between Russia and Ukraine, leading to a price hike in all other fuel-dependent businesses (for example, the transport sector) in the country. Again, the prices of cereals and agricultural products (for example, wheat and fertilizers from Ukraine) have increased, affecting all sectors of the economy. Prices have risen (inflation), for which the country has struggled with since 2003, is seen on the WC plot.
The right-hand side of Figure demonstrates the PWC plot between remittance and economic growth by excluding the influence of exchange rates. In Figure (B1), for Ghana at a 95% confidence level inside the cone of influence, we found that there is a low level of dependence between the remittance and changes in gdp. However, the years leading up to 2000, the dependence level excluding exchange rate showed significant interrelation from 6% to 8%. Comparing bivariate wavelet coherence and PWC, we found that the influence of exchange rate on remittance and gdp is no longer significant when excluded from the relationship. Lower levels of significance below 5% are seen declining beyond 2005.
Furthermore, there is a considerable decline in the region of warmth between remittance and changes in gdp on the PWC plot, which implies the exchange rate is the main driver of comovements between selected variables. The results show the significance of monetary policy uncertainty on the exchange rate as a driver of economic growth decline. The high informal structure of the Ghanaian economy, which has gradually shifted to low-value service activities, and the continuous decline in the manufacturing of value-added products in Ghana hampers growth. Economic transformation efforts by the government to promote job creation, high secure incomes, and livelihoods have made little to no impact.
The level of economic complexity is low in Ghana, with a comparative advantage mainly in producing agricultural and natural resource products as raw materials (Baah-Boateng & Twum, Citation2020). Coupled with exposure to fluctuations and high volatility in the exchange rates, macroeconomic fundamentals are unable to explain the fall in growth. This lack of control of the deteriorates economic growth and recovery. A rise in the dollar on the cedi has made it difficult for Ghanaian business to export to the US. Again, issues such as unemployment and high inflation have been exacerbated. We see this happening in the country as the cedi depreciates further, inflation increases as demand for goods rises. Furthermore, the country’s current account worsens as the import price increases. Ghana needs policies that reduce its dependency on crucial goods such as fuel, which is largely imported.Footnote13 Exchange rate effect in Ghana is transmitted through fuel prices to transportation costs to the agriculture, service, and manufacturing sectors. This in turn negatively impacts the livelihoods of the average Ghanaian whose income decline. In the case of remittance-dependent households the need for support increases from migrant relations increases. This shows the dire need for structural change towards high value-added sectors to meet global technological change and increase income. Structural transformation backed by complex technologies, research, and development is needed to increase the production, development and refinement of oil products in the manufacturing sector for export. This is hinged on improving human resources to create sustainable employment and skills which will impact the economy positively (Osei et al., Citation2020).
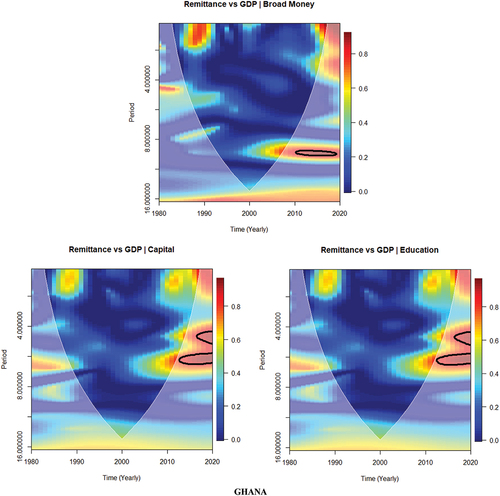
The results obtained for Ghana were further confirmed by the PWC plots for other selected macroeconomic variables as shown by inflation, general government expenditure, money supply (broad money), capital (gross fixed capital formation) and education (school enrollment) which the low interdependence on the relationship between remittance and gdp when moderated by the selected variables.
In the case of South Africa, Figure , comovements between remittance and gdp showed a string of interdependence. It is worth noting that South Africa’s inability to translate the positive factor price movements of the 1970s into the price of gold reduced confidence in the country’s economy in the 1980s. Falls in monetary supply, stock capital investments, high inflation, and exchange rate controls hampered growth when poor governmental policies were implemented, accompanied by a fall in gold prices, which is a major source of revenue for the country. Capital erosion plus population boom drove GDP per capita down, and job availability did not march population growth. Again, a rise in restrictive regulations in the private sector, inefficiency in managing capital in the public sector and financial sanctions impacted growth. South Africa joined the Southern African Development Community (SADC) to stimulate growth in the 1980s, which only compounded the poor growth issue as ill-advised policies from the government were taking a toll on the economy.
Figure 2. The left-hand side of the WC plot shows remittance and GDP. The right-hand side represents the PWC plot between remittance and GDP, removing the effect of exchange rates. The crosshatch reveals regions within the cone of influence (COI). The thick gray curve denotes the 95% confidence degree. Where arrows on the left-hand side reveal the comparative phase connection, a right-pointing arrow represents in-phase, upward pointing arrows suggest the leading of remittance, and pointing directly down implies the leading of GDP.
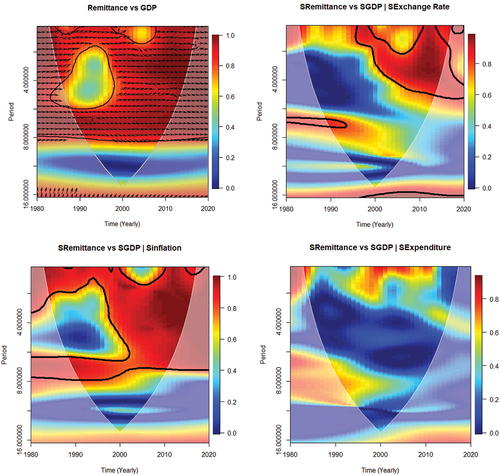
Figure 2. Continued.
Furthermore, capital flight as a percentage of GDP hovered around 5.4 per cent per annum from 1980 − 1993. It, however, rose by an average of 9.2 per cent from 1994 to 2000, impeding the economy by reducing capital for investment. Over the years, human capital (skilled labour) emigration rose among white and black professionals in the engineering, medicine, and I.T. fields, among others. The exodus of black professional migrants in the country, due to growing xenophobic sentiments and low economic opportunities, increased the level of brain drain in the country. As South Africa’s remittance inflow increased, it was often eclipsed by the corresponding outflow. South Africa is considered the most developed country; even so, remittance has grown since 1998 as emigration levels increased. South Africa received an all-time high of USD 1.2 billion in 1998, representing 3 per cent of GDP; as of 2019, according to the World Bank, the total remittance inflow was at USD1.5 billion. Saddled with volatility, economic growth, however, has had to sustain since the 2008 financial crisis leading to a decline in growth rate to about 1.4 per cent, with a low of 0.6 per cent in 2016 (Statistics South Africa, Citation2019). The volatile nature of growth in the country calls for South Africa to harness the benefits of remittances for economic growth.
The South African economy is plagued with an unstable currency; although it adopted a flexible exchange rate regime in 2000, currency volatilities have caused complications for economic growth. The devaluation of the South African Rand had a knock-on effect on consumers in the country, rendering monetary policy intervention unfeasible. The devaluation of the Rand affected small businesses and homeowners by raising debt levels as the Rand weakened against the major currencies. South Africa has since advanced in implementing financial inclusion policies which have led to an increase in savings with a highly developed financial sector. Thus, with a high degree of integration in domestic financial systems, remittance is less likely to stimulate investment for growth.
Nonetheless, the impact of the exchange rate on the remittance economic growth relationship cannot be overlooked as the exchange rate impacts growth. In the biwavelet plot, the arrows are in phase, but it is unclear whether remittance or gdp is leading. The plot highlights the real impact of the exchange rate on the remittance economic growth relationship, among other factors. The moderating effect of the exchange rate is strong on the South African economy even as remittance is channelled through investment ventures due to the high level of integration of the financial market.
The partial wavelet coherence plot in Figure , on the other hand, showed a strong relationship between remittance and gdp, excluding the exchange rate. For regions with warmer colours from 2000 to 2020, we found a strong interdependence as high as 8%. We further found that greater portions of red regions are observed from 2000 onwards, primarily for the intermediate and long-time spheres. Thus, there is a high degree of comovements between the macroeconomic variables reflecting their shared reliance and not just the outcome of their combined comovements. The mediating function of the exchange rate in stimulating comovements between remittance and economic growth leads to a reduction in the proportion of warmer regions as seen through the comparison of bivariate wavelet coherence and corresponding PWC. For South Africa, we found that if the exchange rate is involved, the comovements between remittance and gdp will be significant. However, by excluding the exchange rate, we find that other macroeconomic variables, such as inflation, strongly affect the remittance and economic growth relationship (Olamide et al., Citation2022). South Africa remains one of the highest remittances (receiving and sending) countries on the continent. With its strong financial development and policies, contractionary measures should be implemented to boost a strong currency, control inflation, and correct the balance of payment equilibrium. The introduction of good monetary policies, export-led growth, fiscal reforms, and industrialization will continue to impact the South African economy strongly.
The results obtained for South Africa were further confirmed by the PWC plots for other selected macroeconomic variables as shown from inflation, general government expenditure, money supply (broad money), capital (gross fixed capital formation) and education (school enrollment). We find high interdependence on the relationship between remittance and gdp when moderated by the selected variables except general government expenditure which indicates a low interdependence.
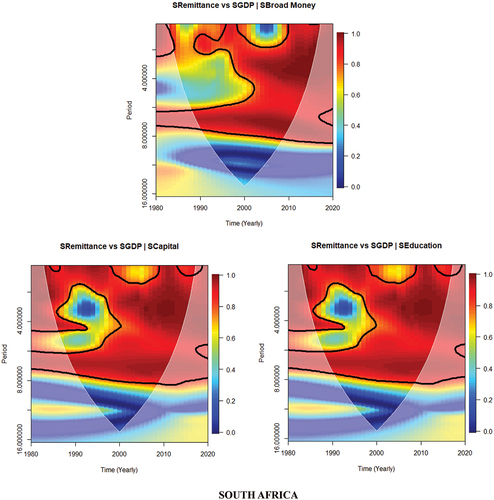
In Figure , Uganda’s comovements between remittance and gdp are primarily concentrated between 0 to 2-year cycles. One small island is noted throughout the period under study, with intense connectedness from 2009 to 2010.With Uganda’s emergence from the war, the economy has grown to the back of recovery programs and macroeconomic and structural reforms. The growth rate rise averaged 7.7 per cent per annum until the financial crisis in 2008, leading to a decline of about 1.4 per cent from 2008 to 2009 in growth rates. The decline in economic growth and limited employment opportunities have spurred the emigration of Ugandans abroad for better work opportunities, leading to a rise in remittances of about 14 per cent (Mohamed, Citation2019). Remittances accounted for 6% of the country’s GDP from 2008 to 2010 (UNCTAD, Citation2012). Remittance continues to grow in relation to tourism as the higher exchange earner for the country exceeding foreign direct investment. The erratic nature of the growth rate in Uganda from 2010 to 2020 is highlighted in the build-up of warmth (interdependence) in the remittance and economic growth relationship. Uganda’s sensitivity to exchange rate volatility and global uncertainty arising from global shocks, balance of payments deficits, and speculation on the currency posed a threat to the economy.Footnote14 The implementation of a flexible exchange rate regime since 1993 is attributed to the positive effects on the economy of Uganda. Thus, Uganda’s economy is insulated from economic shocks in Uganda.
Figure 3. The left-hand side of the WC plot shows the remittance and GDP relationship. Right-hand side shows the PWC plots for remittance and GDP, removing the effect of exchange rates. The crosshatch signifies regions inside the cone of influence (COI). The thick gray curve suggests the 95% confidence point. The right-hand side arrows reveal the comparative phase connection; arrows pointing left suggest antiphase and arrows pointing straight up imply the leading of remittance.
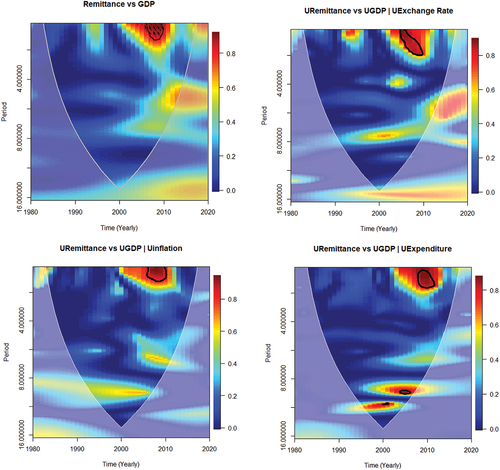
Figure 3. Continued.
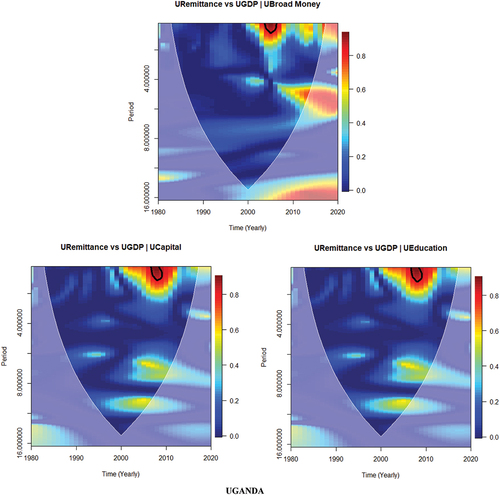
In the case of partial wavelet coherence, plot Figure for Uganda before the year 2000 reveals the dependence relationship between remittance and gdp to be low. From 2005 − 2010, interrelation is about 8% within the cone of influence, excluding the influence of the exchange rate. When we compare the proportion of warm regions between remittance and gdp for bivariate wavelet coherence and corresponding PWC, an increase in the area of dependence indicated a strong level of interdependence within a limited time frame. An increase in the warmer region shows that the influence of the exchange rate is less significant and occurs in shorter cycles as there are other potential influences from different macroeconomic variables, such as inflation.
The results obtained for Uganda were further confirmed by the PWC plots for other selected macroeconomic variables as shown by inflation, general government expenditure, money supply (broad money), capital (gross fixed capital formation) and education (school enrollment). We find high interdependence on the relationship between remittance and gdp when moderated by the selected variables in short cycles (Hoang et al., Citation2020).
From Figure , the comovements between remittance and gdp for Morocco are concentrated within 0-6- year cycles. Two (2) small islands are found on the plot to occur throughout the study period, one with an intense concentration between the 4-6-year cycle (1980–1995) and 0-2-year cycles (1998–2000). Morocco remains one of the main countries of emigration in North Africa, with over 2.8 million people since 2013. Morocco is ranked the second largest recipient of remittance due to the emigration of skilled and unskilled labour, usually towards the European area and the Gulf States, for better opportunities. Remittance inflow has since increased six-fold from USD1.3 to 7.3 billion in 2013. Deepening financial development in Morocco has spurred remittance inflow through formal channels. Implementing the basket peg of the exchange rate has been a strong anchor for the dirham against the euro and has limited the volatility effect of the euro-dirham, leading to a stabilized value in the currency. From the biwavelet coherence plot, appreciation in the euro for which the dirham is pegged saw a high interdependence between remittance and economic growth from 2000 to 2004. Thus, the Moroccan exchange rate policy has ensured a stable and dynamic economy leading to positive export competitiveness (Guechati & Chami, Citation2021). The arrows in the biwavelet coherence plot were found to be in phase, but it is unclear whether remittance or gdp is leading.
Figure 4. The left-hand side of the WC plot shows the remittance and GDP relationship. The right-hand side shows the PWC plots of Remittance and GDP, removing the effect of exchange rates. The crosshatch signifies regions inside the cone of influence (COI). Thick gray curve suggests the 95% confidence point. On the left-hand side arrows reveal the comparative phase connection; arrows pointing right suggest in-phase and arrows pointing straight up implies remittance leads and pointing straight down indicates GDP lead.
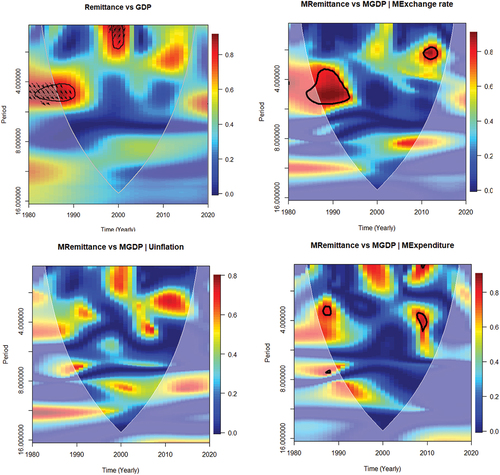
Figure 4. Continued.
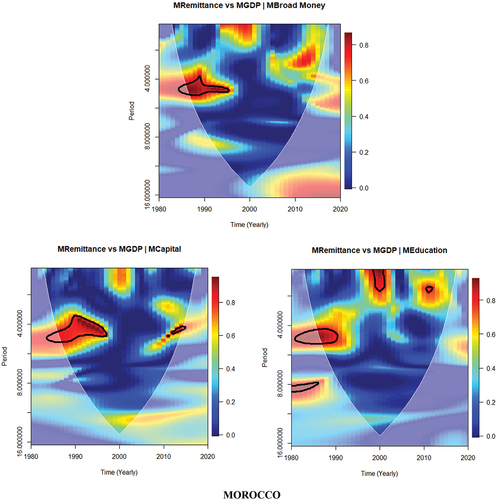
Morocco, in Figure , for the partial wavelet coherence plot highlights that from 1980 to 1995, the interrelations between remittance and gdp, excluding exchange rate, increased. However, in 2010, after the financial crisis of 2008/2009, an island of high interdependence was seen at 8% within the COI. Comparing bivariate wavelet coherence and the corresponding PWC, we find that the warmer regions increased before 2000 within 2–6-year and 0-2-year cycles after the financial crisis 2009/2009. The cycles show the significant impact of the exchange rate effect on the remittance and gdp relationship. We find that other macroeconomic variables could influence the relationship during periods of interdependence, such as spending behaviour in remittance-receiving households. The basket peg system adopted by Morocco has limited the effect of currency appreciation on the national currency when the remittance is converted. Thus, reducing demand volatility to ensure stable economic growth.
The results obtained for Morocco were further confirmed by the PWC plots for other selected macroeconomic variables as shown by inflation, general government expenditure, money supply (broad money), capital (gross fixed capital formation) and education (school enrollment; Hoang et al., Citation2020). We find that high interdependence occurs more frequently and in short cycles when examining the relationship between remittance and gdp when moderated by the selected variables.
6. Policy discussion and conclusions
The paper presents an advanced assessment of the dynamic interrelationship between remittance and economic growth (measured by changes in gdp) with a mediating variable (in our case, the exchange rate) in selected remittance-dependent African economies. As a result, the biwavelet and partial wavelet analysis were employed. The uniqueness of this paper is that it uses wavelet coherence to detect the identified time-varying comovements in the African remittance-economic growth relationship. We presented the lead-lag interactions given a set frequency and use of remittance in their development prospects. Furthermore, the intermediating role of exchange rate inducing comovements between remittances and changes in gdp for remittance-dependent African economies was examined by applying biwavelet and PWC analysis, which evaluated the degree of comovements between remittance and economic growth by controlling for the mutual effect of exchange rate.
Findings reveal that remittance has an impact on economic growth, as is seen in Solow’s extension. We argue that if there is no change in savings and investment rates, there will be no economic impact. However, as is noted in Ghana’s case for biwavelet coherence, we find that when the exchange rate mediates the remittance economic growth relationship, the level of interdependence rises (Feeny et al., Citation2014; Ratha, Citation2013). Alternatively, there is little impact on Ghana’s remittance-economic growth relationship from the exchange rate under the partial wavelet coherence. When exchange rate is excluded, the remittance and economic growth relationship have a limited level of interdependence. However, in the cases of Morocco, Uganda, and South Africa, the remittance-gdp relationship is significant. Exchange rate intermediating role in inducing remittance and changes in gdp is significant. Overall, the results show that for all three African countries except Ghana, exchange rate policies which attach a certain level of importance to stability in their currencies will impact the remittance-economic growth relationship. We find that our study supports the J-curve and the M-L condition by either maintaining export competitiveness, by promoting bilateral trade or depreciating or appreciating the local currency.
For the selected African countries and others characterized by significant migration outflows and high incidence of remittance inflow, the impact on economic growth cannot be overemphasized, with exchange rate policy playing a key role. It must be noted that when the exchange rate mediates the remittance and economic growth relationship, there are two possible outcomes; on the one hand, a change in exchange rate will influence the monetary value of remittances, leading to an income effect, whiles, on the other hand, it can lead to changes in exchange rates resulting in exchange rate effect. The income effect is experienced between the remittance origin and the receiving country as variations in exchange rates are direct. The value of the receiving country’s currency from migrant transfers influences the spending behaviour and decisions of the receiving households. Thus, an appreciation in the sending country’s currency increases its value for the receiving country. Appreciation leads to a rise in spending, impacting economic growth dynamics. However, a volatile exchange rate will lead to an unsteady economic growth dynamic for countries characterized by high levels of emigration.
In the case of the exchange rate effect, there are two possible consequences: direct and indirect effect. The direct effect of the exchange rate effect is related to the impact of remittance on the foreign exchange market when the remittance is converted into the national currency of the receiving country. In small and open economies, remittances serve as sources of foreign exchange as their conversion leads to an appreciation of the nominal exchange rate. However, in the case of indirect effect, the impact from the conversion of remittances is channelled through income. As spendable income rises, aggregate demand increases, leading to a rise in prices and exchange rates. For small open developing economies, when relative prices change in favour of non-tradable goods, reallocation of production occurs. However, the impact on tradeable goods is more susceptible to international competition and exports, which leads to the Dutch Disease phenomenon.Footnote15
An inflow of remittances in foreign currency to countries with high emigration and conversion of remittances to local currency could lead to exchange rate appreciation, which will adversely impact competitiveness in local production, discourage exports and improve imports. However, when such countries are already beset with high inflation and unemployment rates, economic growth declines in response (Marzovilla & Mele, Citation2015).
Our findings highlight the importance of economic management strategies aimed at optimizing growth. Specifically, the results imply that remittance inflows significantly support economic growth by controlling exchange risks. We account for the mediating effect of exchange rates by stimulating comovements between remittance inflow and economic growth. The results indicate that depending on the exchange rate system adopted by a country, either of the above effects may occur, which in turn affects the exchange rate stability. For Uganda, the flexible exchange rate system is efficient; for Morocco, we find the basket peg efficient (Guechati & Chami, Citation2021). However, for Ghana and South Africa, there is a need to review the exchange rate policies to prevent negative effects from real effective exchange rate depreciation and appreciation to ensure stable economic growth, respectively (Alper, Citation2017; Assoumou-Ella, Citation2019; Barguellil et al., Citation2018).
Finally, implementing exchange rate mechanisms central to parity, which are essential in rendering the exchange rate movement effects on remittance and economic growth, mitigates the potential risk of unfavorable spillover shocks to the economy.
Future research should be extended to analyze a wider set of macroeconomic variables for emerging and frontier market economies to determine the degree to which macroeconomic variables induce a remittance-economic growth relationship collectively.
Acknowledgements
I acknowledge University of Energy and Natural Resources, Sunyani Ghana, for their support throughout this study.
Disclosure statement
No potential conflict of interest was reported by the author(s).
Additional information
Funding
Notes on contributors

Gyasi Genevieve
I am a Lecturer/Researcher at the University of Energy and Natural Resources (UENR) in Ghana and a PhD candidate at Kwame Nkrumah University of Science and Technology, Kumasi Ghana. I worked as a graduate research fellow at the United Nations Economic Commission for Africa in Rabat, Morocco, North Africa working in the Economics and Social Affairs department from 2019 to 2021. The research fellowship covered topics in macroeconomics, trade, labour, migration and social affairs. My current research interest covers, macroeconomics topics in Developmental and Financial Economics in Africa. This paper which is part of a series of research projects seeks to address issues that affect the African continent in recent years.
Notes
1. R. R. Kumar (Citation2010)
2. See, Solow (Citation1956).
3. See, Ramsey (Citation1928); Cass (1965); and Koopmans (Citation1963).
4. See, Aftab and Bahmani-Oskooee (Citation2018); and Dogru et al. (Citation2019).
5. See, Eggoh et al. (Citation2019), Olayungbo and Quadri (Citation2019), and Abduvaliev and Bustillo (Citation2019); Kumar, B. (Citation2019), Comes et al. (Citation2018).
6. See, Table for selected variables, measurement and explanation.
7. See, Ramsey (Citation1996)
8. Baek and Brock (Citation1992)
9. See, Yang et al. (Citation2017).
10. See, Owusu Junior, Adam, and Tweneboah (Citation2017, Junior et al., Citation2019).
11. See, Torrence and Compo (Citation1998).
12. Hiemstra and Jones (Citation1994).
13. Aryeetey and Baah-Boateng (Citation2015).
14. Bank of Uganda (2011)
15. see Acosta, Lartey, Mandelman (Citation2009).
References
- Abdulrazak, A. (2021). Effect of remittances on the economic growth of Uganda (Doctoral dissertation, Makerere University). http://dissertations.mak.ac.ug/handle/20.500.12281/8663
- Abduvaliev, M., & Bustillo, R. (2019). Impact of remittances on economic growth and poverty reduction amongst CIS countries. Post-Communist Economies, 32(4),525–31. https://doi.org/10.1080/14631377.2019.1678094
- Acosta, P. A., Lartey, E. K. K., & Mandelman, F. (2009). Remittances and the Dutch Disease. SSRN Electronic Journal. https://doi.org/10.2139/ssrn.985907
- Aloui, C., Hkiri, B., Hammoudeh, S., & Shahbaz, M. (2018). A multiple and partial wavelet analysis of the oil price, inflation, exchange rate, and economic growth nexus in Saudi Arabia. Emerging Markets Finance and Trade, 54(4), 935–956. https://doi.org/10.1080/1540496X.2017.1423469
- Alper, A. E. (2017). Exchange rate volatility and trade flows. Fiscaoeconomia, 1(3), 14–39. https://doi.org/10.25295/fsecon.307331
- Arizala, F., Bellon, M., MacDonald, M., Mlachila, M., & Yenice, M. (2018). Regional spillovers in sub-saharan Africa: exploring different channels. IMF spillover notes no. 18/01. International Monetary Fund, 1–44. https://doi.org/10.5089/9781484367148.062
- Aryeetey, E., & Baah-Boateng, W. (2015). Understanding Ghana’s growth success story and job creation challenges. WIDER Working Paper. https://doi.org/10.35188/unu-wider/2015/ 029.
- Assoumou-Ella, G. (2019). Forecasting CEMAC’s foreign exchange reserves in presence of unanticipated changes in oil prices: An interrupted time series modelling. Journal of Central Banking Theory and Practice, 8(2), 65–83. https://doi.org/10.2478/jcbtp-2019-0014
- Baah-Boateng, W., & Twum, E. K., (2020), Pathways to the structural transformation of the Ghanaian economy-and some roadblocks. https://www.brookings.edu/blog/africa-in-focus/2020/09/03/pathways-to-structural-transformation-of-the-ghanaian-economy-and-some-roadblocks/
- Baek, E. G., & Brock, W. A. (1992). A nonparametric test for Independence of a multivariate time series. Statistica Sinica, 137–156. https://www.jstor.org/stable/24304123
- Bahmani-Oskooee, M., & Aftab, M. (2018). Asymmetric effects of exchange rate changes on the Malaysia-China commodity trade. Economic Systems, 42(3), 470–486.
- Barguellil, A., Ben-Salha, O., & Zmami, M. (2018). Exchange rate volatility and economic growth. Journal of Economic Integration, 33(2), 1302–1336. https://doi.org/10.11130/jei.2018.33.2.1302
- Bashir, S. (2020). Exploring the Linkages between remittances, economic growth and poverty: Empirical evidence from Pakistan. The Economics and Finance Letters, 7(2), 268–275. https://doi.org/10.18488/journal.29.2020.72.268.275
- Bekiros, S., & Diks, C. (2008a). The relationship between crude oil spot and futures prices: Cointegration, linear and nonlinear causality. Energy Economics, 30(5), 2673–2685. https://doi.org/10.1016/j.eneco.2008.03.006
- Bloomberg, (2022). Ghana’s Cedi Slumps to World’s Worst Performer Amid IMF Talks. https://www.bloomberg.com/news/articles/2022-10-17/ghana-currency-slumps-to-world-s-worst-performer-versus-dollar?leadSource=uverify%20wall.
- Boyd, D., Caporale, G. M., & Smith, R. (2001). Real exchange rate effects on the trade balance: Cointegration and the Marshall-Lerner condition. International Journal of Finance & Economics, 6(3), 187–200. https://doi.org/10.1002/ijfe.157
- Bucevska, V. (2022). Impact of remittances on economic growth: empirical evidence from south-east European countries. South-East European Journal of Economics and Business, 17(1), 79–94. https://doi.org/10.2478/jeb-2022-0006
- Chaudhary, S. K. (2022). Remittances economic growth and investment nexus: Evidence from Nepal. NRB Economic Review, 34(1), 1–23. https://doi.org/10.3126/nrber.v34i1.47991
- Comes, C. A., Bunduchi, E., Vasile, V., & Stefan, D. (2018). The impact of foreign direct investments and remittances on economic growth: A case study in Central and Eastern Europe. Sustainability, 10(1), 1–238. https://doi.org/10.3390/su10010238
- Diks, C., & Panchenko, V. (2005). A note on the Hiemstra-jones test for granger non-causality. Studies in Nonlinear Dynamics & Econometrics, 9(2), 1–7. art 4. https://doi.org/10.2202/1558-3708.1234
- Diks, C., & Panchenko, V. (2006). A new statistic and practical guidelines for nonparametric Granger causality testing. Journal of Economic Dynamics and Control, 30(9–10), 1647–1669. https://doi.org/10.1016/j.jedc.2005.08.008
- Dogru, T., Cem, I., & Ercan, S.-T. (2019). The balance of trade and exchange rates: Theory and contemporary evidence from tourism. Tourism Management, 74, 12–23. https://doi.org/10.1016/j.econmod.2012.02.014
- Dong, F. (2017). Testing the Marshall-Lerner condition between the U.S. and other G7 member countries. The North American Journal of Economics and Finance, 40, 30–40. https://doi.org/10.1016/j.najef.2017.01.003
- Dutta, U. P., & Partha, P. S. (2018). Remittances and real effective exchange rate: An empirical exercise with Indian Data. South Asia Economic Journal, 19(1), 124–136. https://doi.org/10.1177/1391561418761077
- Eggoh, J., Bangake, C., & Semedo, G. (2019). Do remittances spur economic growth? Evidence from developing countries. The Journal of International Trade & Economic Development, 28(4), 391–418. https://doi.org/10.1080/09638199.2019.1568522
- Ekanayake, E. M., & Moslares, C. (2020). Do remittances promote economic growth and reduce poverty? evidence from Latin American Countries. Economies, 8(2), 35. https://doi.org/10.3390/economies8020035
- Ellahi, S., & Omer, M. (2020). Do workers’ remittances promote economic growth? A case study of Pakistan. Journal of Islamic Monetary Economics and Finance, 6(4), 4. https://doi.org/10.21098/jimf.v6i4.1187
- Feeny, S., Iamsiraroj, S., & McGillivray, M. (2014). Remittances and economic growth: Larger impacts in smaller countries. The Journal of Development Studies, 50(8), 1055–1066. https://doi.org/10.1080/00220388.2014.895815
- Gheasi, M., & Nijkamp, P. (2017). A brief overview of international migration motives and impacts, with specific reference to FDI. Economies, 5(3), 31. https://doi.org/10.3390/economies5030031
- Granger, C. W. (1969). Investigating causal relations by econometric models and cross-spectral methods. Econometrica: Journal of the Econometric Society, 37(3), 424–438. https://doi.org/10.2307/1912791
- Guechati, I., & Chami, M. (2021). Impact of the exchange rate on economic growth in Morocco. French Review of Economics and Management, 2, 10. https://doi.org/10.5281/zenodo.5570913
- Hiemstra, C., & Jones, J. D. (1994). Testing for linear and nonlinear Granger causality in the stock price‐volume relation. The Journal of Finance, 49(5), 1639–1664. https://doi.org/10.1111/j.1540-6261.1994.tb04776.x
- Hien, N. P., Vinh, C. T. H., Mai, V. T. P., & Kim Xuyen, L. T. (2020). Remittances, real exchange rate and the Dutch disease in Asian developing countries. The Quarterly Review of Economics and Finance, 77, 131–143. https://doi.org/10.1016/j.qref.2019.10.006
- Hoang, T. T., Thi, V. A. N., & Minh, H. D. (2020). The impact of exchange rate on inflation and economic growth in Vietnam. Management Science Letters, 1051–1060. https://doi.org/10.5267/j.msl.2019.11.004
- Hosny, A. (2020). Remittance concentration and volatility: Evidence from 72 developing countries. International Economic Journal, 34(4), 553–570. https://doi.org/10.1080/10168737.2020.1824008
- Hu, Y., & Oxley, L. (2017). Are there bubbles in exchange rates? Some new evidence from G10 and emerging market economies. Economic Modelling, 64, 419–442. https://doi.org/10.1016/j.econmod.2017.02.022
- Ivanovski, K., Churchill, S. A., & Nuhu, A. S. (2020). Modelling the Australian J-Curve: An ARDL Cointegration Approach. Economic Papers: A Journal of Applied Economics and Policy, 39(2), 167–184. https://doi.org/10.1111/1759-3441.12277
- Jena, N. R., & Sethi, N. (2019). Interaction of real effective exchange rate with economic growth via openness of the economy: Empirical evidence from India. Journal of Public Affairs Portico, 20(2). https://doi.org/10.1002/pa.2042
- Junior, P. O., Tweneboah, G., & Adam, A. M. (2019). Interdependence of major exchange rates in Ghana: A wavelet coherence analysis. Journal of African Business, 20(3), 407–430. https://doi.org/10.1080/15228916.2019.1583973
- Khan, M. F. H. (2021). Impact of Exchange Rate on Economic Growth of Bangladesh. European Journal of Business and Management Research, 6(3), 173–175. https://doi.org/10.24018/ejbmr.2021.6.3.891
- Kijewski, T., & Kareem, A. (2003). Wavelet transforms for system identification in civil engineering. Computer-Aided Civil and Infrastructure Engineering, 18(5), 339–355. https://doi.org/10.1111/1467-8667.t01-1-00312
- Koopmans, T. (1963). On the Concept of Optimal Economic Growth. In Cowles Foundation for Research in Economics. Yale University. https://econpapers.repec.org/scripts/redir.pf?u=https%3A%2F%2Fcowles.yale.edu%2Fsites%2Fdefault%2Ffiles%2Ffiles%2Fpub%2Fd00%2Fd0081.pdf;h=repec:cwl:cwldpp:81
- Kumar, R. R. (2010). Does remittances matter for economic growth of the Philippines? An investigation using bounds test analysis. An Investigation Using Bounds Test Analysis (February, 25, 2010. https://dx.doi.org/10.2139/ssrn.1565903
- Kumar, B. (2019). The impact of international remittances on education and health in Bangladesh. International Journal of Science and Qualitative Analysis, 5(1), 6. https://doi.org/10.11648/j.ijsqa.20190501.12
- Kumar, B. (2021). Construction of household welfare index and welfare impact of international remittances in rural Bangladesh. https://doi.org/10.20944/preprints202105.0551.v1
- Kumar, B., Ali, S. R., & Kibria, M. G. (2021). International remittances, household welfare, and women empowerment. Advances in Religious and Cultural Studies, 174–190. https://doi.org/10.4018/978-1-7998-3737-4.ch012
- Lawal, A. I., Ilhan, O., Ifedolapo, O. O., & Abiola, J. A. (2020). Examining the linkages between electricity consumption and economic growth in African economies. Energy, 208, 118–363. https://doi.org/10.1016/j.energy.2020.118363
- Lin, W. C., & Tsai, C. F. (2020). Missing value imputation: a review and analysis of the literature (2006–2017). Artificial Intelligence Review, 53(2), 1487–1509. https://doi.org/10.1007/s10462-019-09709-4
- Marshall, A. (1923). Money, credit & commerce. Macmillan.
- Marzovilla, O., & Mele, M. (2015). Remittances, economic growth, exchange rate regime: The case of Morocco. European Journal of Economics, Finance and Administrative Sciences, (71), 106–123. https://www.researchgate.net/publication/272510641
- Maslii, N., Demianchuk, M., Britchenko, I., & Bezpartochnyi, M. (2022). Modelling migration changing according to alternative scenarios in the context of the global COVID-19 pandemic: The example of Ukraine. Economic Studies (Ikonomicheski Izsledvania), 31(1), 58–71. https://ssrn.com/abstract=4023443
- McFarlane, A., Brown, L., & Das, A. (2022). Real exchange rates and remittance inflows in Jamaica. The Journal of International Trade & Economic Development, 1-19. https://doi.org/10.1080/09638199.2022.2072938
- Meyer, D., & Shera, A. (2017). The impact of remittances on economic growth: An econometric model. EconomiA, 18(2), 147–155. https://doi.org/10.1016/j.econ.2016.06.001
- Mohamed, A. O. (2019). Remittances and economic growth in Uganda (1993-2017). Doctoral dissertation, Kampala International University.
- Ng, E. K. W., & Chan, J. C. L. (2012). Interannual variations of tropical cyclone activity over the north Indian Ocean. International Journal of Climatology, 32(6), 819–830. https://doi.org/10.1002/joc.2304
- Nguyen, P. H. (2017). Remittances and competitiveness: A case study of Vietnam. Journal of Economics, Business and Management, 5(2), 79–83. https://doi.org/10.18178/joebm.2017.5.2.490
- Nimoh, S. A., & Addai-Asante, J. (2018). Exchange rate policy and GDP growth in Ghana. American Academic Scientific Research Journal for Engineering, Technology, and Sciences, 42(1), 265–283. https://www.asrjetsjournal.org/index.php/American_Scientific_Journal/article/view/3968
- Nxumalo, M., & Raju, D. (2020). Structural transformation and labor market performance in Ghana. https://doi.org/10.1596/34849
- Olamide, E., Ogujiuba, K., & Maredza, A. (2022). Exchange rate volatility, inflation and economic growth in developing countries: panel data approach for SADC. Economies, 10(3), 67. https://doi.org/10.3390/economies10030067
- Olayungbo, D. O., & Quadri, A. (2019). Remittances, financial development and economic growth in sub-Saharan African countries: Evidence from a PMG-ARDL approach. Financial Innovation, 5(1), 1. https://doi.org/10.1186/s40854-019-0122-8
- Osei, R. D., Atta-Ankomah, R., & Lambon-Quayefio, M. (2020). Structural transformation and inclusive growth in Ghana (No. 2020/37). WIDER Working Paper. The United Nations University World Institute for Development Economics Research (UNU-WIDER), Helsinki. https://doi.org/10.35188/UNU-WIDER/2020/794-1
- Osei, R. D., & Jedwab, R. (2016). Structural change in a poor African country: New historical evidence from Ghana. Margaret McMillan, Dani Rodrick, and Claudia Sepúlveda,eds https://doi.org/10.2499/9780896292147_ch4
- Oteng-Abayie, E., Awuni, P. A., & Adjei, T. K. (2020). The Impact of Inward Remittances on Economic Growth in Ghana. African Journal of Economic Review, 8(2050-2021-187), 49–65. http://dx.doi.org/10.22004/ag.econ.308775
- Owusu, J. P., Adam, A. M., & Tweneboah, G. (2017). Co-movement of real exchange rates in the West African Monetary Zone. Cogent Economics & Finance, 5(1),135–1807. https://doi.org/10.1080/23322039.2017.1351807
- Owusu Junior, P., Adam, A. M., & Tweneboah, G. (2017). Co-movement of real exchange rates in the West African Monetary Zone. Cogent Economics & Finance, 5(1), 1351807. https://doi.org/10.1080/23322039.2017.1351807
- Ramsey, F. P. (1928). A Mathematical Theory of Saving. The Economic Journal, 38(152), 543. https://doi.org/10.2307/2224098
- Ramsey, J. B. (1996). If nonlinear models cannot forecast. What Use are They? Studies in Nonlinear Dynamics & Econometrics, 1(2), 65–86. https://doi.org/10.2202/1558-3708.1013
- Rapetti, M. (2020). The real exchange rate and economic growth: A survey. Journal of Globalization and Development, 11(2), 2. https://doi.org/10.1515/jgd-2019-0024
- Ratha, D. (2013). The impact of remittances on economic growth and poverty reduction. Policy Brief, 8(1), 1–13. https://doi.org/10.1080/14631377.2019.1678094
- Research Institute (IFPRI), I. F. P. (2017). Structural change in a poor African country: New historical evidence from Ghana. https://doi.org/10.2499/9780896292147_ch4
- Safadar, N. (2022). The interrelationship between remittances and economic growth: Evidence from SAARC countries. Pakistan Social Sciences Review, 6(II). https://doi.org/10.35484/pssr.2022(6-ii)01
- Salisu, A. A., Vo, X. V., & Lawal, A. (2020). Hedging oil price risk with gold during COVID-19 pandemic. Resources Policy, 70, 101–897. https://doi.org/10.1016/j.resourpol.2020.101897
- Senadza, B., & Diaba, D. D. (2018). Effect of exchange rate volatility on trade in Sub-Saharan Africa☆. Journal of African Trade, 4(1–2), 20. https://doi.org/10.1016/j.joat.2017.12.002
- Sims, C. (1980). Comparison of Interwar and Postwar Business Cycles: Monetarism Reconsidered. https://doi.org/10.3386/w0430.
- Solow, R. M. (1956). A Contribution to the Theory of Economic Growth. The Quarterly Journal of Economics, 70(1), 65. https://doi.org/10.2307/1884513
- Statistics South Africa. (2019). Quarterly labour force survey-QLFS Q4:2018. http://www.statssa.gov.za/?page_id=6283
- Torrence, C., & Compo, G. P. (1998). A practical guide to wavelet analysis. Bulletin of the American Meteorological Society, 79(1), 61–78. https://doi.org/10.1175/1520-0477(1998)079<0061:APGTWA>2.0.CO;2
- Torrence, C., & Webster, P. J. (1999). Interdecadal changes in the ENSO-Monsoon system. Journal of Climate, 12(8), 2679–2690. https://doi.org/10.1175/1520-0442(1999)0122679:ICITEM2.0.CO;2
- UNCTAD. (2012). Maximizing the Development Impact of Remittances.
- World Bank. 2022. A War in Pandemic:Implications of the Ukraine Crisis and COVID-19 on global governance of migration and remittance. Migration and Development Policy Brief, 36. https://www.knomad.org/publication/migration-and-development-brief-36
- Wu, K., Zhu, J., Xu, M., & Yang, L. (2020). Can crude oil drive the comovement in the international stock market? Evidence from partial wavelet coherence analysis. The North American Journal of Economics and Finance, 53, 101–194. https://doi.org/10.1016/j.najef2020.101194
- Yang, L., Cai, X. J., & Hamori, S. (2017). Does the crude oil price influence the exchange rates of oil-importing and oil-exporting countries differently? A wavelet coherence analysis. International Review of Economics & Finance, 49, 536–547. https://doi.org/10.1016/j.iref.2017.03.015
Appendix A
Table A1. Linear granger causality test results
Table A2.
Nonlinear Granger causality estimated results
Table A3.
Selected variables