
 ?Mathematical formulae have been encoded as MathML and are displayed in this HTML version using MathJax in order to improve their display. Uncheck the box to turn MathJax off. This feature requires Javascript. Click on a formula to zoom.
Abstract
This study examined the impact of rural out-migration on the poverty of migrant-sending households by applying the new economics labor migration theory as a theoretical framework, and the multinomial endogenous switching regression as an analytical model in southern Ethiopia. Data were gathered from 415 sample rural households using stratified random sampling in the year 2021. The cost of basic needs approach and the Foster, Greer, and Thorbecke (FGT) method were used to establish the poverty line and create the poverty indices, respectively. The average annual food and non-food poverty lines are Birr 8997.52 and 2249.38 per adult equivalent. The incidence, depth, and severity of general poverty are 39.76, 10.11, and 3.55%, respectively, while the incidence, depth, and severity of food poverty are 34.70, 9.47, and 3.58%, respectively. When compared to other households, households with international migrants have a lower incidence, depth, and severity of poverty. The regression result of the multinomial endogenous switching model showed that international migration increases consumption per adult equivalent of households by 29.8% and is significant at the 1% level. Participation in rural-urban and international migration increases kilocalories per adult equivalent per day by 7.4 and 36.4%, respectively, in migrant-sending rural households. The findings support the new economics labor migration theory’s remittance hypothesis. Promoting access to land, capital, farm and non-farm employment, irrigation, family planning, and basic public services would improve rural household welfare and reduce the current wave of rural out-migration in Southern Ethiopia.
PUBLIC INTEREST STATEMENT
Rural out-migration has become one of the development issues in developing economies, and most migrants move from the rural agricultural sector to urban non-agricultural sectors. The gravity theory of migration (Ravenstein, Citation1885), the two-sector labor migration theory (Lewis, Citation1954), the push and pull factors migration theory (Lee, Citation1966), and the human capital theory of migration (Harris & Todaro, Citation1970) focus more on the causes, and impact of migration on migrant-receiving urban areas, while the new economics labor migration theory (Stark, Citation1985) focuses on the causes and impacts of migration on welfare and production of migrant-sending origin areas. Besides, the new economics labor migration theory has shifted the unit of analysis from individual to household level in migration analysis. The migration does not occur in a vacuum, it gives with one hand and takes with the other hand. This means migration affects the migrant-sending areas via two channels: the remittance channel and the lost labor channel. This study, therefore, aimed to evaluate the impact of rural out-migration on the poverty of migrant-sending households in southern Ethiopia by applying the new economics labor migration theory as a theoretical framework and the multinomial endogenous switching regression as an analytical model.
1. Introduction
In the 21st century, rural out-migration has become one of the development issues in developing economies (FAO (Food and Agriculture Organization), Citation2020). Most migrants move from the rural agricultural sector to urban non-agricultural sectors or from poor to rich countries (FAO (Food and Agriculture Organization), Citation2019). While the number of international migrants in the world increased from 173 to 281 million people, the percentage of international migrants from the total world population increased from 2.8 to 3.6% (UNDESA (United Nations Department of Economic and Social Affairs), Citation2020) between 2000 and 2020. Remittances from international migrants increased from 128 billion to 751 billion US dollars in the world (UNCTAD (United Nations Conference on Trade and Development), Citation2020) between 2000 and 2020. The same source indicated that the percentage of international remittances directed to developing countries increased from 57 to 79% between the period 2000 and 2020. Besides, the number of internal migrants reached 1.3 billion in developing countries in 2016 (FAO (Food and Agriculture Organization), Citation2019). Despite the continuous flow of labor from the agricultural sector to urban non-agricultural sectors, the impact of rural out-migration on the welfare of households is a source of debate (UN (United Nations), Citation2016).
With an estimated population size of 115 million in 2020, Ethiopia is the second-most populous country in Africa, and the 12th most populated in the world (World Bank, Citation2021). Ethiopians are the most mobile population in East Africa, with tens of thousands of youths leaving the country each year for the Middle East, European countries, and South Africa (Adugna, Citation2019). Migration has different patterns in Ethiopia under different political regimes. First, during the emperor’s regime (1941–1974), both rural-urban and international migration were insignificant in Ethiopia (Lyons & Kass-Hanna, Citation2021), and only an estimated 20,000 people out-migrated to western countries primarily to get an education (Terrazas, Citation2007). Second, during the military government (1974–1991), international migration increased mainly due to political repression, civil war, and the mid-1980s famine in Ethiopia. But rural–urban migration was limited due to the restrictions on rural out-migration through forced villagization and preventing livelihood diversification (FDRE (Federal Democratic Republic of Ethiopia), Citation2005). Third, during the current government (1991 onwards), both rural–urban and international migration have been mounting in Ethiopia. While the percentage of rural–rural migrants decreased from 35.6 to 23.4, the percentage of rural–urban migrants increased from 21.6 to 32.2 between 1999 and 2021, respectively (CSA (Central Statistical Agency), Citation2021). The same source showed that the Amhara and SNNP regions are the primary origins of internal migrants in Ethiopia (CSA (Central Statistical Agency), Citation2021). Regarding international migration, while the stock of international migrants increased from 611,000 to 1.1 million people in the period 2000 to 2020, the inflow of remittances increased from 53 to 404 million US dollars during the same period (World Bank, Citation2021). The 2021 Ethiopian Labor and Migration Survey showed that more than 839,224 Ethiopian migrants are living abroad, and male and female migrants contributed 54 and 46%, respectively. About 42, 26.9, and 25.6% of Ethiopian emigrants originated from rural areas of Oromia, Amhara, and SNNP regions, respectively (CSA (Central Statistical Agency), Citation2021).
Regarding the destination of international migrants, 30.7, 12.4, 8.9, and 8.3% of migrants from Ethiopia were directed to Saudi Arabia, South Africa, the United Arab Emirates, and the United States, respectively (CSA (Central Statistical Agency), Citation2021). Generally, international migrants from Ethiopia use three major migration corridors. First, the eastern corridor is the busiest route of migration, and Ethiopians migrate to the Middle East following this route since the 1990s. Female migrants make near 95% of all formal migrants from Ethiopia to the Middle East (MoLSA (Ministry of Labor and Social Affairs), Citation2018). Second, Ethiopian migrants use the northern migration corridor only in rare cases to transit through Sudan to Libya and Europe (Massey et al., Citation1998). Third, the southern migration corridor runs from the Horn of Africa to South Africa. While Ethiopia and Somalia are the major sources of migrants to South Africa, Ethiopia alone accounts for two-thirds of the migrants from the Horn of Africa (Horwood, Citation2009). The Ministry of Foreign Affairs in Ethiopia indicated that about 120,000 Ethiopians work and live in South Africa (Zewdu, Citation2018).
While Ethiopia is a multi-ethnic country with more than 80 ethnic groups, Hadiya and Kembata from southern Ethiopia largely migrate to South Africa (Degelo, Citation2015; Zewdu, Citation2018). The migration from Hadiya and Kembata-Tembaro zones to South Africa started in 2000, when a former Ethiopian ambassador to South Africa created job opportunities for some youth from his birthplace (Kanko et al., Citation2013). Though migration from these two zones to South Africa started in recent years, the level of outflow is very high, and some districts, namely, Soro, Lemo, Gombora, Angacha, and Doyo-gena are the main sources of migrants (Kanko et al., Citation2013). More than 39.4% of rural households have at least one international migrant (Gemecho & Goshu, Citation2017) in Hadiya and Kembata-Tembaro zones. While some studies conducted on the impact of rural–urban migration on poverty of migrant-sending households, studies on the impact of both rural-urban and international migration on poverty of migrant-sending households by employing the new economics labor migration theory as a theoretical framework, and the multinomial endogenous switching regression as an analytical model are scarce. Therefore, this study examined the impact of rural out-migration on the welfare of migrant-sending households in the Hadiya & Kembata-Tembato zones in Southern Ethiopia.
2. Literature review
2.1. Theoretical review
There are various migration theories, namely, the gravity theory of migration (Ravenstein, Citation1885), the two-sector labor migration theory (Lewis, Citation1954), the push and pull factors migration theory (Lee, Citation1966), the human capital theory of migration (Harris & Todaro, Citation1970), the new economics labor migration theory (Stark, Citation1985), and the network theory of migration (Taylor & Wyatt, Citation1999) which explain the sources of migration and impact of migration on migrants, migrant-receiving urban and migrant-sending rural areas. The gravity theory of migration predicts that people move from areas of low opportunities to areas of high opportunity, and the volume of rural out-migration is determined by the physical distance between migrant-sending and receiving areas. The two-sector migration theory (Lewis, Citation1954) assumes that economic development involves the unlimited transfer of labor from the rural agricultural sector to the urban non-agricultural sectors.
The push and pull factors theory of migration (Lee, Citation1966) additionally divides the causes of rural out-migration into four categories: push factors, pull factors, personal factors, and intervening factors. Rural out-migration is primarily pushed by issues with access to land, non-farm employment, education, and basic public services. Additionally, rural households are still encouraged to migrate by the occurrence of drought, crop failure, large family sizes, and the presence of returning migrants in the village. However, the human capital theory of migration (Harris & Todaro, Citation1970) claims that the economic distance between migrant-receiving and migrant-sending areas is what drives rural–urban migration. Additionally, the Harris-Todaro migration theory insists that the choice to emigrate is made on a personal level and primarily focuses on the reasons behind migration and how it affects migrant-receiving urban areas (Todaro, Citation1969). However, the new economics labor migration theory (Stark, Citation1985) asserts that the choice to immigrate is made at the household level in order to maximize the welfare of the households. There are four reasons why migrants remit money back home: altruism, insurance contracts, loan contracts, investments, and inheritance (Stark, Citation1985,).
The causes of rural out-migration and its effects on migrant-sending origin areas are the main topics of the new economics labor migration theory. On the one hand, the lack of capital and insurance markets in rural areas is one of the main causes of rural out-migration, according to the new economics labor migration theory. A rural family can create a new financial intermediary in the form of migrants by placing a family member in the migrant labor market (Stark, Citation1985). The new economics labor migration theory, however, contends that rural out-migration has an impact on the migrant-sending origin regions through both the lost labor channel and the remittance channel. The welfare of migrant-sending households in the host communities is anticipated to increase as a result of the remittance channel. However, the lost labor channel may have a negative impact on the welfare of households that send migrants by lowering human capital and agricultural output in the areas of origin. As a result, migration does not take place in a vacuum; rather, it involves giving and taking. The new economics labor migration theory states that the relative strength of the remittance effect and the lost labor effect determine how migration affects rural areas that send migrants. Last but not least, the network migration theory (Taylor & Wyatt, Citation1999) connects the social network to the causes of rural out-migration. According to the network theory of migration, connections between migrants, return migrants, and non-migrants encourage rural outmigration in developing nations. However, in order to measure the effect of participation in rural out-migration on rural poverty, this study used the new economics labor migration theory as a theoretical framework.
2.2. Empirical review
In some earlier studies (Ajefu & Ogebe, Citation2021; Ebadi et al., Citation2018; Moniruzzaman, Citation2020; Mora-Rivera & van Gameren, Citation2021; Nuñez & Osorio-Caballero, Citation2021; Stampini & Robles, Citation2021) participation in migration was found to have a positive and significant impact on the welfare of migrant-sending households. In five African nations, Ajefu and Ogebe (Citation2021) used secondary data and instrumental variable quantile regression to study the effects of international migration. The findings indicated that international migration raises spending on food, durable goods, education, and health. However, the study does not take into account biases in self-selection brought on by factors or traits that were not observed. Similarly, using secondary data and OLS, Nuñez and Osorio-Caballero (Citation2021) investigated how migration affected poverty in Mexico and Central America. The study discovered that for every 10% increase in migration, there is an 8.6% decrease in the prevalence of poverty in the areas where migrants are sending their children. Using primary data from 60 countries, 68,463 sample households, and a logistic regression model, Ebadi et al. (Citation2018) also investigated the relationship between migration and food security. The study discovered a beneficial and significant correlation between migration and the consumption of households that send migrants. However, the potential endogeneity between household consumption and migration is not taken into account in this study.
Moreover, using cross-sectional data and the two-stage least square instrumental variable method in Bangladesh, Moniruzzaman (Citation2020) conducted a study on the effect of remittance on household food security. Remittances, according to the findings, help rural households’ food security. Using secondary data and instrumental variable (IV) estimation techniques, Stampini and Robles (Citation2021) investigated the effects of international migration on household welfare in Venezuela. The study discovered that participation in international migration increases the number of kilocalories consumed by households per person. Furthermore, a study conducted by Mora-Rivera and van Gameren (Citation2021) on the impact of migration on food insecurity in Mexico using secondary data and ordered logistic regression discovered that internal remittance is insufficient to provide food security to remittance-receiving households.
Further, in a study conducted by Seetha (Citation2012) on the impact of migration on the income of migrant-sending households in Sri Lanka using primary data from 377 respondents, Tobit and Probit model found that rural out-migration is a positive contributor to household income. Still, Odekon (Citation2015) assessed the impact of rural out-migration on poverty in Nigeria using secondary data from 223 households and logistic regression and found that remittance from migration significantly reduces rural poverty. Yet, Abdi (Citation2021) conducted a study on the effect of remittance on poverty using secondary data and propensity score matching in Somalia and found that the consumption of remittance-receiving households is higher compared to households without remittance. In the same vein, Yoshino et al. (Citation2019) examined the effect of remittance on the poverty of households using secondary data and OLS in ten Asian countries, and the result showed that remittance significantly reduces the incidence of poverty. In Nepal, a study conducted by Thapa and Acharya (Citation2017) on the effect of remittance on the expenditure of households using secondary data and the propensity score matching found that remittance-receiving households spent more on food, education, and health compared to remittance non-receiving households.
Similarly, Raihan et al. (Citation2021) examined the impact of migration on the expenditure of households using secondary data, and propensity score matching in Bangladesh, and found that international migration significantly increases expenditure on education, health, and food. De Brauw et al. (Citation2018) conducted a study on the impact of migration on welfare and found that migration does not reduce the welfare of migrant-sending households. Obiakor et al. (Citation2021) conducted a study on the impact of migration on the consumption of households using secondary data and system-GMM for 17 sub-Saharan African countries and found that remittance was positively and significantly associated with the consumption of households. Musakwa and Odhiambo (Citation2019) explored the impact of remittance on households’ poverty using time series data and an autoregressive distributed lag model in Botswana and found that remittance significantly reduces the poverty of households. A study conducted by Mukhtar et al. (Citation2018) on the effect of remittance on the income of households using cross-sectional data from 252 households and propensity score matching in Pakistan indicated that migration improves the income of households. Kangmennaang et al. (Citation2017) also conducted a study on the impact of remittance on food security using primary data from 1000 sample households, and propensity score matching in Malawi. The finding showed that migration significantly reduces the food insecurity of rural households.
On the contrary, some previous studies found a negative impact of participation in rural out-migration on the welfare of migrant-sending households (Alleluyanatha et al., Citation2021; Bryan et al., Citation2014; Lagakos et al., Citation2020: Muyambo & Ranga, Citation2019). For instance, Alleluyanatha et al. (Citation2021) conducted a study on the effect of youth migration and remittances on rural households’ livelihoods in southeastern Nigeria using primary data from 714 households and found that households without migrants were better off compared to households with migrants. Bryan et al. (Citation2014) conducted a study on migration in the developing world using survey data and found that participation in migration has welfare-decreasing effects. Likewise, Lagakos et al. (2018) conducted a study on the effect of migration on welfare in developing countries using cross-sectional data and the result showed that rural–urban migration significantly lowers the welfare of migrant-sending households. Muyambo and Ranga (Citation2019) assessed the socio-economic impact of labor migration from Zimbabwe to South Africa using primary data from 48 sample households and found that remittances are inadequate to meet all the needs of remittance-receiving households.
In sum, previous studies examined the impact of migration on the welfare of households using propensity score matching, OLS, logit model, ordered logit model, Tobit model, instrumental variable method, and autoregressive distributed lag model. However, these analytical tools do not control self-selection bias in rural out-migration due to unobserved factors. This study employed the new economics labor migration theory as a theoretical framework and the multinomial endogenous switching regression as an analytical model to quantify the impact of migration on the welfare of households.
3. Materials and methods
3.1. The study areas
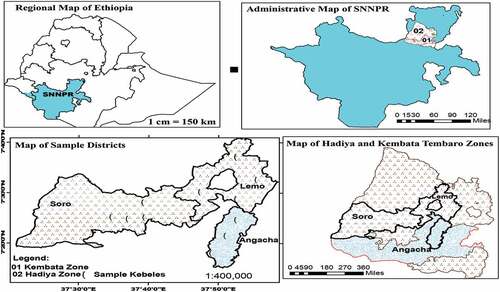
The Southern Nations, Nationalities, and People’s (SNNP) regional state is one of the nine regional states in Ethiopia. The SNNP regional state accounts for 10 and 20% of the land area and the population of Ethiopia, respectively. There are 15 zones in SNNP regional state, and this study was conducted in the Hadiya and Kembata-Tembaro zones of the SNNP regional state. These two zones are the most densely populated and the primary sources of both internal and international migrants in Ethiopia (Degelo, Citation2015). Hosanna and Durame are the capital towns of the Hadiya and Kembata-Tembaro zones and are located 267 km and 260 km southwest of Addis Ababa, respectively. The population of the Hadiya and Kembata-Tembaro zones was 1,590,927 and 902,073 people, while the total land size was 3,593.31 and 1,355.90 square kilometers, respectively (CSA (Central Statistical Agency), Citation2018). The Hadiya zone is comprised of 11 districts and the Kembata-Tembaro of seven. While Soro and Lemo districts were selected from the Hadiya zone, the Angacha district was selected from the Kembata-Tembaro zone for this study. These three districts are the leading sources of migrants (Kanko et al., Citation2013), and they are indicated in .
Figure 1. Map of study area, and sample districts in Hadiya and Kembata Tembaro zones.
Soro district is placed between 7°23’ and 7° 46’ north latitudes and 37°18’ and 37°23’ east longitudes. The altitude of the district ranges from 840 to 2850 m above sea level. The farming system of the district is a mixed system of crop production and livestock husbandry. Lemo district is located between 7°.22’ and 7°.45’ north latitudes and 37°.40’ and 38°.00’ east longitudes. The altitude of the district ranges from 1900 to 2720 m above sea level. Crop production and livestock husbandry are the chief livelihood source of the population. Anigacha district is found between 7° 30’ and 7° 34’ north latitudes and 37° 83’ and 37° 88’ east longitudes. The altitude of the district ranges from 1501 to 3000 m above sea level. Crop production and animal husbandry are the key sources of livelihood for the population in the district.
3.2. Data and measurement of poverty
Primary data were collected from a sample of 415 rural households in three sample districts, namely, Lemo, Soro, and Angacha in Southern Ethiopia using a survey questionnaire in the year 2021. The training was given to 11 data collectors, and they gathered primary data using a survey questionnaire from eleven sample Kebeles. Focus group discussions and interviews with key informants were held to supplement the data collected using the questionnaire. Also, secondary data were gathered from the Ethiopian Statistical Service, the World Bank, Food and Agriculture Organization, United Nations Development Program, the Ethiopian Ministry of Labor and Social Affairs, the United Nations Department of Economic and Social Affairs, and other published and unpublished documents as additional background information about the research area.
There are three techniques to quantify unidimensional poverty in empirical analysis and these include the direct calorie intake, food energy intake, and cost of basic need approaches (Foster et al., Citation1984). This study applied the cost of basic need approach which is widely used in the empirical analysis (Kassahun et al., Citation2022) and involves three steps. First, the poverty line is determined by using the consumption bundles of the first quartile or 25% of households. Second, the non-food poverty line is determined by adding the cost of other necessities such as clothing, shelter, health, education, and transport. Third, households can be categorized into poor and non-poor, and indices of poverty can be produced following the Foster, Greer, and Thorbecke (FGT) method. The following simple linear regression is used to determine the non-food poverty line from the food poverty line.
where is the ratio of food expenditure to total expenditure,
is the food expenditure,
is the total expenditure,
is the food poverty line,
and
are food share and slope, respectively,
and
are the general poverty line and the non-food poverty line, respectively. Once the food and non-food poverty lines are determined, the FGT method is applied to produce the indices of poverty, namely, incidence, depth, and severity. The mathematical presentation of FGT is given by;
where is the poverty index,
is the poverty line,
is household consumption per adult equivalent,
is the number of poor households,
is the number of sample households,
is poverty gap,
is the measure of the sensitivity of the index to poverty weight attached to the severity of poor people. The headcount ratio (
), the depth of poverty (
), and the severity of poverty (
) are obtained if the value of alpha is 0, 1, and 2, respectively. The headcount index (
) shows the proportion of the population below the poverty line, while the depth of poverty (
) shows the mean deficit between the poverty line and the income of the poor. However, the severity of poverty (
accounts for consumption inequality among poor households.
3.3. Sampling method and size
Sample zones and districts were purposively selected, while sample KebelesFootnote1 were selected using the proportional random sampling technique. First, from the 15 zones in the SNNP region, Hadiya and Kembata Tembaro zones were purposively selected for this study. This is because the two zones are the most densely populated and the primary sources of both internal and international migrants in southern Ethiopia (Degelo, Citation2015; Zewdu,). Second, from the 11 districts in the Hadiya zone, Soro and Lemo districts were selected, while from the 7 districts in the Kembata-Tembaro zone, the Angacha district was selected for this study. Still, these districts are the main sources of international migrants in the Hadiya and Kembata-Tembaro zones (Kanko et al., Citation2013). There are 33, 33, and 17 rural Kebeles in Lemo, Soro, and Angacha districts, respectively. Third, 11 sample Kebeles were selected from the sample districts using proportionate random sampling, and accordingly, four Kebeles (Sundusa, Sonda, Shara, and Bona), three Kebeles (Kerekicho, Garba Fandide, and Bobicho), and four Kebeles (Haise, Shurmo, Jawe, and Sena) were selected from Soro, Angacha, and Lemo districts, respectively. Fourth, sample gotsFootnote2 were randomly selected from each sample Kebele to prepare a sampling frame that contains the lists of households with no migrants, rural–urban migrants, and international migrants. Sample households were included in the study using a stratified random sampling technique from each sample got. As a result, 193, 85, and 137 sample households with no migrants, rural–urban migrants, and international migrants were used in this study, respectively. This study employed the following Cochran (Citation1963) formula to obtain an adequate sample size with 95, 50, and 5% confidence levels, degree of variability in the population, and the level of precision, respectively.
where ,
,
and
are the measure of precision, the assumed level of variability in the population, one minus the level of variability in the population, the sample size of the study, the total population, and the value of standard normal distribution, respectively. The total households (
) in the three districts, the degree of variability, and level of precision in this study were 69,277, 0.5, and 0.005, respectively. Based on the above formula, a sample size of 383 was determined for the present study. But by adding 10% of this figure to account for incomplete responses, a total of 421 questionnaires were distributed to enumerators and this study finally used data from 415 completed questionnaires.
3.4. Model specification
The consumption per adult equivalent per day of household is used as an outcome variable to quantify the impact of participation in migration on rural poverty in the study area. However, there is a problem of endogeneity and self-selection bias in quantifying the impact of migration on the welfare of migrant-sending rural households. To solve this problem, the multinomial endogenous switching model is applied in this study to measure the impact of migration on consumption per adult equivalent of households. Assume that is the expected benefit that the rural household gets from choosing the
alternative migration which depends on the observed,
and unobserved factors,
The latent variable model which describes the behavior of rural households in choosing one alternative among the three alternatives to maximize its expected utility is given by;
where is the latent variable that measures the expected utility of the ith household from choosing among jth alternative,
,
is a vector of exogenous covariates,
is a vector of parameters to be estimated and
is an error term. In the multinomial endogenous switching model, a household has j choices and the latent outcome variable is given by;
where is the observed value of the outcome variable for the ith household of choosing alternative
,
,
…
are error terms of the outcome equation,
,
and
is the latent variable. Given the assumption that
is independently and identically distributed or the independence of the irrelevant alternatives (IIA) assumption, the selection model of migration leads to the following multinomial logit model where the likelihood of choosing alternative
,
In the second stage, a multinomial endogenous switching regression model is used to quantify the impact of participation in rural out-migration on consumption per adult equivalent of the household. The rural household without a migrant, is the base category in this study. Hence, the consumption per adult equivalent of household is defined as
regime:
where is the consumption per adult equivalent of the ith household in regime
,
,
,
is vector covariates, and
is the unobserved factor. Based on equations (6), (7), and (8), the selection bias-corrected outcome equations are given.
where is the probability that the ith rural household chooses the jth alternative,
is the degree of correlation between the error term of the participation equation,
and the error term of the outcome equation,
and
is the inverse transformation for the normal distribution function. The multinomial endogenous switching regression model is also used to estimate the counterfactual data to quantify the impact of migration on consumption per adult equivalent of households. Following the work of Bourguignon et al. (Citation2007) and assuming households without migrants,
as the base category, mean values of consumption per adult equivalent of households with migrants are given by;
Moreover, once the actual mean values of consumption per adult equivalent of households are determined using the above two equations, the mean values of consumption per adult equivalent of households from the counterfactual data are given by;
The conditional average treatment effects on treated (ATT) could be computed by subtracting equations (14) and (15) from equations (12) and (13), respectively. The positive and significant values of ATT imply that migration improves the welfare of households in the study area.
3.5. Description of variables and hypotheses
The multinomial endogenous switching model estimates the participation equation and the outcome equation simultaneously. The dependent variable in the first-stage regression of the multinomial endogenous switching model is rural out-migration, which is a nominal variable with three categories,Footnote3 namely, households without migrants rural–urban migrants, and with international migrants. Based on the literature review, family size, drought, crop failure, age of household, and education of household head are expected to increase the likelihood of migration.
As one pushing factor in migrant-sending areas, the occurrence of drought is expected to positively impact participation in rural out-migration (Abeje, Citation2021; Ma et al., Citation2019). Similarly, family size tends to reduce the resources and consumption per capita in migrant-sending rural areas and positively impacts the likelihood of participating in migration. Therefore, family size is considered one pushing factor of rural out-migration in migrant-sending rural areas. As the age of the household head increases, the number of active family members increases, and this is positively related to migration, while the dependency ratio is expected to decrease the propensity to participate in rural out-migration (Kefelegn, Citation2020). The presence of return-migrants in the village and the number of active male family members are also expected to increase the likelihood of migration (Tegegne & Penker, Citation2016). The tropical livestock unit and land size of rural households are expected to be negatively related to rural–urban migration and positively related to participation in international migration. This could be because livestock ownership and land size will increase the income of rural households, and this may reduce the intention to participate in international migration. But rural households may finance international migration by selling livestock and using agricultural land as collateral (Wondimagegnhu & Zeleke Citation2017). Moreover, the years of schooling of the household head and the highest years of schooling in the family are expected to impact participation in migration positively (CitationAjaero et al. Citation2018).
The dependent variable in the second-stage regression of the multinomial endogenous switching model is consumption per adult equivalent (). The covariates in the second-stage regression include all covariates in the first-stage regression less two instrumental variables, namely, return migrant and religion. The treatment variable is rural out-migration, which is a nominal variable with three categories, namely, households without migrants, with rural–urban migrants, and international migrants. There are dichotomous results in the empirical literature about the impact of migration on the welfare of households. This could be because migration affects the welfare and agricultural production of the migrant-sending rural areas via two channels: the remittance channel and the lost labor channel. Accordingly, some previous studies found a positive and significant impact of participation in migration on the welfare of migrant-sending households (Ajefu & Ogebe, Citation2021; Ebadi et al., Citation2018; Moniruzzaman, Citation2020; Mora-Rivera & van Gameren, Citation2021; Nuñez & Osorio-Caballero, Citation2021; Stampini & Robles, Citation2021), while other studies found a negative and significant association between migration and welfare of migrant-receiving households (Alleluyanatha et al., Citation2021; Lagakos et al., Citation2020: Muyambo & Ranga, Citation2019). The description, measurement and expected relationship of variables are provided in .
Table 1. Description, measurement, and expected signs of covariates in the model
4. Results and discussion
4.1. Poverty status of sample households
To set the poverty line, the poorest 25% of sample households were identified by arranging annual consumption per adult equivalentFootnote4 in ascending order and used as reference households. Data on quantities in kilograms or litres of 20 food itemsFootnote5 were gathered through a survey questionnaire from sample households and valued at their respective local market prices to determine the food poverty line in the study areas. To obtain the non-food poverty line for rural households, the food poverty line is divided by the food share of the first quartile of the expenditure distribution. The food share of expenditure of poor households is computed by regressing the food expenditure share in the total expenditure on the ratio of the total expenditure to the food poverty line. In this study, expenditures on clothing, health, education, housing, education, and social obligation were included as non-food expenditures.
The results show that the mean annual food, non-food, and total poverty lines are Birr 8997.52, 2249.38, and 11,246.9, respectively, in the study area. If the annual consumption per adult equivalent is less than the absolute poverty line, the household is considered to be poor, and otherwise non-poor. This absolute poverty line is higher compared to the national annual expenditure poverty line of Birr 7184 (NPC (National Planning Commission), Citation2017), and this may be due to the recent rise in market prices of goods in Ethiopia. The incidence, depth, and severity of poverty in the study area are 39.76, 10.11, and 3.55%, respectively. In other words, 39.76% of rural households are unable to obtain the minimum consumption expenditure of 11,242.18 Ethiopian Birr per adult equivalent per year in the Hadiya and Kembata-Tembaro zones.
While the national incidence of poverty in Ethiopia was 23.5%, the incidence of poverty for the urban and rural populations was 14.8 and 25.6%, respectively, in 2016 (CSA (Central Statistical Agency), Citation2021). This suggests that the incidence of rural poverty is higher in the study areas compared to the national rate of poverty. A study conducted by Zemarku et al. (Citation2022) found that the incidence, depth, and severity of poverty are 69.6, 4.2, and 17%, respectively, in the Wolaita zone, while a study conducted by Kassahun et al. (Citation2022) on analysis of food and non-food poverty in Gurage zone showed that the incidence, depth, and severity of poverty are 0.333, 0.051, and 0.013, respectively. Besides, Shaga et al. (Citation2021) found that the incidence, depth, and severity of poverty are 0.3947, 0.1035, and 0.0427, respectively, in the Wolaita zone. Yet, a study conducted by Ermiyas et al. (Citation2019) obtained that the incidence, depth, and severity of poverty are 49, 8.3, and 6.5%, respectively.
The poverty gap index shows the mean aggregate consumption deficits of poor households compared to the poverty line. The depth of poverty in this study is 3.55%, and this shows the percentage of total resources required to lift the total poor households out of poverty. In other words, a total of Birr 3992.65 per year per adult equivalent is required to bring one poor person to the poverty line. The product of the depth of poverty (3.55%), the poverty line (Birr 11,246.9), and the number of poor households (165) equals the resource required (Birr 658,787.17). Lastly, to quantify the consumption inequality among poor households, the severity of poverty was estimated. This measure places more weight on those households that are far below the poverty line and the consumption inequality in this study is 3.55% as it is presented in Table . The incidence, depth, and severity of poverty are lower for households with international migrants compared to households with rural-urban and international migrants. Further, the incidence, depth, and severity of food poverty are 34.70, 9.47, and 3.55%, respectively, in the study area as it is indicated in Table .
Table 2. Incidences of poverty and poverty lines in the study area
4.2. Rural poverty by migration status of households
As indicated in Table , the incidence, depth, and severity of consumption poverty are higher for households without migrants and rural–urban migrants compared to households with international migrants in the study area. This may suggest that rural–urban migration increases the incidence of rural poverty, while participation in international migration reduces the incidence of rural poverty. This discrepancy in the effect of rural–urban migration and international migration could be because remittances from rural–urban migrants are unable to compensate the contribution of migrants to household income before their migration. This result is consistent with Mora-Rivera and van Gameren (Citation2021) who conducted a study on the impact of m by migration on the welfare of migrant-sending households in Mexico using secondary data and found internal remittances are not enough to make remittance-receiving households better-off. Moreover, the incidence, depth, and severity of rural poverty are higher for households with rural–urban migrants compared to households without migrants in Hadiya and Kembata-Tembaro zones.
Table 3. Distribution of rural poverty indices by migration status of households
Moreover, to compare the mean of continuous variables for participants and non-participants in rural out-migration, the independent samples t-test is used and the results are presented in Table . The average family size, tropical livestock unit, kilocalories per adult equivalent per day, and land size in a hectare of households with migrant family members are significantly higher compared to households without migrants at a 1% level of significance. This suggests that family size is one pushing factor of rural out-migration in the study area. In addition, the average dependency ratio of participant households is significantly lower compared to non-participant households.
Table 4. Mean difference tests for households with and without migrants
The results in Table also reveal that the average asset per capita of households with migrants is significantly higher compared to households without migrants. The mean annual consumption expenditure per capita of households with migrant family members is also significantly higher compared to households with no migrant family members. The mean frequency of extension visits and the mean adult equivalent of households who participated in migration are significantly higher compared to households who did not participate in migration. The implication is that households with higher consumption expenditure, frequency of extension visits, and adult equivalents are more likely to participate in migration in the study areas.
The mean difference tests for consumption expenditure among rural households without migrants, rural–urban migrants, and international migrants are computed and presented in Table using the analysis of variance (ANOVA). The mean annual consumption expenditure per adult equivalent of households without migrants is lower compared to households with international migrants by Birr 3555.61, and the differences are significant at 1%. Similarly, the mean annual consumption expenditure per adult equivalent of households with rural–urban migrants is lower compared to households with international migrants by Birr 5304.74, and the differences are significant at 1%. But the mean annual consumption expenditure per adult equivalent of rural households without migrants and with rural–urban migrants are not statistically different. This suggests that participation in international migration may reduce ex-post deprivation of migrant-sending rural households in the study areas. The mean family size of households with migrants is significantly higher compared to households without migrants, and this implies that family size increases the propensity of migration as predicted by the push and pull factors theory of migration.
Table 5. One-way ANOVA test for annual consumption expenditure by migration status
4.3. Regression results of multinomial endogenous switching model
The multinomial endogenous switching regression model is applied to simultaneously estimate the determinants and impact of participation in rural out-migration on the poverty of migrant-sending rural households. First, the determinant of rural out-migration was estimated using the multinomial logistic regression, and the result is presented in Table . The outcome variable is a nominal variable with three categories, namely, households without migrants, households with rural–urban migrants, and households with international migrant members. On the one hand, the Wald test result is significant at a 1% level of significance, and this indicates that the data fit the model well. On the other hand, the Pseudo R-square is 70.57% and this also shows that rural out-migration is better explained by variables included in the model.
Table 6. Regression results of determinants of rural out-migration in southern Ethiopia
The age of the household head and the likelihood of participation in rural–urban migration are positively and significantly related to rural out-migration at a 5%, citrus-paribus. That means as the age of the household head increases, it is more likely for adult family members to out-migrate from rural areas primarily for searching for better-paying jobs. Besides, the coefficient of education of household heads is positive and significant in influencing rural–urban migration. Besides, female-headed households are more likely to participate in both domestic rural-urban and international migration compared to male-headed rural households in the study area. A study conducted by Tegegne and Penker (Citation2016) also found that age, education level of household head, and being female-headed households are positively and significantly related to the probability of rural–urban migration.
The coefficient of the dummy for irrigation is negative and significant at 5%. This could be because the use of irrigation by households increases their farm income and reduces the likelihood of rural out-migration. The study also found a positive and significant association between family size and participation in rural out-migration. A study conducted by Wondimagegnhu & Zeleke, (Citation2017) also supports this result. By implication, family size is one pushing factor of rural out-migration in migrant-sending rural areas. The tropical livestock unit is positively and significantly related to the probability of participating in international migration. This could be because rural households may finance international migration by selling livestock due to the higher remittances from international migrants compared to remittances from rural–urban migrants. A study conducted by Wondimagegnhu & Zeleke, (Citation2017) found a negative and significant association between tropical livestock units and rural–urban migration. The coefficient of household saving is also positive and statistically significant in influencing both domestic rural–urban migration and international migration. Asset per adult equivalent is negatively and significantly related to the likelihood of participation in rural–urban migration, but it is positively and significantly associated with the chance of participating in international migration. This suggests that households with a lower asset per adult equivalent are more likelihood to participate in rural–urban migration, but households with a higher asset per adult equivalent are more likely to participate in international migration in the study area.
Besides, the frequency of extension visit is positively and significantly related to the probability of participation in international migration. This suggests that the frequency of extension visits increases rural households’ access to information. As it is presented in Table , the dummy for crop failure is positively and significantly related to the probability of participation in international migration. Households who experienced crop failure are 2.293 times more likely to participate in international migration compared to those households who did not experience crop failure. That means the occurrence of drought and crop failure are the main pushing factors of migration in migrant-sending areas as predicted by the push and pull factors (Lee, Citation1966) theory of migration. The dummy variable for lack of cash by rural households is negatively and significantly associated with the logarithm of the odds of participating in international migration. In line with expectations, the presence of return migrants in the village is positively and significantly related to rural–urban migration and international migration at 1%, citrus-paribus. This suggests that rural households with return migrants are more likely to participate in rural out-migration compared to households with no return migrant members. Land renting out is positively and significantly associated with international migration at a 1% level of significance. Participants in the focus group discussion reported that some household finance international migration by renting out agricultural land in Hadiya and Kembata-Tembaro zones.
The impact of participation in migration on consumption per capita and kilocalories per adult equivalent per day was quantified using the multinomial endogenous switching regression, and the results are presented in Table . The outcome variables are consumption per capita and kilocalories per adult equivalent per day of rural households, while the treatment variable is participation in rural out-migration, which is a nominal variable with three categories, namely, households without migrants, with rural–urban migrants and with international migrants. The estimation results of the multinomial endogenous switching regression compare the actual values of consumption per capita and kilocalories per adult equivalent per day of households who participated in rural out-migration with the counterfactual values if they had not participated in rural out-migration.
Table 7. Impact of rural out-migration on vulnerability, poverty, and kilocalories per AE
As indicated in Table , the actual mean consumption per capita of households with rural–urban migrants and international migrants is Birr 11,607.4 and 16,912, while the counterfactual mean rural multidimensional poverty of households with rural–urban migrants and international migrants is Birr 12,275.7 and 13,029.2, respectively. Consequently, the average treatment effects on treated (ATT) of households with international migrants are Birr 3882.9 and statistically significant at a 1% level, while the ATT of households with rural–urban migrants is Birr-668.3 and statistically insignificant. Put differently, participation in international migration significantly reduces consumption per capita of rural households, on average, by 29.8%. This supports the remittance hypothesis of the new economics labor migration theory, which assumes that migration improves the welfare of migrant-sending households via the remittance channel (Stark, Citation1985). The negative and insignificant impact of rural–urban migration on the consumption per capita of migrant-sending households could be because remittances from rural–urban migrants are insufficient to compensate the contribution of the migrants to households’ income before migration
This finding is consistent with studies conducted by Mora-Rivera and van Gameren (Citation2021), Muyambo and Ranga (Citation2019), and Alleluyanatha et al. (Citation2021). But the positive and significant impact of international migration on consumption per capita of migrant-sending households is consistent with studies conducted by Ebadi et al. (Citation2018), Marta et al. (Citation2020), Brown (Citation2020), Moniruzzaman (Citation2020), Ajefu and Ogebe (Citation2021), Nuñez and Osorio-Caballero (Citation2021), and Stampini and Robles (Citation2021), and it contradicts with studies conducted by Muyambo and Ranga (Citation2019), and Lagakos et al. (2018).
The heterogeneity effect for households with international migrants is negative and statistically significant at 1% in quantifying the impact of migration on consumption per capita of households. This suggests that the positive impact of participation in international migration is higher for non-participant households had they participated in migration compared to participant households. On the other hand, the transitional heterogeneity for households with rural–urban migrants and international migrants is positive and significant in quantifying the impact of migration on kilocalories per adult equivalent per day. The implication is the positive impact of participation in migration is higher for participant households compared to non-participant households in the study areas. Put differently, households who participated in rural-urban and international migration would have lower kilocalories per adult equivalent per day if they had not participated in rural out-migration.
The last column in Table indicates the percentage change, which is computed by taking the ratio of ATT to the counterfactual mean. Therefore, participation in rural–urban migration reduces, on average, consumption per capita of migrant-sending households by 5.4%, while participation in international migration increases consumption per capita of rural households by 29.8%. Similarly, participation in rural-urban and international migration increases the kilocalories per adult equivalent per day of rural households by 29.33 and 53.16%, respectively, and significant at a 1% level. This finding is consistent with studies conducted by Thapa and Acharya (Citation2017), and Nuñez and Osorio-Caballero (Citation2021) who found that rural–urban migration significantly improves the unidimensional welfare of households. Lastly, the falsification test was conducted using the Wald test and the likelihood ratio test, and the results show that the selected instruments are valid.
5. Conclusion
While many previous studies examined the sources of rural out-migration and its impact on migrant-receiving urban areas, studies on the impact of rural-urban and international migration on the welfare of migrant-sending origin areas are scarce. Though few studies evaluated the impact of rural out-migration on the welfare of rural households, they found mixed results and did not control for self-selection bias due to unobserved factors. Hence, this study examined the impact of rural-urban and international migration on the welfare of migrant-sending rural households by applying the new economics labor migration theory as a theoretical framework, and the multinomial endogenous switching regression as an analytical model in southern Ethiopia. Data were collected from 415 sample households using stratified random sampling in the year 2021. The cost of basic need approach and the Foster, Greer, and Thorbecke (FGT) method were employed to set the poverty line and produce the indices of poverty, respectively.
The descriptive results show that the mean annual food and non-food poverty lines are found to be Birr 8997.52 and 2249.38 per adult equivalent, respectively, in the Hadiya and Kembata-Tembaro zones. The incidence, depth, and severity of general poverty are 39.76, 10.11, and 3.55%, while the incidence, depth, and severity of food poverty are 34.70, 9.47, and 3.58%, respectively. The mean annual consumption expenditure per adult equivalent is significantly higher for households with international migrants compared to households without migrants. The incidence, depth, and severity of poverty are lower for households with international migrants compared to other households. But the incidence, depth, and severity of poverty are higher for households with rural–urban migrants compared to other households. This suggests that international migration tends to reduce rural poverty, while rural–urban migration tends to increase rural deprivation in the study area. By implication, migration gives with one hand and takes with the other hand, and the impact of migration on the welfare of migrant-sending households depends on the relative strength of the remittance channel and the lost labor channel.
The first-stage regression result of the multinomial endogenous switching regression showed that family size, saving of households, and return migrants are positively and significantly associated with participation in rural-urban and international migration, while the use of irrigation, participation in community, and being male-headed households are negatively and significantly related to both rural-urban and international migration. But asset per adult equivalent, number of active male family members, participation in land renting out, and tropical livestock unit are international migration enhancing factors, whereas the age of household head, the occurrence of drought, and education of household head are rural–urban migration enhancing factors in Hadiya and Kembata-Tembaro zones.
The second-stage regression result of the multinomial endogenous switching model showed that participation in international migration significantly increases consumption per adult equivalent of households by 29.8% in the study area. Besides, participation in rural-urban and international migration significantly increases kilocalories per adult equivalent per day by 29.33 and 53.16%, respectively. Hence, participation in international migration is a positive contributor to the welfare of migrant-sending households. But the contribution of rural–urban migration to household consumption expenditure is negative and insignificant, and this could be because remittances from rural urban-migrants are insufficient to compensate for the contributions of the migrants to households’ income before migration. The result supports the remittance hypothesis of the new economics labor migration theory. Promoting access to land, capital, farm employment, non-farm employment, irrigation, family planning, and basic public services would improve the welfare of rural households, and reduce the current wave of rural out-migration in Southern Ethiopia. Policymakers are also required to provide investment opportunities to migrants and remittance-receiving households in origin areas and support migrants with information about receiving areas. The use of cross-sectional data, unidimensional measure of welfare, and the dependency on quantitative analysis are the limitations of this study. Future researches may focus on the impact of rural labor out-migration on income inequality, rural labor, and land markets.
Acknowledgements
The authors are highly grateful to all data collectors, and administrators of sample Kebeles of the Angacha, Soro, and Lemo Districts for their kind contributions for the completion of this study. The authors would also like to appreciate Haramaya University and Arba Minch University for providing the required materials and financial supports for this research work.
Disclosure statement
No potential conflict of interest was reported by the author(s).
Data availability statement
The authors will provide any data related to this study on request.
Additional information
Funding
Notes on contributors

Fassil Eshetu
Fassil Eshetu (Assistant Professor) The author has good experience in teaching postgraduate students, conducting quantitative research, and developing community projects at Arba Minch University, one of the leading higher education institutions in Ethiopia. The research areas of the author include rural poverty, migration, vulnerability, climate-smart agriculture, livelihood diversification, efficiency, food insecurity, and resilience of rural households. The author published different articles in reputable international journals. Besides, the author provides different training on statistical software such as STATA, EVIEWS, SPSS, AMOS, and R software.
Notes
1. Regions, zones, districts, kebeles, and gots are administrative levels from the highest to the lowest.
2. Gots are the lowest level of administration in the study area, which mostly contain more than 50 households. From a total of 147 gots in all sample Kebeles, 36 sample gots were included in the study.
3. Households with both rural-urban and international migrants are categorized under households with international migrants since their numbers are very few, and rural-urban migrants are less likely to remit if there is an international migrant in their family.
4. Adult equivalent (AE) is a family size adjusted for age and sex of family members.
5. The food items include wheat, maize, teff, barely, lentils, peas, beans, sweet potato, oil, coffee, cabbage, tomato, onion, pepper, enset, butter, milk, meat, potato, and sugar.
References
- Abdi, M. (2021). Remittance and poverty in Somalia: Propensity score matching approach. Journal of Research in Economics, 5(1), 50–24. https://doi.org/10.29228/jore.3
- Abeje, A. (2021). Causes and effects of rural-urban migration in Ethiopia. African Studies, 80(1), 77–94. https://doi.org/10.1080/00020184.2021.1904833
- Adugna G. (2019). Migration patterns and emigrants’ transnational activities: comparative findings from two migrant origin areas in Ethiopia. Comparative Migration Studies, 7(1). https://doi.org/10.1186/s40878-018-0107-1
- Ajaero, C. K., Nzeadibe, C. T., Obisie-Nmehielle, N., & Ike, C. C. (2018). The linkages between international migration, remittances, and household welfare in Nigeria. Migration and Development, 7(1), 40–54. https://doi.org/10.1080/21632324.2017.1322171
- Ajefu, J. B., & Ogebe, J. O. (2021). The effects of international remittances on expenditure patterns of the left-behind households in Sub-Saharan Africa. Review of Development Economics, 25(1), 405–429. https://doi.org/10.1111/rode.12721
- Alleluyanatha, E., Awotide, B., Nguezet, P., Bello, L., Coulibaly, A., Abdoulaye, T., Manyong, V., & Bamba, Z. (2021). Effect of youth migration and remittances on rural households’ livelihoods in south Eastern Nigeria. International Conference of Agricultural Economists, August 17–31, Dar Es Salam, Tanzania.
- Bourguignon, F., Fournier, M., & Gurgand, M. (2007). Selection bias corrections based on the multinomial logit model. Journal of Economic Surveys, 21(1), 174–205. https://doi.org/10.1111/j.1467-6419.2007.00503.x
- Brown, E. (2020). Shifting landscapes: The effects of male out-migration on food security and food sovereignty in Rural Nepal. Independent Study Project (ISP) Collection. SIT Graduate Institute. https://digitalcollections.sit.edu/isp_collection/3343
- Bryan, G., Chowdhury, S., & Mobarak, M. (2014). Underinvestment in a profitable technology: The case of seasonal migration in Bangladesh. Econometrica, 82(5), 1671–1748. http://www.econometricsociety.org
- Cochran, W. (1963). Sampling Techniques (2nd) ed.). John Wiley and Sons, Inc.
- CSA (Central Statistical Agency). (2018). Ethiopian population projection of 2017. Central Statistical Agency of Ethiopia, Addis Ababa.
- CSA (Central Statistical Agency). (2021). Ethiopian population projection of 2021. Central Statistical Agency of Ethiopia, Addis Ababa.
- CSA (Central Statistical Agency). (2021). Ethiopian labor force and migration survey. Statistical Bulletin 588, UN Migration and Ethiopian Central Statistical Agency, Addis Ababa.
- De Brauw, A., Mueller, V., & Woldehanna, T. (2018). Does internal migration improve overall well-being in Ethiopia? Journal of African Economies, 27(3), 347–365. https://doi.org/10.1093/jae/ejx026
- Degelo, H. (2015). Socio-economic impacts of migration of Ethiopians to South Africa. The Case of Kembata-Tembaro and Hadiya Zones. MSc Thesis, Addis Ababa University, School of Graduate Studies, Department of Political Science and International Relations.
- Ebadi, N., Ahmadi, D., Sirkeci, I., & Melgar-Quiñonez, H. (2018). The impact of remittances on food security status in the global south. Remittances Review, 3(2), 135–150. https://doi.org/10.33182/rr.v3i2.543
- Ermiyas, A. M., Batu, M. M., & Teka, E. (2019). Determinants of rural poverty in Ethiopia: A household level analysis in the case of Dejen Woreda. Arts Social Sci J, 10, 2. https://doi.org/10.4172/2151-6200.1000436
- FAO (Food and Agriculture Organization). (2019). The linkages between migration, agriculture, food security, and rural development. Rome.
- FAO (Food and Agriculture Organization). (2020). Migration Framework – Migration as a choice and an opportunity for rural development. Rome.
- FDRE (Federal Democratic Republic of Ethiopia). (2005). The protection of land rights in Ethiopia. Afrika Focus, 20(2), 53–184.
- Foster J, Greer J and Thorbecke E. (1984). A Class of Decomposable Poverty Measures. Econometrica, 52(3), 761. https://doi.org/10.2307/1913475
- Gemecho, T. L., & Goshu, A. T. (2017). Logistic mixed modelling of determinants of international migration from the southern Ethiopia: Small area estimation approach. American Journal of Theoretical and Applied Statistics, 6(3), 170–182. https://doi.org/10.11648/j.ajtas.20170603.16
- Harris, J., & Todaro, M. (1970). Migration, unemployment & development: A two-sector analysis. American Economic Review, 60(1), 126–142. https://www.jstor.org/stable/1807860
- Horwood, C. (2009). In pursuit of the southern dream: Assessment of the irregular movement of men from East Africa to South Africa. International Organization for Migration.
- Kangmennaang, J., Bezner-kerr, R., & Luginaah, I. (2017). Impact of migration and remittances on household welfare among rural households in Northern and central Malawi. Migration and Development, 232, 1–17. https://doi.org/10.1080/21632324.2017.1325551
- Kanko, T. D., Bailey, A., & Teller, C. (2013). Irregular migration: Causes and consequences of young adult migration from southern Ethiopia to South Africa. Paper presented at XXVII IUSSP International Population Conference, Busan, South Korea, p 26–31.
- Kassahun, T., Tessema, A., & Adbib, K. (2022). Analysis of rural household food and non-food poverty status in Ethiopia: The case study from Meskan District. Food and Energy Security, 11(2), 1–15. https://doi.org/10.1002/fes3.363
- Kefelegn, H. (2020). Determinants of youths rural to urban migration in Ethiopia (Case of Addis Ababa). Academic Journal of Research and Scientific Publishing, 2(15), 5–7.
- Lagakos, D., Marshall, S., Mobarak, A. M., Vernot, C., & Waugh, M. (2020). Migration costs and observational returns to migration in the developing world. J. Monetary Econ, 113, 138–154. https://doi.org/10.1016/j.jmoneco.2020.03.013
- Lee, E. (1966). A theory of migration. Demography, 3(1), 47–57. https://doi.org/10.2307/2060063
- Lewis, W. (1954). Economic Development with Unlimited Supplies of Labour. The Manchester School, 22(2), 139–191. https://doi.org/10.1111/j.1467-9957.1954.tb00021.x
- Lyons, A. C., & Kass-Hanna, J. (2021). A multidimensional approach to measuring vulnerability to poverty of Syrian refugees in Lebanon. The Economic Research Forum (ERF), Working Paper, the University of Illinois at Urbana-Champaign.
- Ma, L., Chen, M., Che, X., & Fang, F. (2019). Farmers’ rural-to-urban migration, influencing factors and development framework: A case study of the village of Gansu, China. International Journal of Environmental Research and Public Health, 16, 5. https://doi.org/10.3390/ijerph16050877
- Marta, J., Fauzi, A., Juanda, B., Rustiadi, E., Marta, J., & Fauzi, A. (2020). Understanding migration motives and its impact on household welfare: Evidence from rural-urban migration in Indonesia. Regional Studies, Regional Science, 7(1), 118–132. https://doi.org/10.1080/21681376.2020.1746194
- Massey, D. S., Arango, J., Hugo, G., Kouaouci, A., Pellegrino, A., & Taylor, J. E. (1998). Worlds in motion. Understanding International migration at the end of the millennium. Clarendon Press.
- MoLSA (Ministry of Labor and Social Affairs). (2018). Assessment of awareness raising interventions to prevent irregular migration. Report submitted to International Labor Organization-Ethiopia.
- Moniruzzaman, M. (2020). The Impact of remittances on household food security: Evidence from a survey in Bangladesh. Migration and Development, 1–20. https://doi.org/10.1080/21632324.2020.1787097
- Mora-Rivera, J., & van Gameren, E. (2021). The impact of remittances on food insecurity: Evidence from Mexico. World Development, 140, 105349. https://doi.org/10.1016/j.worlddev.2020.105349
- Mukhtar, U., Zhong, Z., Tian, B., & Razzaq, A. (2018). Does rural-urban migration improve employment quality and household welfare? Evidence from Pakistan. Sustainability, 10, 1–14. https://doi.org/10.3390/su10114281
- Musakwa, M. T., & Odhiambo, N. M. (2019). The impact of remittance inflows on poverty in Botswana: An ARDL approach. Journal of Economic Structures, 8(1). https://doi.org/10.1186/s40008-019-0175-x
- Muyambo, B., & Ranga, D. (2019): Socio-economic impacts of labour migration from Zimbabwe to South Africa: An investigation based on rural Bikita District, Migration and Development, 9(2), 274–290. https://doi.org/10.1080/21632324.2019.1603670
- NPC (National Planning Commission). (2017). Ethiopia’s progress towards eradicating poverty: An interim report on 2015/16 poverty analysis study. Addis Ababa.
- Nuñez, R., & Osorio-Caballero, M. I. (2021). Remittances, migration, and poverty. A study for Mexico and Central America. SSRN Electronic Journal, 106018, 32. https://doi.org/10.2139/ssrn.3783186
- Obiakor, R. T., Akpa, E. O., & Okwu, A. T. (2021). The Effect of Inward and Outward Remittances on Welfare in Africa, 17(2), 84–103.
- Odekon, M. (2015). Multidimensional Poverty Index. The SAGE Encyclopedia of World Poverty, 8(1), 31–37. https://doi.org/10.4135/9781483345727.n566
- Raihan, S., Uddin, M., & Ahmmed, S. (2021). Impact of foreign remittances on the household spending behavior in Bangladesh. Migration and Development, 1–23. https://doi.org/10.1080/21632324.2020.1870835
- Ravenstein, E. (1885). The laws of migration. Journal of the Statistical Society of London, 48(2), 167–235. https://doi.org/10.2307/2979181
- Seetha, P. (2012). Impact of rural to urban labor migration and the remittances on sending household welfare in Sri Lankan. Munich Personal RePEc Archive.
- Shaga, H. H., Mega, T. L., & Senapathy, M. (2021). Determinants of rural household poverty: The Case of Sodo Zuria Woreda, Wolaita Zone, Southern Ethiopia. European Journal of Sustainable Development Research, 5(2), 1–9. https://doi.org/10.21601/ejosdr/10844
- Stampini, M., & Robles, M. (2021). Effect of remittances on food security in Venezuelan households. June.
- Stark, O. (1985). The new economics of labor migration. The American Economic Review, 75(2), 173–178. https://www.jstor.org/stable/1805591
- Taylor, J., & Wyatt, J. (1999). Shadow value of migrant remittances, income, and inequality in a household-farm economy. Journal of Development Studies, 32(6), 899–912. https://doi.org/10.1080/00220389608422445
- Tegegne, A., & Penker, M. (2016). Determinants of rural out-migration in Ethiopia: Who stays and who goes? Demographic Research, 35(1), 1011–1044. https://doi.org/10.4054/DemRes.2016.35.34
- Terrazas, M. (2007). Beyond regional circularity: The emergence of an Ethiopian Diaspora. Migration policy institute.Migration Information Source. http://www.migrationpolicy.org/article/beyond-regional-circularityemergence-ethiopian-diaspora
- Thapa, S., & Acharya, S. (2017). Remittances and household expenditure in Nepal: Evidence from cross-section data. Economies, 5(2), 1–17. https://doi.org/10.3390/economies5020016
- Todaro, M. (1969). A model of labor migration and Urban Unemployment in less developed countries. The American Economic Review, 59(1), 138–148. https://www.jstor.org/stable/1811100
- UNCTAD (United Nations Conference on Trade and Development). (2020). Assessing the dynamics between migration and development in Africa, International Forum on Migration Statistics, Cairo, Egypt.
- UNDESA (United Nations Department of Economic and Social Affairs). (2020). International Migrant Stock, United Nations database.
- UN (United Nations). (2016). The world’s cities in 2016. United Nations. https://doi.org/10.18356/8519891f-en.
- Wondimagegnhu, B., & Zeleke, M. ((2017). Determinants of rural out-migration in habru district of northeast Ethiopia. International Journal of Population Research, 2017, 1–8. https://doi.org/10.1155/2017/4691723
- World Bank. (2021). Reversals of fortune. Poverty and shared prosperity.
- Yoshino, N., Taghizadeh-Hesary, F., & Otsuka, M. (2019). International remittances and poverty reduction: Evidence from developing Asia. Journal of Comparative Asian Development, 17(2), 21–42. https://www.adb.org/publications/international-remittances-and-poverty-reduction
- Zemarku, Z., Abrham, M., Bojago, E., & Dado, T. B. (2022). Determinants of small-scale irrigation use for poverty reduction: The Case of Offa Woreda, Wolaita Zone, Southern Ethiopia (pp. 1–12). Advances in Agriculture.
- Zewdu, G. A. (2018). Irregular migration, informal remittances: Evidence from Ethiopian villages. GeoJournal, 83(5), 1019–1034. https://doi.org/10.1007/s10708-017-9816-5
