
 ?Mathematical formulae have been encoded as MathML and are displayed in this HTML version using MathJax in order to improve their display. Uncheck the box to turn MathJax off. This feature requires Javascript. Click on a formula to zoom.
Abstract
The level of causation and interdependencies among three commodities (cocoa, gold, and Brent crude oil), five banking sector performance indicators (Capital Adequacy Ratio (CAR), Non-Performing Loans (NPL), Return on Equity (ROE), Return on Assets (ROA) and Core Liquid assets to total assets (CLATA)), and three general macroeconomic indicators (Inflation, Exchange rate and Global Economic Policy Uncertainty) are explored in this study. As a result, the wavelet techniques are employed to investigate time-frequency and frequency-dependent nexus in the Ghanaian context. In terms of time-frequency, a mix of negative and positive bi-causality among commodities, banking sector performance indicators, and macroeconomic indicators are found. Outcomes from the wavelet multipleprovide that these variables are highly integrated, with the exchange rate leading in the long-run. Hence, implying that exchange rate in Ghana has a high susceptibility to shocks before the other variables in the study. We advocate Government of Ghana and policy-makers should fine-tune policies that take into account the impact on other economic factors. Policies should be initiated to minimise fluctuations in the exchange rate. To limit the adverse impact of inflation and GEPU, it is required that effective and efficient country-level policies geared towards stability be initiated to resuscitate the economy.
1. Introduction
Traditionally, financial systems allow the exchange of contracts and rendering of services in order to make economic agents’ income and consumption streams less comparable (Abaidoo et al., Citation2021; Akosah et al., Citation2018; Magill & Quinzii, Citation2002). In terms of size, timing, and duration of loans, as well as the liquidity characteristics of instruments, financial institutions should, to a significant degree, provide varied instruments to suit the differing demands of savers and borrowers (Alnaa & Matey, Citation2021). To put it differently, the units that make up the financial system should strive to meet the various funding demands of different economic agents (Alnaa & Matey, Citation2021; Schackmann-Fallis et al., Citation2018). Along this line of thinking, governments, policy-makers, and firms must respond to adverse fluctuations in the banking sector performance indicators for agents to smooth their consumption while investing in the financial system towards the future.
Narrowing into the banking sector of Ghana which is pregnant with severe banking crisis between August 2017 and January 2020 after the 2007–2009 Global Financial Crisis, most individuals felt reluctant to invest in the financial system of Ghana. This is not daunting because individuals would want to have streams of income to smooth their consumption (”Bank of Ghana Banking Sector Report,” Citation2020). Categorially, the economic effect of the 2007–2009 Global Financial Crisis, the Arab Spring in North Africa in 2010, bad corporate governance, non-performing loans, and credit risk, among others, put the majority of banks in Ghana at risk of defaulting on their loans.
In addition, in 2018 and 2019, the Bank of Ghana permitted most native banks to be absorbed by other companies due to insolvency and failure to meet minimum capital requirements (Alnaa & Matey, Citation2021; Owusu & Alhassan, Citation2021). A period after, adverse shocks on the financial system of Ghana increased when the COVID-19 pandemic reached Ghana in the early parts of 2020 (Asafo-Adjei et al., Citation2020; Dickson & Yao, Citation2020). It becomes blatant that indicators of banking sector financial soundness are frequently assessed across time and frequencies to reveal the extent of discrepancies occasioned by severe macroeconomic shocks to induce policy and investment decisions. Accordingly, the Bank of Ghana periodically provides some indicators measuring the banking sector financial soundness in Ghana regarding banks’ health and progress. To measure banking sector financial indicators, available statistics from the Bank of Ghana economic database show five key variables of interest—asset quality, earnings, liquidity, capital adequacy, and the degree of responsiveness to market risk (”Bank of Ghana Banking Sector Report,” Citation2020).
It can be noticed that there are high volatility trends in the Banking Sector (Obuobi et al., Citation2019). These measures can be represented as return on assets, return on equity, capital adequacy ratio, nonperforming loan ratio, core liquid assets to total assets, and many more as provided by the Bank of Ghana. It is established that weaknesses in these indicators related immensely to the collapse of most banks which negatively affected economic activities (”Bank of Ghana Banking Sector Report,” Citation2020). Although within the third month of 2007 to the third month of 2021, return on assets has seen an increment from 4.16% to 4.70%. Capital adequacy, on the other hand, increased from 16.87% to 21% which is significantly beyond the Basel II/III framework’s regulation prudential limit of 13 percent. Similarly, non-performing loans ratio saw a huge increase from 6.93% to 15.50% but sharp decline afterward due to recoveries, write-offs, and pickup in credit growth. Moreover, core liquid assets to total assets has also augmented significantly in these periods, yet return on equity saw a decrease from 26.90% to 22.40%.
Corollary to the influence of crises on the banking sector, Ghana is blessed with commodities such as gold (precious metal), oil (energy), and cocoa (food), among others that account for 80% of export revenues. This contributes to the development of economic activities of the country which encourages trade and investment into the financial system (Boateng, Asafo-Adjei, Addison et al., Citation2022). Ghana’s gold production before 2020 was higher than South Africa and Ghana is second to its neighbour, Ivory Coast the largest producer of cocoa. Yet in 2019, a press briefing from Ghana’s Ministry of Finance emphasised that Ghana keeps discovering new oil fields which will increase the quantity of oil and gas exploration and production. From the archives of commodities pricing, gold has increased from US$ 655.22 per fine ounce in the third month of 2007 to US$ 1,722.49 per fine ounce in the third month of 2021, Brent crude oil has also increased on average from US$ 62.36 per barrel to US$ 65.84 per barrel over the same period and final cocoa also saw increased on average from US$ 1,481.22 per tonne to US$ 2,520.78 per barrel over the same period. These indicators show that fluctuations in commodity prices may have some interdependencies with the banking sector financial indicators (T. Kinda et al., Citation2018; M. T. Kinda et al., Citation2016) since they both contribute to economic activities. For instance, increases in the crude oil price (Abdulkarim et al., Citation2020; Asafo-Adjei, Adam et al., Citation2021; Reboredo & Ugolini, Citation2016) will result in inflationary pressures which is controlled by higher interest rates, which in turn affect the financial performance of banks either positively or negatively.
The study’s theoretical foundations are entrenched in theories of instability postulated by the monetarists’ view represented in the works of Friedman & Schwartz, Citation1963), the post-Keynesian financial instability hypothesis provided by Minsky (Citation1970, Citation1977), and Borio and Drehmann (Citation2011); Borio (Citation2014)) despite the conflicting views. Notions from these theories provide that in a complex system, commodity price volatility has real impact through the financial channel, as they influence financial position and performance of banks, which interacts with several macroeconomic conditions (Agarwal et al., Citation2020; Eberhardt & Presbitero, Citation2021).
Prior studies on the banking sector financial indicators which mostly focus on macroeconomic variables are replete. Studies have also been conducted on nexus between commodities prices and banking sector financial indicators (Abaidoo et al., Citation2021; Flori et al., Citation2021; T. Kinda et al., Citation2018; Mupunga & Ngundu, Citation2020; Shahbaz et al., Citation2019). However, these studies’ emphasis were mostly on developed economies, but they do not quantify the possible impact of general macroeconomic conditions on the nexus. Our work is similar to the study by Boateng, Asafo-Adjei, Addison et al. (Citation2022). However, they examined interdependencies between commodities, and further considered the partial influence of relevant macroeconomic indicators such as the real sector of Ghana and GEPU on the commodities’ nexus. They do not assess independencies between commodities and the banking sector financial indicators, and further exclude an important economic indicator such as the exchange rate which is also relevant for empirical discourse.
Accordingly, studies are silent on the partial impact of general macroeconomic shocks as a common interdependence on the commodity-banking sector financial indicator nexus. This suggests that commodities prices and banking sector performance indicators nexus is nascent and fledgling in the empirical literature, especially in the context of developing economies such as Ghana. Commodity exportation in Ghana is a delicate matter as it is known for vast volatility and making revenues from such exports more susceptible to shocks (Boateng, Asafo-Adjei, Addison et al., Citation2022). Intuitively, a positive relationship between the commodities and the banking sector financial indicators is expected since they both contribute to economic activities, but at diverse horizons, macroeconomic variables may distort the directional flow of the aforesaid nexus.
Building on the limited empirical findings, the paper deals with the interconnectedness between commodity prices, the banking sector indicators of Ghana, inflation, and exchange rate amidst external uncertainty shocks. It is believed that shedding light in this direction would aid in investment decisions as well as guidance for the banking sector. For instance, investors can draw knowledge from the comovements between commodities prices and banking sector indicators as well as the partial impact of inflation and exchange rate with regards to diversification and hedging potentials (Owusu Junior et al., Citation2018). Moreover, since the Ghanaian financial sector experienced huge blows as a result of a downward surge of the banking sector financial indicators which affected the national income, the empirical results are expected to provide insights into the delayed volatility of market competitiveness and external shocks (DVMCES) hypothesis (Asafo-Adjei, Frimpong et al., Citation2022) in a time-frequency perspective.
For a time-frequency analysis, specifically wavelet, we break down the time series data of commodities prices and banking sector financial indicators into the spectral purview, allowing investors and policy-makers to make informed economic decisions (Hung, Citation2020). One of the most popular methods for locating the power variation in time-series data is wavelet analysis, which enables researchers to comprehend the main types of variability as well as how they change as a result of decomposition (Hung, Citation2022b; Nkrumah-Boadu et al., Citation2022). Specifically, the bi-wavelet, wavelet multiple, and partial wavelet were specifically adopted in this study. Through the bi-wavelet, the paper decoded the scope of unidirectional or bi-causality relationship. The partial wavelet technique opines the degree of distortion in the comovement of two time-frequency domain variables from a common interdependence (which is this case, general macroeconomic conditions). On the other hand, the wavelet multiple techniques (wavelet multiple correlation (WMC) and wavelet multiple cross-correlations (WMCC)) display the degree of interdependence among several variables simultaneously to present a complete view of the nexus (Agyei, Adam et al., Citation2022; Agyei, Bossman et al., Citation2022; Asafo-Adjei, Adam, Hamidu et al., Citation2022; Bossman, Adam et al., Citation2022).
This study enjoins three important contributions regarding the economy of Ghana and the general finance and economic literature. First, we investigate the interconnectedness between commodities prices and banking sector financial soundness indicators in the light of serious economic events such as the 2008 financial crisis, Eurozone crisis, financial sector clean-up exercise in Ghana, the COVID19 pandemic, etc. The banking sector financial soundness indicators highlight the performance of the financial sector and it is timely in these seasons. Also, Ghana is an export-driven country, therefore information on the comovements between commodity prices and the banking sector financial indicators is needed.
Second, since the comovements between commodities prices and banking sector financial soundness do not operate in a vacuum, we assess the partial influence of general macroeconomic indicators on the nexus between commodity prices and the banking sector financial soundness measures. The general macroeconomic variables employed in this study are exchange rate, inflation and GEPU. Third, to provide a full picture of the nexus, we examine the degree of integration among all the variables simultaneously to further determine possible lead or lag across intrinsic times detailing investment horizons of short-, medium-, and long-terms for investment and policy decisions. This study adds to the literature, and also the first to enlighten policy-makers as well as investors on the time-varying relationship among commodity prices, the banking sector financial indicators, inflation, exchange rate, and GEPU.
The bi-wavelet results showed positive comovements between Cocoa and most of the banking sector financial indicators such as CAR, ROE, and ROA, in the medium-term between 2007 and 2009. Beyond this period, we noticed negative comovements between Cocoa and these banking sector financial indicators in the medium, and long terms before 2016. Also, we found a direct link between the performance of the crude oil market and the performance of the banking sector at severe economic shocks to experience a surge. Findings from the partial wavelet technique divulged that GEPU, followed by inflation has a significant effect on the comovements amid commodities and banking sector financial indicators. On the other hand, the wavelet multiple results implied that exchange rate has a long-run ramification on commodities, banking sector financial indicators, and other macroeconomic variables (GEPU and Inflation).
The next part of the paper is organised as follows: Section 2 presents the theoretical review, methods for conducting the study are presented in section 3. The fourth section presents the empirical analysis; conclusions of the study are captured in the fifth.
2. Literature review
The theoretical grounds for this study are rooted in theories of instability postulated by the monetarists’ view represented in the works of Friedman & Schwartz, Citation1963), the post-Keynesian financial instability hypothesis provided by Minsky (Citation1970, Citation1977), and Borio and Drehmann (Citation2011); Borio (Citation2014)). While Borio and Drehmann posited that capital inflows (i.e., sell of commodities in the international market) are important indicators of financial instability in developing markets, the monetarists aver that increased capital inflows in the presence of high inflation will lead to a decrease in foreign exchange reserves (Friedman & Schwartz Citation1963). Contrarily, post-Keynesians presented that capital inflows has a positive relationship with foreign exchange reserves which subsequently lead to credit expansions according to Minsky (Citation1970). The corrective action suggested by the monetarist’s expansionary monetary policy from the central bank will lead to increased interest rates which results a severe drop in the money market’s liquidity. On the other hand, the post-Keynesians postulated that excessive credit expansions decrease credit and asset prices when the interest of foreign-dominated debts exceed the cash inflows.
In this regard, the channel through which commodity price fluctuations can influence the real economy is through the impact on a financial channel (Eberhardt & Presbitero, Citation2021). Shocks in commodity price have a high potential to drive financial instability and crises in banks when there is a surge in information asymmetry, pressure in the public sector, a surge in deposit withdrawals, and when governments cut short their severing debt maturity or reduce their revenues (Bosio et al., Citation2021; Eberhardt & Presbitero, Citation2021), etc. For instance, commodity price fluctuations heighten asymmetric information which hinders the ability to separate good borrowers from bad ones. Also, plummeting of commodity prices lessens revenues generated from exports by firms, and creates difficulty for these firms to honour their debt obligations. This eventually translates to negative impact on bank asset quality.
Analogously, the public sector faces intense pressure when there is a drop in prices, to escalate arrears to actors of the supply chain and contractors which eventually diminishes financial position of banks (Bosio et al., Citation2021). Moreover, a fall in commodity price can reduce government revenues, especially in development economies like Ghana with a concentrated export base. A survey by Eberhardt and Presbitero (Citation2021) provided that two-thirds of banking crises contagion in low-income economies occurred when commodity price shock was greater than its short-run normal. The reduction in government revenues can increase the appetite for issuance of public debt which drives the exposure of banks to sovereign risks through hostile interference and moral suasion (Eberhardt & Presbitero, Citation2021; Ongena et al., Citation2019).
The long-run negative shocks in commodity prices drive precipitous deposit withdrawals by individuals and institutional investors (and even government to finance budget deficits), which ultimately plummets bank funding and liquidity. Thus, the statement of financial position as well as performance of banks weakens when volatility in commodity prices thrives in a going concern in the midst of surges in other general macroeconomic conditions. The transmission mechanism indicated above illustrates the relevance of utilizing the following economic indicators. They include; three commodities (cocoa, crude, and gold), five banking sector financial indicators (Capital Adequacy Ratio (CAR), Non-Performing Loans (NPL), Return on Equity (ROE), Return on Assets (ROA), and Core Liquid assets to total assets (CLATA)), and three general macroeconomic indicators (Inflation, GEPU, and Exchange rate). Accordingly, the selected variables are significant in capturing the research problem in line with theoretical arguments better.
A recent study by Jeris and Nath (Citation2021) explored the determinants of US bank indices by utilizing the wavelet approach. It was found that the US banks were vulnerable to COVID-19 cases, crude oil prices, economic policy uncertainty, and market volatility during the pandemic. Bilgin et al. (Citation2021) investigated the asymmetric influence of economic uncertainty on default risk of both conventional and Islamic banks. It was found that default risk of both conventional banks are largely susceptible to economic uncertainty relative to Islamic banks. In Ghana, Idun et al. (Citation2022) revealed high integration between the indicators of the Ghana stock exchange returns and banking sector financial soundness measures relative to interest rate measures.
Moreover, Boateng, Asafo-Adjei, Addison et al. (Citation2022) examined interconnectedness between commodities returns in Ghana and revealed that the partial effect of GEPU is crucial in the nexus of the commodities, especially, during crises. However, the comovements between commodity price returns and banking sector financial soundness indicators while considering the partial impact of general macroeconomic conditions as a common interdependence in a time-frequency domain are missing in literature. Very little can also be said about the possible interactions among commodities, banking sector financial soundness indicators, and general macroeconomic variables simultaneously at diverse frequencies. As a result, we seek to answer the following research questions;
i. What is the comovements between commodity returns and banking sector financial soundness indicators across time and frequency?
ii. What is the partial influence of general macroeconomic variables on the interconnectedness between commodity returns and banking sector financial soundness indicators across time and frequency?
iii. What is the degree of integration among commodity returns, banking sector financial soundness indicators and general macroeconomic variables across investment horizons?
The first, second, and third research questions would be answered using the bi-wavelet, partial wavelet, and wavelet multiple approaches respectively.
3. Methodology
The paper shared light on the time-frequency a link between commodities and banking sector financial indicators in the presence of general macroeconomic variables in Ghana by adopting the wavelet techniques specifically bi-wavelet, partial wavelet, and wavelet multiple. They are principally used in the paper to analyze the comovements in time and frequency, lead/lag relationships as well as asymmetric relationships of the study variables. In the sub-sections, we highlighted the data sources and description and specific members of the wavelet techniques employed in the paper.
3.1. Data sources and description
We utilize monthly data which includes—three commodities (Cocoa, crude, and gold). Also, five banking sector financial indicators which are—Capital Adequacy Ratio (CAR), Non-Performing Loans (NPL), Return on Equity (ROE), Return on Assets (ROA), and Core Liquid assets to total assets (CLATA), and three general macroeconomic indicators (Inflation, GEPU, and Exchange rate). The monthly data span from January 2007 to March 2021, with 165 observations. The monthly data cover serious events such as the 2008 Global Financial Crisis, Eurozone crises, and COVID-19. Except for GEPU, the other data were gleaned from the Bank of Ghana economic database. Data on GEPU were retrieved from the website developed by Baker, et al (Citation2016) https://www.policyuncertainty.com/index.html. We utilize monthly returns as—, where
is the logarithmic returns,
(present index) and
(preceding index).
3.2. Descriptive statistics
The log-returns and time-varying prices of commodities, banking sector financial indicator, exchange rate, inflation and GEPU are shown in Figure . Except for gold prices, the prices of commodities move upwards in the early part of 2020 after a negative spike, as can be seen from the price series. Cocoa, crude oil, and gold have all experienced significant fluctuations, particularly between 2008 and 2012, and 2015 and 2020. The financial crisis and the Eurozone crisis are to blame for the declining in prices of commodities from 2008 to 2013. Crude oil prices have been trending downward since 2014, and this may be ascribed to the greatest prices drop in crude oil in history (see Asafo-Adjei, Adam et al., Citation2021).
Figure 1. Plots of prices and returns series.
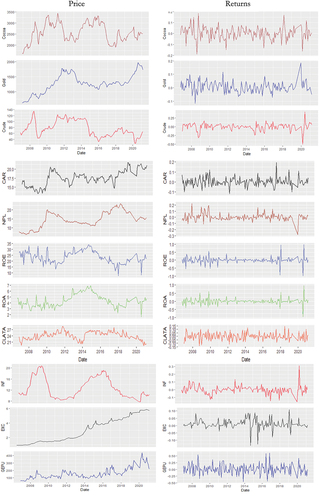
Beyond 2019, the price of gold is expected to rise, indicating an increase in gold’s worth and demand throughout the COVID-19 pandemic. Consequently, gold is anticipated to serve as a haven for a large number of assets that suffered losses as a result of the COVID-19 outbreak. At that time, GEPU and exchange rate is on the rise. This may require further investigations by researchers. Banking sector financial indicators indices in the banking sector have been trending upwards and downwards over time, with ROA and ROE indicating similar behavior. It is also possible to see commonalities in trends between the inflation and exchange rate plots, which would be worth further investigation. Figure demonstrates volatility clustering by displaying how the log-returns series represent the stylised facts of asset returns.
Table presents the descriptive statistics on the major variables used for analysis concerning the Commodities, Banking sector financial indicators, and general macroeconomic indicators. The negative mean returns indicate less performance whilst the positive returns of the commodities depict high tendencies to withstand shocks. It can be seen that there is less variation within the variables as shown by the standard deviation concentrating around 0.1. The negative skewness suggests that there is a likelihood for lower returns in a going concern. Also, it can be observed from the Jarque-Bera statistic that all the series are not normally distributed.
Table 1. Preliminary statistics
3.3. Bi-wavelet
Bi-wavelet showed the nexus between commodities (gold, cocoa, and crude oil prices) and banking sector financial indicators (return on assets, return on equity, capital adequacy ratio, non-performing loans, and core-liquid assets to total assets) from time-frequency setting.
The continuous wavelet transform (CWT) was the main focus of the paper because it provides a superior extraction benefit (Pal & Mitra, Citation2019). Since every frequency is used in operation and the shifting of the wavelet function is a continuous process, the CWT ensures that time series are broken down into simpler functions that are easier to understand. A mother wavelet decomposition for a time series (t), can be written in Equationequation 1(1)
(1) as
where t shows location or time depicting the specific place or time of the wavelet and scale dilation component identified as s tells the stretched nature of the wavelet, is a complex conjugate in the function of the mother wavelet. Regarding the selected time-series variables and restricting it to the particular features of
our end is
.
Torrence and Compo (Citation1998) define wavelet transformation coherence (WTC) as the squared value normalization of a cross-absolute spectrum to a single wavelet power spectrum. EquationEquation 2(2)
(2) denotes the equation for the squared wavelet coefficient.
where p is a smoothing factor used to stabilities resolution as well as significance, and squared wavelet coefficient ranges between 0 and 1; .
The closer a number to 0 the weaker the association, whereas a number closer to 1 highlights a significant nexus. The WTC exhibits a thorough connection between the time series variables in the time-frequency domain. A stronger comovement is indicated by a brighter color in the results. Given that it is challenging to determine the theoretical distribution of the cross wavelet transform coefficient, the Monte Carlo approach was developed to examine the statistical significance of this nexus (Torrence and Compo, Citation1998).
The WTC Phase difference demonstrates the oscillation interruptions in a particular time series. EquationEquation 3(3)
(3) takes advice from Bloomfield et al. (Citation2004) and takes into account the phase difference between (t) and (t).
and ℜ used in Equationequation 3(3)
(3) demonstrate imaginary operators and real operators correspondingly. The wavelet coherence difference is highlighted as a source of guidance by the phase pattern dimension on the wavelet coherence map. Gouhier (Citation2013) provided the statistical clarifications and analytic codes. Dimensional arrows are used to distinguish phase patterns. Arrows that are pointing right, left, upward, or downward are used to illustrate their findings in a visual format. Right arrows pointing upward and left arrows pointing downward identify the first variable, and left arrows pointing upward and right arrows pointing downward, respectively. The connection between the linked variables is represented by a color scheme and a surface color. Red (warm) color indicates regions with large comovements, whereas blue (cold) color indicates portions with little comovements.
3.4. Partial wavelet coherence (PWC)
The PWC is used in literature to regulate the impact of time series variable z(t) on the wavelet coherence between other two time series variables x(t) and y(t), as well as to reduce the problem of “pure” correlation between time-series variables (Wu et al., Citation2020). EquationEquation 4(4)
(4) illustrates how the partial correlation squared and the PWC are related
where is between 0 and 1. We employ x and y respectively as commodity price returns and banking sector financial indicators returns while z denotes the general macroeconomic variables of Ghana.
3.5. Wavelet multiple
Let follows a multivariate stochastic process and let
be a resultant scale
.
Fitted values of zt from a theory of regression is zt, therefore the wavelet multiple correlation (WMC) is in EquationEq. (5(5)
(5) )
where is used to capitalize on
represents the fitted values in the regression of
on the outstanding wavelet coefficients at scale
.
The wavelet multiple cross-correlation (WMCC) is obtained by allowing a lag r amid fitted values observable at scale λf as in Equationequation 6:(6)
(6)
where for n = 2, WMCC and WMC unite with the cross-correlation and standard wavelet correlation.
To calculate WMCC and WMC let be the recognition of the multivariate stochastic process
for
. MODWT of order J is linked to individual univariate time series {{
,
}, for
, the
vectors of coefficients of MODWT
is obtained.
A nonlinear function of all wavelet correlations of scale λf and a steady estimator of wavelet correlation from the MODWT is shown in Equationequation 7:
(7)
(7)
where
the regression of the equivalent set of regressors
optimize the R2,
denotes meeting the requirements fitted values, and
shows the number of wavelet coefficients impacted by the boundary constraints associated with a length wavelet filter
and scale
but
shows the number of wavelet coefficients that are not influenced by boundary conditions.
An appropriate equation for the WMCC is presented as
For simplicity’s sake, Fernández-Macho (Citation2012) calculates the confidence interval (CI) of WMC using the transformation arctan ℎ(г), where arctan ℎ(.) is the inverse hyperbolic tangent function (Tweneboah, 2019). The same realization of x used in the calculation of WMC and WMCC served as the basis for the estimation of the confidence interval (see Fernández-Macho (Citation2012) for an extensive presentation of WMC and WMCC).
4. Results and discussion
The analysis of this study is achieved with the aid of wavelet techniques. To investigate both the time and frequency dimensions of the variables, the partial wavelet, and bi-wavelet techniques are utilized. The wavelet multiple techniques are further considered to account for the frequency dimension. The paper followed Boateng, Asafo-Adjei, Addison et al. (Citation2022) to set the wavelet factors to , because the paper utilized monthly data. The wavelet factors related to periods of months with, 2 months through to 4 months as short-term, 4 months through to 16 months as medium-term and anything above 16 months to be long-term respectively.
4.1. Time-frequency domain
Figure shows the results for the partial wavelet and bi-wavelet. The bi-wavelet analyses consider the nexus in terms of lead/lag between prices of commodities and banking sector financial indicators in a time-frequency perspective, while partial wavelet analyses consider the effect of a common interdependence (general economic indicators) on the relationship between prices of commodities and banking sector financial indicators.
Figure 2. Comovements between commodities and the macroeconomic variables.
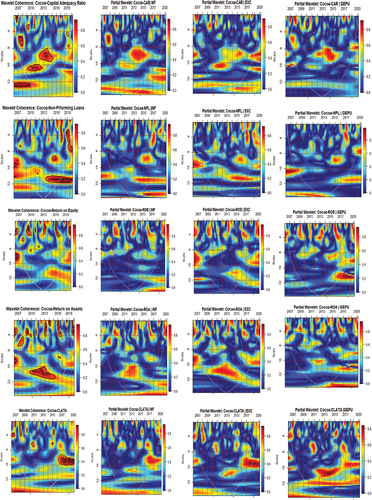
Figure 2. Continued.
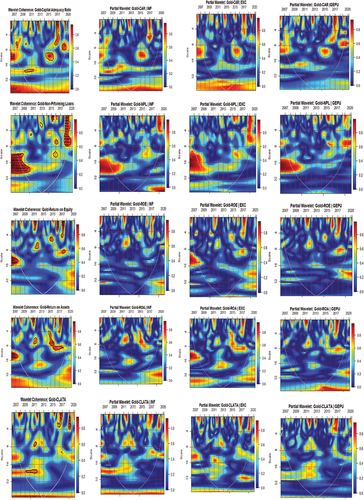
Figure 2. Continued.
From Figure , in the bi-wavelet case, we noticed positive comovements between Cocoa and most of the banking sector financial indicators such as CAR, ROE, and ROA, in the medium-term between 2007 and 2009. This may be partly ascribed to the 2008 Global Financial Crisis which distorted most economic activities around the world. This induced the fluctuations of world prices of exports which impact on spending, national income, and investments significantly (Blattman et al., Citation2007; Deaton & Miller, Citation1995). The outcome from this study is similar to the findings of Idun et al. (Citation2022) when banking sector financial soundness exhibited significant positive comovements with the indicators of the Ghana stock exchange returns.
Nonetheless during this period Cocoa partly contributed positively to improving the financial indicators of these banks. Thus, this finding underscores that the 2008 Global Financial Crisis had a limited or inconsequential impact on most economies, including Ghana? This remains a debate that needs to be well accentuated. Beyond this period, we notice negative comovements between Cocoa and these banking sector indicators in the medium- and long terms before 2016. That is after some time, where the global economy has become saturated with the impact of the crisis, these banking sector financial indicators transmit negative shocks to Cocoa, suggesting a decline or fluctuation in prices. Accordingly, this is partly a result of the delayed volatility of market competitiveness and external shocks (DVMCES) hypothesis proposed by Asafo-Adjei, Frimpong et al. (Citation2022), in the aftermath of the crisis.
The outcome on gold is synonymous with Cocoa, but with some additional remarkable findings. The comovements between gold and the banking sector financial indicators are high. Although the directional comovements between gold and CAR cannot be determined, the remaining banking indicators depict positive and negative comovements with gold during the Global Financial Crisis and COVID-19 pandemic respectively. During the COVID-19, a similar outcome could not be found for Cocoa as discussed earlier because, Cocoa was a less dominant trading commodity during this period based on exported value, and as such, expected to experience relatively fewer trading shocks emanating from the pandemic. Accordingly, as of 2019, Ghana’s major exports from least to the highest were cocoa paste ($504 million), cocoa beans ($1.61 billion) followed by crude petroleum ($4.68 billion), and gold ($10.8 billion) (see, Boateng, Asafo-Adjei, Addison et al., Citation2022; Simoes & Hidalgo, Citation2011). We document negative comovements between gold and banking sector financial indicators in the short, and medium-term of the COVID-19 pandemic. The adverse effect of the COVID-19 pandemic could not extend to the long-term since most economies have learned how to survive and, most economic activities have now become saturated hindering shocks from the Pandemic.
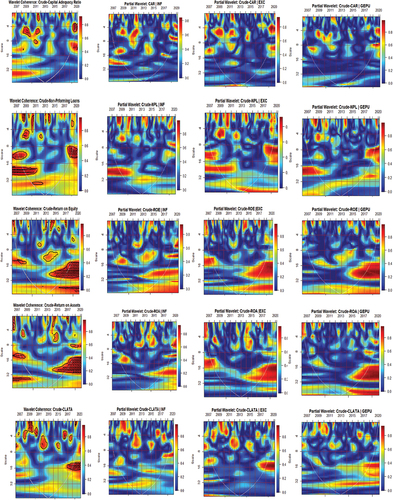
Contrarily, comovements between crude oil and the banking sector indicators are mostly positive with the Crude oil acting as driver, leading most of the relationships at both the 2008 crisis and the COVID-19 pandemic. This highlights the significant impact of Crude oil on the development of world economies (Abdulkarim et al., Citation2020; Asafo-Adjei, Adam et al., Citation2021; Hung & Vo, Citation2022; Reboredo & Ugolini, Citation2016), and its possible impact on inflation, fiscal policy, monetary policy, and interest rate (Olomola & Adejumo, Citation2006; Ratti & Vespignani, Citation2016). Our study is consistent with the outcome of Uribe and Schmitt-Grohé (Citation2015), who found that commodity prices are significant drivers of economic aggregates.
Theoretically, fluctuation in crude oil prices influences the earnings of companies through the dividend discount model and depending on whether the company is a net-oil producer or consumer. For banks, the impact of fluctuations in crude oil prices may be felt through inflationary pressures partly mitigated by the high-interest rate which plummets firm value through the dividend discount model. Notwithstanding, we find that during uncertainties, the performance of the crude oil market is directly linked to the performance of the banking sector to experience a surge. This outcome is similar to the findings of Hung (Citation2022a), who revealed positive comovements between energy consumption and economic growth in BRICS countries. Consequently, the crude market and the banking industry (from a full reflection of the soundness measures in stock prices) do not act as a potential haven during uncertainties.
Due to the rapid fluctuations in macroeconomic variables, especially in times of uncertainties, we control for the possible impact of general macroeconomic indicators which are not specific to a single industry on the comovements between commodities and the banking sector financial indicators. This is executed through the partial wavelet technique. In most cases, it can be noticed that GEPU, followed by inflation impact on the comovements between prices of commodities and banking sector financial indicators significantly which is synonymous to the outcome of Jeris and Nath (Citation2021). This confirms the adverse impact of GEPU (Asafo-Adjei et al., Citation2020; Boateng, Asafo-Adjei, Addison et al., Citation2022; Asafo-Adjei, Boateng et al., Citation2021) and inflation (Boateng, Asafo-Adjei, Addison et al., Citation2022) on most economic activities. Also, Hung (Citation2021) confirmed the pass-through effect of EPU on stock returns of BRICS. On the other hand, since the performance of the exchange rate is directly linked to the performance of the net export-dependent economy, Ghana, with mostly positive net-import, would have minimal impact of its exchange rate on economic activities.
4.2. Frequency-dependent approach
4.2.1. Wavelet bivariate correlations matrix
The bivariate contemporary correlations (BCC) are studied at four wavelet scales, as shown in Figure ). The horizontal axis indicates the potential choices for generating wavelet correlation coefficients. The similarities between the pairings weaken as we move from left to right. The wavelet scales on the vertical axis represent periods. The bivariate contemporaneous correlation matrix examines the relationship between the realizations of two possible time series combinations during the same era (Asafo-Adjei, Adam et al., Citation2021; Boateng, Asafo-Adjei, Addison et al., Citation2022).
Figure 3. Wavelet bivariate correlations matrix.
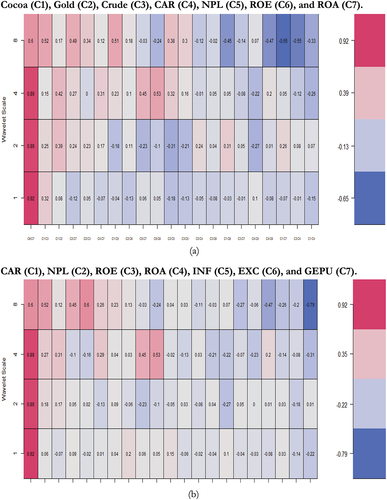
Figure 3. Continued.
The results show a mix of positive and negative connection amid the pairs noticed in Figures . The comovements between ROA and ROE are very strong in the long-, medium-, and short-terms. Cocoa depicts positive comovements with crude oil and gold which is in line with the study of Boateng, Asafo-Adjei, Addison et al. (Citation2022). Crude oil and gold are positively related except in the short term between 2 and 4 months. Generally, we notice that the comovements between banking sector financial indicators are negative except that of ROA and ROE (see Figures ) as found by Idun et al. (Citation2022). CAR and NPL demonstrate negative comovements with EXC and GEPU, but positive with INF. It can be seen that fluctuation in the exchange rate is not favorable for ROA, and probably ROE in the short-, medium, and long-terms (see Figure ). Also, comovements between commodities and inflation as well as GEPU are mostly negative throughout the wavelet scales (see Figure ).
4.2.2. Wavelet multiple correlations (WMC)
WMC for commodities, banking sector financial indicators, and general macroeconomic factors into frequency localisation by the MODWT (Fernández-Macho, Citation2012) are discussed below. It shows the degree of interdependence between the variables without revealing leading or trailing variables (see Hamidu et al., Citation2022; Boateng, Asafo-Adjei, Addison et al., Citation2022; Owusu Junior et al., Citation2021, etc.).
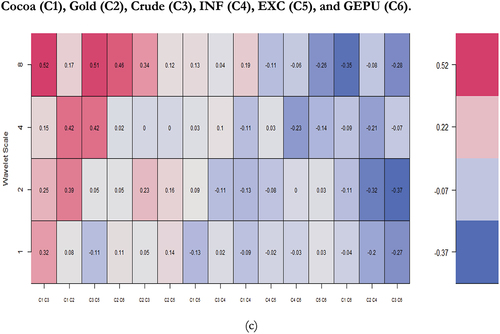
Figure and Table found the degree of integration amongst the prices of commodities, banking sector financial indicators, and general macroeconomic drivers over diverse horizons (short, medium-, and long-terms) in a incessant way. For the monthly return series, the degree of integration is relatively high, reaching around 0.9635 for the WMC, 0.8486 for the lower panel, and 0.9916 for the upper panel. The high integration among the variables partly agrees with the outcome of Boateng, Asafo-Adjei, Addison et al. (Citation2022) and Idun et al. (Citation2022), although similar, but not the same, variables were employed. This implies that macroeconomic indicators in Ghanaian economy are highly integrated. As a result, investors, policy-makers, portfolio managers, to name a few, should be concerned about contagion effects among the selected variables which could occasion a fall in several other indicators during chaotic economic conditions. This highlights the sensitivity of the macroeconomic indicators in Ghana. Over the horizon, there is an unbroken swell in the WMC. Thus, monthly data of one variable can be justified to a degree of roughly 96 percent from monthly by the remaining variables, leading to scale 16 months’ dependency.
Figure 4. Wavelet multiple correlations among commodities, banking sector financial indicators, and general economic indicators. U-upper limits, L- lower (at 95% confidence interval).
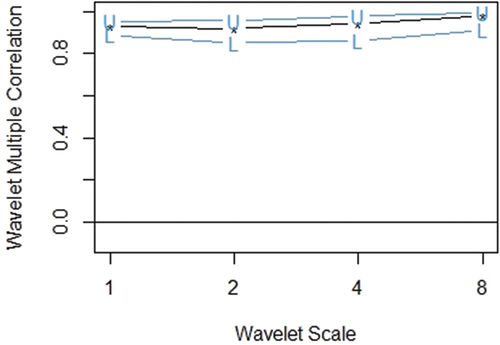
Table 2. Wavelet multiple correlations (WMC)
4.2.3. Wavelet multiple cross correlations (WMCC)
Table depicts WMCC for four wavelet scales. The scales on the y-axis in Figure have identical connotations to those mentioned before in the wavelet multiple analysis discussion. The x-axis, according to Asafo-Adjei, Adam et al. (Citation2021) and Asafo-Adjei, Adam, Idun & Ametepi (Citation2022), depicts the series’ lag length. In this situation, the positive and negative lags are separated by 12 months. At the corresponding scales, positive lag denotes a lagging variable, whereas negative lag denotes a leading variable. There is no lead or lag at the zero-lag of localization. Localization refers to the maximum values in the linear combination of all variables at the wavelet scales, which are illustrated by dashed lines within the dotted lines (at all lags). When a variable is listed on a scale, it has the potential to lead or lag all other variables. It signifies that in the linear combination of all the variables at the relevant scales at that scale, it has the largest value. Economic ramifications, the most important variable at a certain wavelet scale, are determined to serve as either a leading (first mover to respond to shocks) or a trailing (last variable to respond to shocks after the other variables) variable, and it reveals the degree of interdependence between the variables. (Asafo-Adjei, Adam et al., Citation2021; Boateng, Asafo-Adjei, Addison et al., Citation2022).
Figure 5. Wavelet multiple cross-correlations among Commodities, Banking sector financial indicators, and general economic indicators.
Table 3. Wavelet multiple cross correlations (WMCC)
Some banking sector financial metrics (ROE and ROA) have the potential to lead or lag over 2–16 months, as shown in Figure (Table ). After 16 months, the exchange rate maximises the various cross-correlations of the remaining variables using a linear combination. As a result, at this point, the exchange rate is ahead of the relationship. This implies that the exchange rate has a long-term effect on the commodities, banking sector financial indicators, and other macroeconomic variables (GEPU and Inflation). Thus, the exchange rate is the first variable to respond to shocks in light of external shocks, inflation, and fluctuations in commodities. This partly explains the vulnerability of the Ghanaian cedi against the US dollars, considering shocks emanating from the external environment as well as domestic shocks (Katusiime, Citation2019; Owusu Junior et al., Citation2018).
5. Conclusion
An investigation into the interconnectedness between important trading commodities and macroeconomic variables is provided in this study. The investigations are provided for both time and/or frequency domains. Hence, the wavelet techniques are explored—bi-wavelet, partial wavelet, and wavelet multiple. Specifically, we employed the bi-wavelet to examine the comovements between three commodities and banking sector financial indicators. The partial wavelet was utilized to ascertain the contribution of general economic indicators on the comovements in the bi-wavelet case. Lastly, the wavelet multiple enabled us to assess the frequency distribution of the variables simultaneously for interdependencies or integration purposes. We do this to provide detailed dynamics of commodities, banking sector financial indicators, and general macroeconomic indicators to facilitate effective policy decisions, portfolio, and risk management, as well as provide insights for investors of commodities.
We found positive comovements between Cocoa and most of the banking sector financial indicators such as CAR, ROE, and ROA, in the medium-term between 2007 and 2009. Thus, this finding underscores that the 2008 Global Financial Crisis had a limited or inconsequential impact on most economies, including Ghana. This remains a debate that needs to be well accentuated. Beyond this period, we noticed negative comovements between Cocoa and these banking sector indicators in the medium- and long-terms before 2016. Accordingly, this is partly a result of the delayed volatility of market competitiveness and external shocks (DVMCES) hypothesis proposed by Asafo-Adjei, Frimpong et al. (Citation2022), in the aftermath of the crisis. The outcome on gold is synonymous with Cocoa, but with some additional remarkable findings. Although the directional comovements between gold and CAR were indeterminable, the remaining banking indicators depict positive and negative comovements with gold during the Global Financial Crisis and COVID-19 pandemic respectively. Contrarily, comovements between crude oil and the banking sector indicators are mostly positive with the crude oil acting as driver, leading most of the relationships at both the 2008 crisis and COVID-19. Moreover, from the partial wavelet, in most cases, we found that GEPU, followed by inflation had a significant impact on the nexus between commodities and banking sector financial indicators. This confirms the adverse impact of GEPU (Asafo-Adjei et al., Citation2020; Asafo-Adjei, Boateng et al., Citation2021; Boateng, Asafo-Adjei, Addison et al., Citation2022) and inflation (Boateng, Asafo-Adjei, Addison et al., Citation2022) on most economic activities.
The wavelet multiple techniques revealed strong positive comovements between ROA and ROE and the commodities. On the other hand, comovements between commodities and the general macroeconomic indicators as well as some of the banking sector financial indicators (CAR and NPL) were negative in the short-, medium-, and long-terms. These outcomes were specifically obtained from the BCC. Also, the WMC depicted a very high integration between commodities, banking sector financial indicators, and general economic indicators. This implies formulated policies on one variable have a strong bearing on the remaining variables either positively or negatively with incites from the BCC technique in the short-, medium-, and long-terms. It was further revealed that the exchange rate in Ghana is vulnerable to shocks in the long-term amid commodities, banking sector financial indicators, and general macroeconomic conditions.
We recommend that the Government of Ghana and policy-makers should fine-tune policies that take into account their impact on other economic indicators. Policies should be initiated to revamp fluctuations in the exchange rate. To minimize the adverse impact of inflation and GEPU, it is required that effective and efficient country-level policies geared towards stability are initiated to resuscitate the economy. Accordingly, we reiterate the assertion found in the ”Bank of Ghana Banking Sector Report” (Citation2020) that performance improvement should indeed be associated with recapitalisation and regulatory reforms to ensure the long-term sustainability of banks’ performance.
Further studies can consider similarities and multi-frequency information flows between these variables to provide additional insights into the heterogeneous and adaptive behaviors (Asafo-Adjei, Bossman et al., Citation2022; Asafo-Adjei, Owusu Junior, & Adam, Citation2021; Boateng, Asafo-Adjei, Gatsi et al., Citation2022 Boateng, Owusu Junior et al., Citation2022; Bossman, Agyei et al., Citation2022; Bossman, Umar et al., Citation2022; Owusu Junior et al., Citation2021; Qabhobho et al., Citation2022, etc.) of these economic indicators. Other studies can examine the dynamics of the general macroeconomic indicators or banking sector financial indicators with other financial markets.
Disclosure statement
No potential conflict of interest was reported by the author(s).
Data Availability Statement
The data used this study are attached as supplementary files.
Additional information
Funding
References
- Abaidoo, R., Agyapong, E. K., & Boateng, K. F. (2021). Stability in the banking industry and commodity price volatility: Perspective from developing economies. Journal of Economic and Administrative Sciences. https://doi.org/10.1108/JEAS-05-2021-0089
- Abdulkarim, F. M., Akinlaso, M. I., Hamid, B. A., & Ali, H. S. (2020). The nexus between oil price and Islamic stock markets in Africa: A wavelet and Multivariate-GARCH approach. Borsa Istanbul Review, 20(2), 108–22. https://doi.org/10.1016/j.bir.2019.11.001
- Agarwal, I., Duttagupta, R., & Presbitero, A. F. (2020). Commodity prices and bank lending. Economic Inquiry, 58(2), 953–979. https://doi.org/10.1111/ecin.12836
- Agyei, S. K., Adam, A. M., Bossman, A., Asiamah, O., Owusu Junior, P., Asafo-Adjei, R., & Asafo-Adjei, E. (2022). Does volatility in cryptocurrencies drive the interconnectedness between the cryptocurrencies market? Insights from wavelets. Cogent Economics & Finance, 10(1). https://doi.org/10.1080/23322039.2022.2061682
- Agyei, S. K., Bossman, A., Asafo−adjei, E., Asiamah, O., Adela, V., & And, A. C. (2022). Exchange Rate, COVID-19, and Stock Returns in Africa: Insights from Time-Frequency Domain. Discrete Dynamics in Nature and Society, 1–20. https://doi.org/10.1155/2022/4372808
- Akosah, N., Loloh, F., Lawson, N., & Kumah, C. (2018). Measuring financial stability in Ghana: A new index-based approach. Munich Personal RePEc Archive. https://mpra.ub.uni-muenchen.de/86634/
- Alnaa, S., & Matey, J. (2021). Financial performance of merged and distressed banks in ghana. Journal of International Finance and Economics, 3(3), 35–47. https://doi.org/10.18374/JIFE-21-3.3
- Alnaa, S, and Matey, J. (2021). Performance of merged and distressed banks in Ghana. Journal of International Finance and Economics, 21(3), 35–37. https://doi.org/10.18374/2Fjife-21-3.3
- Asafo-Adjei, E., Adam, A. M., & Darkwa, P. (2021). Can crude oil price returns drive stock returns of oil producing countries in Africa? Evidence from bivariate and multiple wavelet. Macroeconomics and Finance in Emerging Market Economies. https://doi.org/10.1080/17520843.2021.1953864.
- Asafo-Adjei, E., Adam, A. M., Hamidu, Z., Oppong, P. B., & Amoako, G. K. (2022). Risk-synchronisation through the prism of interconnectedness among sustainability equities returns: A regional and global perspective. IJGE, 16(2), 165. https://doi.org/10.1504/IJGE.2022.127911
- Asafo-Adjei, E., Adam, A. M., Idun, A., & Ametepi, P. Y. A. (2022). Dynamic Interdependence of Systematic Risks in Emerging Markets Economies: A Recursive-Based Frequency-Domain Approach. Discrete Dynamics in Nature and Society, 1–19. https://doi.org/10.1155/2022/1139869
- Asafo-Adjei, E., Agyapong, D., Agyei, S. K., Frimpong, S., Djimatey, R., Adam, A. M., & Ma, J. (2020). Economic policy uncertainty and stock returns of Africa: A wavelet coherence analysis. Discrete Dynamics in Nature and Society, 2020, 1–8. https://doi.org/10.1155/2020/8846507
- Asafo-Adjei, E., Boateng, E., Isshaq, Z., A-A, I. A., Owusu Junior, P., & Adam, A. M. A. (2021). Financial sector and economic growth amid external uncertainty shocks: Insights into emerging economies. Plos One, 16(11), e0259303. https://doi.org/10.1371/journal.pone.0259303
- Asafo-Adjei, E., Bossman, A., Boateng, E., Owusu Junior, P., A-A, I. A., Agyei, S. K., Adam, A. M., & Li, Y. (2022). A Nonlinear Approach to Quantifying Investor Fear in Stock Markets of BRIC. Mathematical Problems in Engineering, 1–20. https://doi.org/10.1155/2022/9296973
- Asafo-Adjei, E., Frimpong, S., Owusu Junior, P., Adam, A. M., Boateng, E., & Abosompim R and, O. (2022). Multi-Frequency Information Flows between Global Commodities and Uncertainties: Evidence from COVID-19 Pandemic. Complexity, 1–32. https://doi.org/10.1155/2022/6499876
- Asafo-Adjei, E., Owusu Junior, P., Adam, A. M. . (2021). Information flow between Global Equities and Cryptocurrencies: A VMD-based entropy evaluating shocks from COVID-19 pandemic. Complexity, 2021(2021), 1–25. https://doi.org/10.1155/2021/4753753
- Baker, S. R., Bloom, N., & Davis, S. J. (2016). Measuring Economic Policy Uncertainty*. The Quarterly Journal of Economics, 131(4), 1593–1636. https://doi.org/10.1093/qje/qjw024
- Bank of Ghana banking sector report, 2020
- Bilgin, M. H., Danisman, G. O., Demir, E., & Tarazi, A. (2021). Economic uncertainty and bank stability: Conventional vs. Islamic banking. Journal of Financial Stability, 56, 100911. https://doi.org/10.1016/j.jfs.2021.100911
- Blattman, C., Hwang, J., & Williamson, J. G. (2007). Winners and losers in the commodity lottery: The impact of terms of trade growth and volatility in the Periphery 1870–1939. Journal of Development Economics, 82(1), 156–179. https://doi.org/10.1016/j.jdeveco.2005.09.003
- Bloomfield, D. S., McAteer, R. J., Lites, B. W., Judge, P. G., Mathioudakis, M., & Keenan, F. P. (2004). Wavelet phase coherence analysis: Application to a quiet-sun magnetic element. The Astrophysical Journal, 617(1), 623. https://doi.org/10.1086/425300
- Boateng, E., Asafo-Adjei, E., Addison, A., Quaicoe, S., Yusuf, M. A., Adam, A. M., & Adam, A. M. (2022). Interconnectedness among commodities, the real sector of Ghana and external shocks. Resources Policy, 75, 102511. https://doi.org/10.1016/j.resourpol.2021.102511
- Boateng, E., Asafo-Adjei, E., Gatsi, J. G., Ş C, G., & Simionescu, L. N. (2022). Multifrequency-based non-linear approach to analyzing implied volatility transmission across global financial markets. Oeconomia Copernicana, 13(3), 699–743. https://doi.org/10.24136/oc.2022.021
- Boateng, E., Owusu, J. P., Adam, A. M., Abeka, M. J., Qabhobho, T., Asafo-Adjei, E., & Li, Y. (2022). Quantifying Information Flows among Developed and Emerging Equity Markets. Mathematical Problems in Engineering, 2022, 1–19. https://doi.org/10.1155/2022/2462077
- Borio, C. E. (2014). Monetary policy and financial stability: What role in prevention and recovery? BIS Working Papers No 440. Bank for International Settlements.
- Borio, C., & Drehmann, M. (2011). Financial instability and macroeconomics: Bridging the gulf (pp. 237–268). World Scientific Book Chapters. https://doi.org/10.1142/9789814322096_0017
- Bosio, E., Ramalho, R., & Reinhart, C. M. (2021). The invisible burden: How arrears could unleash a banking crisis. VoxEU. https://cepr.org/voxeu/columns/invisible-burden-how-arrears-could-unleash-banking-crisis
- Bossman, A., Adam, A. M., Owusu Junior, P., & Agyei, S. K. (2022). Assessing interdependence and contagion effects on the bond yield and stock returns nexus in Sub-Saharan Africa: Evidence from wavelet analysis. Scientific African, 16, e01232. https://doi.org/10.1016/j.sciaf.2022.e01232
- Bossman, A., Agyei, S. K., Owusu Junior, P., Agyei, E. A., Akorsu, P. K., Marfo-Yiadom, E., & And, A.A.G. (2022). Flights-to-and-from-Quality with Islamic and Conventional Bonds in the COVID-19 Pandemic Era: ICEEMDAN-Based Transfer Entropy. Complexity, 1–25. https://doi.org/10.1155/2022/1027495
- Bossman, A., Umar, Z., Agyei, S. K., & Owusu Junior, P. (2022). A new ICEEMDAN-based transfer entropy quantifying information flow between real estate and policy uncertainty. Research in Economics, 76(3), 189–205. https://doi.org/10.1016/j.rie.2022.07.002
- Deaton, A., & Miller, R. I. (1995). International commodity prices, macroeconomic performance, and politics in Sub-Saharan Africa International Finance Section, Department of Economics, Princeton University.
- Dickson, R. S., & Yao, D. (2020). The Impact and Opportunities of COVID-19 in Ghana. Open Journal of Social Sciences, 8(10), 71. https://doi.org/10.4236/jss.2020.810006
- Eberhardt, M., & Presbitero, A. F. (2021). Commodity prices and banking crises. Journal of International Economics, 131, 103474. https://doi.org/10.1016/j.jinteco.2021.103474
- Fernández-Macho, J. (2012). Wavelet multiple correlation and cross-correlation: A multiscale analysis of Eurozone stock markets. Physica A: Statistical Mechanics and Its Applications, 391(4), 1097–1104. https://doi.org/10.1016/j.physa.2011.11.002
- Flori, A., Pammolli, F., & Spelta, A. (2021). Commodity prices co-movements and financial stability: A multidimensional visibility nexus with climate conditions. Journal of Financial Stability, 54, 100876. https://doi.org/10.1016/j.jfs.2021.100876
- Friedman, M, and Schwartz, A. J. (1963). Money and Business Cycles. The Review of Economics and Statistics, 45(1), 32–78. https://doi.org/10.2307/1927148
- Gouhier, T. 2013 Biwavelet: Conduct Univariate and Bivariate Wavelet Analyses (Ver 0.14).
- Hamidu, Z., Oppong, P. B., Asafo-Adjei, E., & Adam, A. M. A. (2022). On the Agricultural Commodities Supply Chain Resilience to Disruption: Insights from Financial Analysis. Mathematical Problems in Engineering, 2022, 1–12. https://doi.org/10.1155/2022/9897765
- Hung, N. T. (2020). Volatility spillovers and time-frequency correlations between Chinese and African stock markets. Regional Statistics, 10(2), 63–82. https://doi.org/10.15196/RS100203
- Hung, N. T. (2021). Directional spillover effects between BRICS stock markets and economic policy uncertainty. Asia-Pacific Financial Markets, 28(3), 429–448. https://doi.org/10.1007/s10690-020-09328-y
- Hung, N. T. (2022a). Biomass energy consumption and economic growth: insights from {BRICS} and developed countries. Environmental Science and Pollution Research, 29(20), 30055–30072. https://doi.org/10.1007/s11356-021-17721-x
- Hung, N. T. (2022b). Time–frequency nexus between globalization, financial development, natural resources and carbon emissions in Vietnam. Economic Change and Restructuring, 1-23. developed countries. Environmental Science and Pollution Research, 29(20), 30055–30072. https://doi.org/10.1007/s11356-021-17721-x
- Hung, N. T., & Vo, X. V. (2022). Multi-scale Features of Interdependence Between Oil Prices and Stock Prices. Asia-Pacific Financial Markets, 1–30. https://doi.org/10.1007/s10690-022-09385-5
- Idun, A. A. A., Asafo-Adjei, E., Adam, A. M., & Isshaq, Z. (2022). Dynamic Connectedness between Indicators of the Ghana Stock Exchange Returns and Macroeconomic Fundamentals. Risks, 10(11), 215. https://doi.org/10.3390/risks10110215
- Jeris, S. S., & Nath, R. D. (2021). US banks in the time of COVID-19: Fresh insights from the wavelet approach. Eurasian Economic Review, 11(2), 349–361. https://doi.org/10.1007/s40822-021-00171-8
- Katusiime, L. (2019). Investigating spillover effects between foreign exchange rate volatility and commodity price volatility in Uganda. Economies, 7(1), 1–17. https://doi.org/10.3390/economies7010001
- Kinda, M. T., Mlachila, M. M., & Ouedraogo, R. (2016). Commodity price shocks and financial sector fragility. International Monetary Fund.
- Kinda, T., Mlachila, M., & Ouedraogo, R. (2018). Do commodity price shocks weaken the financial sector? The World Economy, 41(11), 3001–3044. https://doi.org/10.1111/twec.12667
- Magill, M., & Quinzii, M. (2002). Theory of incomplete markets (Vol. 1). Mit press.
- Minsky, H. P. (1970). Fundamental Reappraisal of The Discount Mechanism. Financial Instability Revisited: The Economics of Disaster. https://digitalcommons.bard.edu/cgi/viewcontent.cgi?article=1079&context=hm_archive
- Minsky, H. P. (1977). The financial instability hypothesis: An interpretation of Keynes and an alternative to “standard” theory. Challenge, 20(1), 20–27. https://doi.org/10.1080/05775132.1977.11470296
- Mupunga, N., & Ngundu, T. (2020). Commodity Price Shocks and Financial Sector Stability in Commodity Dependent Countries in Southern Africa. Studies in Economics and Econometrics, 44(3), 109–137. https://doi.org/10.1080/03796205.2020.1919427
- Nkrumah-Boadu, B., Owusu Junior, P., Adam, A. M., & Asafo-Adjei, E. (2022). Safe haven, hedge and diversification for African stocks: Cryptocurrencies versus gold in time-frequency perspective. Cogent Economics & Finance, 10(1). https://doi.org/10.1080/23322039.2022.2114171
- Obuobi, B., Nketiah, E., Awuah, F., & Amadi, A. G. (2019). Recapitalization of banks: Analysis of the Ghana banking industry. Open Journal of Business and Management, 8(1), 78. https://doi.org/10.4236/ojbm.2020.81006
- Olomola, P. A., & Adejumo, A. V. (2006). Oil price shock and macroeconomic activities in Nigeria. International Research Journal of Finance and Economics, 3(1), 28–34. https://www.researchgate.net/profile/Philip-Olomola/publication/228632000_Oil_price_shock_and_macroeconomic_activity_in_Nigeria/links/5613c13208aedf29a44f5b7a/Oil-price-shock-and-macroeconomic-activity-in-Nigeria.pdf
- Ongena, S., Popov, A., & Van Horen, N. (2019). The invisible hand of the government: Moral suasion during the European sovereign debt crisis. American Economic Journal: Macroeconomics, 11(4), 346–379. https://doi.org/10.1257/2Fmac.20160377
- Owusu, F. B., & Alhassan, A. L. (2021). Asset Liability Management and bank profitability: Statistical cost accounting analysis from an emerging market. International Journal of Finance & Economics, 26(1), 1488–1502. https://doi.org/10.1002/ijfe.1860
- Owusu Junior, P., Adam, A. M., Asafo-Adjei, E., Boateng, E., Hamidu, Z., & Awotwe, E. (2021). Time-frequency domain analysis of investor fear and expectations in stock markets of BRIC economies. Heliyon, 7(10), e08211. https://doi.org/10.1016/j.heliyon.2021.e08211
- Owusu Junior, P., Kwaku Boafo, B., Kwesi Awuye, B., Bonsu, K., Obeng-Tawiah, H., & McMillan, D. (2018). Comovement of stock exchange indices and exchange rates in Ghana: A wavelet coherence analysis. Cogent Business & Management, 5(1), 1481559. https://doi.org/10.1080/23311975.2018.1481559
- Pal, D., & Mitra, S. K. (2019). Oil price and automobile stock return co-movement: A wavelet coherence analysis. Economic Modelling, 76, 172–181. https://doi.org/10.1016/j.econmod.2018.07.028
- Qabhobho, T., Asafo-Adjei, E., Owusu Junior, P., & Adam, A. M. (2022). Quantifying information transfer between Commodities and Implied Volatilities in the Energy Markets: A Multi-frequency Approach. IJEEP, 12(5), 472–481. https://doi.org/10.32479/ijeep.13403
- Ratti, R. A., & Vespignani, J. L. (2016). Oil prices and global factor macroeconomic variables. Energy Economics, 59, 198–212. https://doi.org/10.1016/j.eneco.2016.06.002
- Reboredo, J. C., & Ugolini, A. (2016). Quantile dependence of oil price movements and stock returns. Energy Economics, 54, 33–49. https://doi.org/10.1016/j.eneco.2015.11.015
- Schackmann-Fallis, K. P., Gischer, H., & Weiß, M. (2018). A case for boring banking and reintermediation. Applied Economics Quarterly, 64(3), 199–238. https://doi.org/10.3790/aeq.64.3.199
- Shahbaz, M., Shahzad, S. J. H., Kablan, S., & Hammoudeh, S. (2019). Do Commodity Prices Cause Financial Instability in the United States? A Time-Varying Perspective through Rolling Window Bootstrap Approach. Handbook of Global Financial Markets, 335–357. https://doi.org/10.1142/2F9789813236653_0014
- Simoes, A. J. G., & Hidalgo, C. A. (2011, August). The economic complexity observatory: An analytical tool for understanding the dynamics of economic development. In Workshops at the twentyfifth AAAI conference on artificial intelligence. https://doi.org/10.1080/23311975.2018.1481559
- Torrence, C., & Compo, G. P. (1998). A Practical Guide to Wavelet Analysis. Bulletin of the American Meteorological Society, 79(1), 61–78. https://doi.org/10.1175/1520-0477(1998)079<0061:APGTWA>2.0.CO;2
- Tweneboah, G., Junior, P. O., & Kumah, S. P. (2020). Modelling the asymmetric linkages between spot gold prices and African stocks. Research in International Business and Finance, 54, 101246. https://doi.org/10.1016/j.ribaf.2020.101246
- Uribe, M., & Schmitt-Grohé, S. (2015). How Important Are Terms Of Trade Shocks? https://doi.org/10.3386/2Fw21253
- Wu, K., Zhu, J., Xu, M., & Yang, L. (2020). Can crude oil drive the co-movement in the international stock market? Evidence from partial wavelet coherence analysis. The North American Journal of Economics and Finance, 53, 101194. https://doi.org/10.1016/j.najef.2020.101194