?Mathematical formulae have been encoded as MathML and are displayed in this HTML version using MathJax in order to improve their display. Uncheck the box to turn MathJax off. This feature requires Javascript. Click on a formula to zoom.
Abstract
Financial inclusion is one of the development priorities of the Ethiopian Government. However, factors, which might affect it are not explored adequately with appropriate methods. To examine the relationship between financial inclusion and its demand-side determinants, we applied a simple probit model and two probit models with sample selection to the 2018/19 Ethiopia Socioeconomic Survey (ESS4). Our simple probit model estimation results show that male, older, non-Muslim, married, more educated, richest, mobile users or people who are aware of how to open a bank account are more likely to have a formal account than their counterparts. However, being from a rural area or from a larger household size reduces the likelihood of having an account. Results from the probit selection model show that rural residents, employed, richer people, or people who are out of labor force are more likely to use their account to save money than their counterparts. Furthermore, the third model shows that being non-Muslim, married, widowed, or poorer reduces the likelihood of account use than their counterparts. Thus, policies should target the most vulnerable groups of the society. Especially, rural households, women, the Muslim population, the poor, less educated people, and the young should be the focus of financial inclusion endeavors of the Government. Parallel to these policy measures, awareness of opening bank account and financial education programs should be promoted.
PUBLIC INTEREST STATEMENT
Financial inclusion is one of the development priorities of the Ethiopian Government. However, factors, which might affect it are not explored adequately. Hence, the paper tries to show the relation between financial inclusion and demographic, socio-economic and technological factors in. The study shows that male, older, non-Muslim, married, more educated, richest, mobile users or people who are aware of how to open a bank account are more likely to have a formal account. However, individuals from rural areas or from a larger household are less likely to have an account. Thus, rural households, women, the Muslim population, the poor, less educated people, and the young should be the focus of financial inclusion endeavors of the Government.
1. Introduction
Financial inclusion is a popular agenda for many governments, donors, researchers, and many international institutions. For instance, as a report published in 2014 by the World Bank shows, about two-thirds of regulatory and supervisory agencies have the responsibility of augmenting financial inclusion. Although the issue of finance is nothing new to the development economics, it is the United Nations that brought the financial inclusion concept to the attention of the international community in 2005.Footnote1 Following this, G-20 leaders expressed their commitment and willingness to support the poor in improving access to financial services. To facilitate the support, a group known as the Financial Inclusion Experts Group, was formed (see, Stein et al., Citation2011). Currently, there are many groups, organizations, initiatives, etc., which focus on financial inclusion targeting those underserved and excluded households. Some organizations, like the Global Partnership for Financial Inclusion (GPFI) have linked financial inclusion to some of the Sustainable Development Goals (see, Global Partnership for Financial Inclusion, Citation2020). Hence, many governments have designed financial inclusion strategies with the aim of achieving universal access of affordable and high-quality financial products and services.
Despite its wider acceptance, financial inclusion has no commonly agreed definition among institutions and scholars. For instance, the World Bank (Citation2014) defined it as “the proportion of individuals and firms that use financial services”. It has many aspects, which include various financial services ranging from payments and savings accounts to credit, insurance, pensions, and securities markets. African Development Bank has also provided its own definition: “Financial inclusion refers to all initiatives that make formal financial services Available, Accessible and Affordable to all segments of the population” (Alliance for Financial Inclusion, Citation2013). İbrahim and Rıfat (Citation2020) defined it as “the reaching to and utilizing from all financial instruments needed by every segment of society” (p. 101). Allen et al. (Citation2012) defined it as “the use of formal financial services”.
The Ethiopian financial inclusion strategy document has not defined the concept of financial inclusion. However, from the vision and mission statement, we can understand that financial inclusion encompasses achieving universal access and use of affordable and high-quality financial products and services (see National Bank of Ethiopia, Citation2017)
The importance of financial inclusion is widely recognized. Inclusive financial systems provide individuals and firms with greater access to resources to meet their financial needs, such as saving for retirement, investing in education, capitalizing on business opportunities, and confronting shocks (World Bank, Citation2014). Financial inclusion contributes to reduce poverty and inequalities and to sustainable development. Furthermore, it contributes to the empowerment of the most vulnerable groups (United Nations Conference on Trade and Development, Citation2021). Financial inclusion is an important avenue to ensure financial resilience and limit the fragility of households and to restore sustainable and inclusive growth (Global Partnership for Financial Inclusion, Citation2020). Financial inclusion has the potential to improve the lives of the most vulnerable groups in the population. It supports and improves rural livelihoods (see, Alliance for Financial Inclusion, Citation2022). It can help improve household well-being and reinforce women’s economic empowerment (Barajas et al., Citation2020).
Taking this into account, in 2017, the National Bank of Ethiopia designed the National Financial Inclusion Strategy with a vision of achieving universal access to and use of affordable and high-quality financial products and services by 2025. The Government has further shown its commitment by setting up National Council for Financial Inclusion accountable to the Prime Minister.
The significance of financial inclusion is well documented in the literature. However, the determinants of financial inclusion across individuals in Ethiopia are not investigated adequately with appropriate methodology. Hence, the impact of various demographic, socio-economic, and technological factors on account ownership, the use of an account to save and the use of the account to get a range of financial products and services of household members of Ethiopia needs investigation. This will bring us to the following research question: What are the major factors affecting financial inclusion in Ethiopia? In light of this question, the main objective of this study is to examine the impact of the demographic, socio-economic, and technological factors on the financial inclusion across individuals in Ethiopia. Investigating the determinants of financial inclusion will help us to have an insight about the drivers of financial inclusion in Ethiopia. Hence, policy makers, financial institutions, international organizations, partners, and donors could use the results from this study as an input in supporting and promoting financial inclusion in Ethiopia.
To the best of my knowledge, few researches examined the relation between financial inclusion and socioeconomic, demographic, and other factors in Ethiopia. Workineh (Citation2022) and Gashaw and Gebe (Citation2017) studied financial inclusion and its determinants using World Bank’s Global Findex database 2017. Furthermore, Andualem and Sambasiva (Citation2017) studied the financial inclusion in Ethiopia using a survey on 340 randomly selected adults from 34 Kebeles.Footnote2 Our study extends the previous studies mainly in two directions. First, it deploys a probit sample selection model to the two financial inclusion indicators, namely, the account use for saving indicator and the account use (financial services use) indicator. Since the account use for saving and the account use are observed only when account ownership is observed, a selectivity problem (non-random nature of the sample) arises. That is, we only observe whether an individual uses a bank account to save if he/she owns an account. Therefore, estimating the use of accounts to save and account use involves running a sample selection model. Thus, unlike previous studies, this study has accounted the sample selection problem (see, Verbeek, Citation2017; Wooldridge, Citation2002 for a discussion of sample selection problem). Second, we have make use of the additional information provided by the dataset from the survey, which was not available in the previous editions and leveraged on the most nationally wider, consistent, and representative of regional states as well as rural and urban areas surveys.Footnote3 Furthermore, compared to the previous waves, the data we used, i.e., Ethiopia Socioeconomic Survey (ESS4), has individual-level disaggregated household modules including information on education, health and labor and financial inclusion status of household members(See Central Statistical Agency of Ethiopia, Citation2019). In the ESS4, the labor module has been updated based on the concepts and definitions adopted by the 19th International Conference of Labor Statistics in 2013. Accordingly, the data collected are in line with ILO’s formal definition of employment status of individuals(See ILO, Citation2013 for definitions of employment and unemployment). Finally, the study used a revised consumption module, which reflects the current consumption patterns of Ethiopian households.
Using the 2018/19 Ethiopia Socioeconomic Survey (ESS4)Footnote4 we have tried to analyze the relationship between financial inclusion and technology (mobile phone use), socioeconomic and demographic factors. Based on this analysis we have identified some of the factors, which explain the state of financial inclusion in Ethiopia. Throughout the country, 6,700 households were interviewed and 14,862 people aged 18 years old and above responded to the individual financial inclusion questions.Footnote5
The rest of the paper is organized as follows: Section 2 briefly looks at the financial sector in Ethiopia. Section 3 revises various related literatures. Section 4 discusses the empirical analysis. Section 5 presents findings of the study and Section 6 concludes.
2. A brief review of the financial sector in Ethiopia
In Ethiopia, the financial sector comprises mainly of banks, insurance companies, and microfinance institutions. The sector is composed of 19 banks (17 private and 2 public),Footnote6 18 insurance companies (17 private and 1 public), and 39 microfinance institutions (National Bank of Ethiopia, Citation2021). In addition to these institutions, there are also 21,328 saving and credit cooperatives (Cooperative Agency, Citation2020).
National Bank of Ethiopia’s annual report shows that the capital of the banking sector has reached Birr 153.73 billion (3.52 billion USD) by the end of June 2021.Footnote7 The state owned Commercial Bank of Ethiopia has the lion’s share amounting to 32.7% of the total capital and the total branch network of the banking sector has reached 7344 out of which 26.1% covers Commercial Bank of Ethiopia’s branch networks. This results in a bank branch to population ratio of 1:14,000 people in 2020/21 making it one of the under-banked economies in sub-Saharan Africa.Footnote8 About 34.5% of the bank branches are located in the capital city. The report shows that total resources mobilized by the banking system in the form of deposits, loan collection and borrowing have reached Birr 505.2 billion (11.56 billion USD) at the end of June 2020/21. The report further indicated that the deposit liabilities of the banking system have been increasing and reached Birr 1.4 trillion (32.04 billion USD) at the end of the same period showing the increasing importance of banks in financial intermediation (National Bank of Ethiopia, Citation2021).
The lending activities of banks during the 2020/21 period was mainly due to international trade (20.07%); followed by the industrial sector (18.40%); domestic trade (15.16%); housing and construction (13.52%); agriculture (9.3%); mines, power, and water resources (6.12%); transport and communications (4.99%), and hotel and tourism (2.5%). The rest of the credit (1.82%) went to other economic sectors. Personal loans account only about 7.15% of the disbursement (ibid).
Currently, the banking sector is adopting various technologies to facilitate its transaction. For instance, almost all banks issue ATM/debit cards, while many banks have also started mobile payments, mobile banking, and internet banking. However, these e-banking activities are at their nascent stage.
Compared to the banking industry, the insurance industry is less developed. By the end of June 2021 the total capital was 11.1 billion Birr (0.25 billion USD) of which 74.6% is owned by private insurance companies (ibid).
Microfinance institutions are also popular in Ethiopia, particularly for saving and borrowing purposes. By the end of June 2021 they collectively mobilized 52.4 billion Birr (1.2 billion USD) in the form of savings and their total credit was 69.28 billion Birr (1.59 billion USD). Their capital and total assets had reached 27.88 billion Birr (0.64 billion USD) and 104.96 Birr (2.40 billion USD), respectively, by the end of June 2021 (ibid).
As it stands now, the financial sector in Ethiopia is highly regulated and foreign banks, micro-finance institutions and insurance companies are not allowed to operate.Footnote9
3. Literature review
3.1. Theoretical perspectives
3.1.1. Definition of financial inclusion
Despite its wider acceptance, financial inclusion has no commonly agreed definition. For instance, the World Bank (Citation2014) defined it as “the proportion of individuals and firms that use financial services”. It has many aspects, which include various financial services ranging from payments and savings accounts to credit, insurance, pensions, and securities markets.
The Asian Development Bank defined it as “ready access for households and firms to reasonably priced financial services” (ADB as cited in Yoshino & Morgan, Citation2016).
Reserve Bank of India defined financial inclusion in the following way:
“Financial Inclusion is the process of ensuring access to appropriate financial products and services needed by vulnerable groups such as weaker sections and low income groups at an affordable cost in a fair and transparent manner by mainstream Institutional players” (RBI as cited in Joshi, Citation2011).
African Development Bank has also provided its own definition: “Financial inclusion refers to all initiatives that make formal financial services Available, Accessible and Affordable to all segments of the population” (Tiriki & Faye, Citation2013).
Bank of Tanzania has defined financial inclusion as follows:
“Regular use of financial services by individuals and businesses through financial infrastructures to save, manage cash flows, invest in productive capacities and mitigate shocks, which are delivered by formal providers through a range of appropriate solutions with dignity and fairness” (BOT as cited in Alliance for Financial Inclusion, Citation2017, p. 3)
Allen et al. (Citation2012) defined it as “the use of formal financial services”. İbrahim and Rıfat (Citation2020) defined it as “the reaching to and utilizing from all financial instruments needed by every segment of society” (p. 101).Yoshino and Morgan (Citation2016) defined it as “the degree of access of households and firms, especially poorer households and small and medium-sized enterprises (SMEs), to financial services”. Ozili (Citation2020) has provided the following definition: “the ease of access to, and the availability of, basic financial services to all members of the population”. Barajas et al. (Citation2020) defined it as “the extent of access to and use of financial services”.
Although the Ethiopian financial inclusion strategy document has not defined the concept of financial inclusion, from the vision and mission statement we can understand that financial inclusion encompasses achieving universal access and use of affordable and high-quality financial products and services (see National Bank of Ethiopia, Citation2017)
From the above definitions we observe that the definition of financial inclusion revolves around accessibility, usage, and quality of financial products and services. Most financial inclusion definitions have some component related to access and usage of financial products and services by the population. In this research, we have adopted the definition of financial inclusion provided by Allen et al. (Citation2012).
3.1.2. Importance of financial inclusion
The importance of financial inclusion is widely recognized. As the World Bank’s Global Financial Development Report (World Bank, Citation2014) explained inclusive financial systems provide individuals and firms with greater access to resources to meet their financial needs, such as saving for retirement, investing in education, capitalizing on business opportunities, and confronting shocks” (p. Xi). Financial inclusion contributes to reduce poverty and inequalities and to sustainable development. Furthermore, it contributes to the empowerment of the most vulnerable groups (United Nations Conference on Trade and Development, Citation2021). Financial inclusion is an important avenue to ensure financial resilience and limit the fragility of households and to restore sustainable and inclusive growth (Global Partnership for Financial Inclusion, Citation2020). Financial inclusion has the potential to improve the lives of the most vulnerable groups in the population. It supports and improves rural livelihoods (see, Alliance for Financial Inclusion, Citation2022). Financial inclusion has a potential to contribute to economic and financial development while fostering inclusive growth and greater income equality (Yoshino & Morgan, Citation2016). It can help improve household well-being and reinforce women’s economic empowerment (Barajas et al., Citation2020). It is a determining factor in alleviating poverty, achieving sustainable economic growth, and promoting social cohesion (Massa, Citation2013).
3.1.3. Measurement issues
Measuring financial inclusion is critical because it allows policy makers to identify and understand challenges and opportunities related to it. According to the World Bank’s Global Financial Development Report (World Bank, Citation2014) until recently the measurement of financial inclusion around the globe has concentrated on density indicators, such as the number of bank branches or automatic teller machines (ATMs) per capita. These measurements were criticized because they do not indicate the degree of financial inclusion and the degree to which the poor, women, and other population segments are excluded from formal financial systems. The Bank has tried to ameliorate this problem by designing user-side (demand-side) indicators, which measure how adults in 148 economies around the world manage their day-to-day finances and plan for the future. The user-side indicator has about 40 indicators, which are related to account ownership, payments, savings, borrowing, and risk management.
Financial inclusion is a multidimensional concept that encompasses all initiatives, from both supply and demand sides, within the financial sector. They include provision of appropriate and quality financing that is both accessible and affordable to low-income and other vulnerable households. Notably, they target groups traditionally excluded from the formal financial sector (Tiriki & Faye, Citation2013). The Global Partnership for Financial Inclusion (G-20) measures financial inclusion in three dimensions: access to financial services, usage of financial services, and quality of products and the service delivery. Likewise, Alliance for Financial Inclusion (Citation2013) identifies three dimensions of financial inclusion: Access, Usage, and Quality. Stein et al. (Citation2011) also identified three key dimensions that define financial inclusion: products, features, and channels.
Gupta and Sharma (Citation2021) measured financial inclusion using bank account ownership and levels of access to and usage of a range of products. Allen et al. (Citation2012) use “deposit account use” as a financial inclusion measure when studying the foundations of financial inclusion for over 123 economies. They designed three indicators of account use [financial inclusion]: 1) ownership of an account, 2) use of an account to save, and 3) frequent use of the account (defined as three or more withdrawals per month).
3.1.4. Determinants of financial inclusion
From our survey of the literature, we noticed that financial inclusion differs across countries, regions, income levels, educational status, employment status, gender, and financial literacy of individuals. For instance, based on experience from Europe and the United States of America, Kempson et al. (Citation2000) identify a range of factors, which affect financial exclusion including incomes; financial literacy; employment status; marital status; education; technology development; gender; religion, culture, and language; age and geographical location. The World Bank’s Global Financial Development Report (2014) highlighted that there is substantial variation in financial inclusion across individual characteristics, such as income and gender. Evidence shows that people who live in developed countries and regions have relatively a higher chance of having more access to financial services and products. Likewise, those individuals at the higher-income quintile, educated, employed, male, or financially literate have a higher likelihood of getting access to finance. Technological development is also one factor, which explains variation in financial inclusion across countries, regions, households, or individuals. There are robust evidences that technology and product innovation in the financial sector affects financial inclusion positively.
3.2. Empirical review
This subsection presents some evidence related to financial inclusion and its determining factors.
Allen et al. (Citation2012) investigated the foundations of financial inclusion using Global Findex data for 123 countries over 124,000 individuals. They show that the likelihood of account ownership is higher among richer, older, urban, educated, employed, and married individuals. They also find similar results for the probability of using a bank account to save. Furthermore, the likelihood of using an account frequently is higher among older, richer, educated, or married individuals. They found no association between gender and account ownership, while females are less likely to use their accounts frequently. According to their finding, the most cited reason for not having a formal account is “Not enough money to use”. This reason was reported by 60% of adults without a formal account.
Using the Global Findex data, Tuesta et al. (Citation2015) analyzed determinants of financial inclusion in Argentina. They show that there is no difference by gender in account ownership. Furthermore, education, income, and age were found to increase the likelihood of the ownership of financial products or services (including account ownership).
Zins and Weill (Citation2016) studied the determinants of financial inclusion in Africa using the World Bank’s Global Findex database. They found that being a man, richer, more educated, and older favor financial inclusion with a higher influence of education and income. Ownership of a bank account, saving on a bank account, and use of bank credit are used as financial inclusion indicators. They show that the main barrier to financial inclusion is lack of money.
Using World Bank’s household survey on financial inclusion, Lanie (Citation2017) identified factors, which are important for financial inclusion in West Africa Economic and Monetary Union. They found that the likelihood of owning an account is higher among the aged, men, employed, more educated, or richest. They also show that the likelihood of using an account to save is similar to those of owning an account (but in this case there is no significant difference in the use of account to save between men and women). Likewise, the likelihood of using account frequently is similar to those of using account to save (except for the variable “income quintiles” where there is no significant difference in the frequency of use of accounts among income groups).
Gashaw and Gebe (Citation2017) studied the state of financial inclusion in Ethiopia using World Bank’s 2016 Ethiopian Socioeconomic Survey data. They show that being in an urban area, Christian, financially literate and capable, younger, or married increases the likelihood of owning an account. Furthermore, they show that having tertiary education, living in rural areas and having a preference for formal financial institutions increases the likelihood of using formal accounts for saving. Regarding account use, they show that being female, older, unmarried, afraid of covering unexpected expenses, and having low financial capability have lower probability of account use. However, except being female or older the rest of the variables are statistically insignificant. Regarding the account use to save indicator female, older, Muslim, financially illiterate, and people with low financial capability have a lower probability than their counterparts. But the only significant variable is financial capability. People from the rural area are more likely to use their accounts to save than their counterparts. They also show that financial capability and education are the most important factors in determining financial inclusion.
Abel et al. (Citation2018) investigated determinants of financial inclusion in Zimbabwe using FinScope Consumer Survey 2014. They show that financial inclusion increases with age, but beyond a certain level it starts declining. Education, income, internet connectivity, and financial literacy increase the likelihood of owning an account. However, being far away from financial institutions reduces the likelihood of account ownership.
Badar et al. (Citation2020) identified the determinants of financial inclusion in South East Asian countries, especially, Bangladesh, India and Pakistan. They show that educated, male, older, richer, or regular employees have a better chance to be financially included.
Gautier et al. (Citation2020) examined the determinants of financial inclusion in Cameroon between 2011 and 2014. They found that older, male or people with higher income are more likely to be financially included. However, contrary to other findings, their study indicates that educated people are less likely to have an account.
Rashdan and Noura (Citation2020) studied the determinants of financial inclusion in Egypt using the World Bank’s Global Findex 2017 database. They show that there is no significant relationship between gender and the level of financial inclusion. Furthermore, they found that richer, more educated and older individuals are more likely to be included in the financial system. Being in the workforce positively affects account ownership. They also indicate that the main barrier to financial inclusion is lack of money. On the other hand, age is negatively related to savings. The probability of saving for women is also negatively related. Individuals with low income are also less likely to save.
Ndanshau and Njau (Citation2021) analyzed the demand side determinants of financial inclusion using Tanzania FinScope survey of 2017. They show that being a male, middle-aged, living in the urban, being formally employed, having higher income and more educated fosters financial inclusion. They also show that majority of individuals in the sample reported lack or inadequacy of money income as the main factor for not having a bank account. Married and divorced are also more likely to have an account than unmarried.
Workineh (Citation2022) examines drivers and barriers of financial inclusion in Ethiopia using the World Bank’s Global Findex database 2017. They show that being a man, older, more educated, and wealthier is associated with greater level of financial inclusion with education and income having a greater effect.
Yangdol and Sarma (Citation2019) analyze the demand-side factors for financial inclusion in China. They find that being woman, less educated, jobless and poor are negatively associated with financial inclusion of individuals.
Özşuca (Citation2019) analyzes the level of financial inclusion in Turkey using individual-level data. The results of the study show that being man, older, richer and more educated increases the likelihood of having a formal account and formal saving.
Altarawneh et al. (Citation2020) et al. studies the determinants of financial inclusion in Latin America a Europe (Brazil and Romania). They find that income and education contribute to greater financial inclusion.
Mhlanaga and Denhere (Citation2020) investigate the determinants of financial inclusion in South Africa using 2018 General Household Survey (GHS) dataset. Results show that financial inclusion is driven by age, education level, and the total salary proxy of income, race, gender, and marital status. The result also indicates that being female and financial inclusion is associated negatively.
From the survey of the literature, we observed that few researches examined the relation between financial inclusion and socio-economic, demographic, and other factors in Ethiopia. The studies employed simple probit model in their estimation. However, this model is inappropriate when there is selection bias. Since the account use for saving and the account use are observed only when account ownership is observed, a selectivity problem (non-random nature of the sample) arises. That is, we only observe whether an individual uses a bank account to save if he/she owns an account. Therefore, estimating the use of accounts to save and account use should have involved running a probit sample selection model. Thus, unlike Gashaw and Gebe (Citation2017) and Workineh (Citation2022), this study has accounted the sample selection problem.
4. Empirical analysis
4.1. Data
The 2018/19 Ethiopia Socioeconomic Survey (ESS4) is a household survey conducted by the Central Statistics Agency of Ethiopia and the World Bank as part of the Living Standards Measurement Study. It collects, among other things, data on household and individual information on account ownership, banking and saving practices, and knowledge of financial institutions and products. Throughout the country 6,700 households were interviewed and 14,862 people aged 18 years and above responded to the individual financial inclusion questions. We have used this data in our analysis.Footnote10 Compared to the previous waves, ESS4 has individual-level disaggregated household modules including information on education, health and labor and financial inclusion status of household members. In ESS4, the labor module has been updated based on the concepts and definitions adopted by the 19th International Conference of Labor Statistics in 2013. Accordingly the data collected is in line with ILO’s formal definition of employment status of individuals. Finally, the study used a revised consumption module, which reflects the current consumption patterns of Ethiopian households.
4.2. Variables definition and measurement
4.2.1. Dependent variables
4.2.1.1. Account ownershipFootnote11
It is defined as having an account at a bank (public or private), microfinance institution, Savings and Credit Cooperative Organization (SACCO), mobile money application (M-Birr and Hello Cash), or in any other formal financial institution.
To identify account owners, we use the question: “Do you have a registration or account book at a bank, microfinance bank, SACCO or other formal financial institution or Mobile or wallet account? An account can be used to take a loan, save, transfer money or receive wages.” We define account ownership as a dummy that takes the value 1 if the individual has an account in any of the formal financial institutions and 0 otherwise.
4.2.1.2. The use of an account to save
It indicates savings made during the last 12 months in private banks, public banks, microfinance institutions and SACCO. In order to measure it, we use the following question: “In the past 12 months, did you save in any of the following formal financial institutions (Private Banks, Public banks, Microfinance Institution, SACCO)?” We define the use of an account to save as a dummy that takes the value 1 if the individual saves at either of the financial institutions and 0 otherwise.
4.2.1.3. Account use (use of financial services)
Account use is defined as the usage of either ATM/debit card, online banking, mobile banking, agent banking, or interest free banking for the last 12 months. Information on the use of financial services is provided in the following question: “In the last 12 months, have you used any of the following services (ATM/Debit card, Online banking, Mobile banking, Agent banking, Interest free banking)?” We define use of an account as a dummy that takes the value 1 if the individual has used any of the financial services during the specified period, and 0 otherwise.
4.3. Methodology
In order to investigate the nexus between financial inclusion and its determinants we have adopted the definition of financial inclusion and approach employed by Allen et al. (Citation2012) with a minor modification to the later. Our model focuses on three dimensions of the use of bank accounts: (1) owning a bank account, (2) using a bank account to save, and (3) account use (use of financial services).Footnote12 The dependent variable y1i, is a binary variable. Hence, in order to identify its determinants, we use the following model:
where individuals are indexed by i; y*1i is a latent variable in model (1) indicating account ownership, z’1i is a vector of various socioeconomic, demographic, and mobile use indicators (described in Table ), β is vector of parameters, and ε1i is a normally distributed error term with zero mean and variance equal to 1. We estimate (1) as a probit model by maximum likelihood.
Table 1. Description of independent variables
We only observe whether an individual uses a bank account to save, y*2i, if he or she owns an account. Therefore, estimating the use of accounts to save involves running a sample selection model. Since using an account to save is a binary variable, we use a selection model where model (1) defines the probit selection specification and model (2) below captures individuals′ decision to use their account to save (i.e. it is the equation of interest):
Selection equation:
Equation of interest (Outcome equation):
where y*2i is a latent variable in model (2) indicating a bank account to save, and is observed only when y2i = 1. Furthermore, Z′1i and Z′2i are assumed to be independent of ε1i and ε2i; ε1i and ε2i are normally distributed with zero mean and variance equal to 1.
We jointly estimate the probit selection procedure (model (1)) and model (2) by maximum likelihood. In this model, we have excluded two variables used in the first model: Awareness and mobile phones. We assume that knowing how to open a bank account and mobile phone ownership do not have a direct impact on the decision to use the account for saving.
Similarly, we only observe whether an individual uses a bank account to get a range of financial services, y*2i, if he or she owns an account. Therefore, estimating account use involves running a sample selection model. Since account use is a binary variable, we use a selection model where model (1) defines the probit selection specification and model (3) below captures individuals′ decision of account use:
Selection equation:
Equation of interest (Outcome equation):
where y*3i is a latent variable in model (3) indicating account use (use of financial services) and is observed only when y3i = 1. Furthermore, Z′1i and Z′3i are assumed to be independent of ε1i and ε3i; ε1i and ε3i are normally distributed with zero mean and variance equal to 1.
We can jointly estimate the probit selection procedure and model (3) by maximum likelihood. From this model, we have excluded awareness. It is assumed that knowing how to open a bank account does not have a direct impact on account use.
5. Findings
5.1. Descriptive resultsFootnote13
5.1.1. Account ownership
Out of the 14, 862 individuals aged 18 years and above, 36.17% report to have an account at a formal financial institution.Footnote14 There is gender imbalance in account ownership. About 43.4% male and 29.8% female have an account at a formal financial institution. There is a wide gap in rural and urban residents in account ownership. About 55% of urban residents report to have an account at a formal institution. However, only 14% of rural dwellers report to have an account at a formal institution.
There is also a wide regional variation in account ownership. The capital city, Addis Ababa has the largest number of account holders, with 73% of respondents having an account at a formal financial institution. Somali Regional State has the lowest number-only 9.4% of respondents have an account (see ).
The survey shows that about 35.3% of married individuals, 39.9% of unmarried individuals, 41.2% of divorced or separated individuals, and 26% of widowed individuals have an account. About 86.8% respondents with tertiary education have formal account; 60% of respondents with secondary education, 37% of respondents with informal education, and 35.7% with elementary education have an account at a formal institution.
About 63.1% respondents who are employed, 47.3% of unemployed and 28.6% of potential jobseekers, and 23.2% of individuals who are out of labor force have an account.
About 44% of Non-Muslim individuals report to have an account at a formal financial institution. The figure is only 22.3% for Muslims.
Only 9.2% of the poorest (the lowest quintile) individuals have an account at a formal financial institution. However, 61.8% of the richest people have an account. Here, we can observe that there is a wide gap between the poor and the rich in account ownership which is approximately 52.6%.
About 67.9% of people who know-how to open a bank account have an account at a formal financial institution. The figure is only 7.2% for those who do not know.
Account ownership also varies with household size. Households with smaller size (up to 5 members) have higher account ownership compared with larger size households (6 to 19 household members). Approximately, 42.3% of households with smaller size have account while for larger size it is about 24.6%.
5.1.2. Account use (financial services use)
Individuals use their account to get a range of services. The survey shows that about 37%, 6%, 13%, 2%, and 13% account holders use their account for ATM/Debit card, online banking, mobile banking, agent banking, and interest free banking respectively. Generally, about 45% of individuals use their account to get at least one of the above financial services. There is a gender gap of about 14% in account use: The account use is 37.17% for female and 51.3% for male respondents.
The urban–rural difference in account use is wide. The account use is 48.7% for urban residents and 28.9% for rural residents.
Among the regions, Somali Regional State has the largest account users with 59.5% of respondents having used either of the financial products at least once during the last 12 months.Footnote15 Amhara Regional State has the lowest users (29.3%). Addis Ababa has the highest ratio of ATM/Card users with 47.7% of respondents having used ATM/Card. It is followed by Dire Dawa, which has 44.3% ATM/Card users. Amhara Regional State has the lowest ATM/Card users with only 22.6% of individuals using the service. Somali Regional State has the largest online banking users amounting to 11.5%, followed by Oromia Regional State, which has 10% users. Gambella Regional State has the smallest online banking users with only 2.3%. Mobile banking is also predominant in Somali Regional State than the other Regions and Administrations. About 29% of respondents said they use mobile banking. Gambella Regional State has only 6.9% users, which is the lowest. The region also leads in agent banking users. It has 7.6% users. Amhara Regional State has the lowest agent banking users with only 0.8%. Afar Regional State has the highest interest free banking users with 32.3% of individuals having reported using the service and Tigray Regional State has the lowest, with only 3.8% of the respondents using the service (see ).
There is also a gender gap in ATM/Card usage. More men (42.7%) than women (29.1%) use the service. About 4.4% of women use online banking while for men it is 7.4%. The national average is 6.1%. About 9.8% women use mobile banking, whereas for men it is 15.1%. The national average is 12.8%. Agent banking is still at its nascent stage with only 1.6% women and 2.5% men report to having used it. The national average is 2.1%. Interest free banking is becoming popular. About 11.5% women and 13.8% men use the service. At national level, there are about 12.8% interest free banking users (See table ).
Table 2. Account use by type of financial services
About 41% of urban and 17% of rural respondents use ATM/Card; 7% of urban and 5% of rural residents use online banking; 14% of urban and 7% of rural residents use mobile banking; 2% of urban and 2% of rural residents use agent banking and 14% of rural and 13% of urban residents use interest free banking (See table ).
The rich uses ATM/Card more than the poor. About 47.6% of the richest group (top 20%) uses ATM/Card. The lowest quintile has the lowest ATM/Card users. Only 12.9% of individuals use ATM/Card. Mobile banking also seems to follow the same trend with the richest using the most and the poorest the lowest (18% of the richest and 2.5% of the poorest use mobile banking). With regard to online banking, the richest use the most (7.8% of individuals use online banking), the second-lowest (second lowest quintile) are the lowest users (2.7% of individuals use online banking). Agent banking use also follows the same trend as mobile banking and ATM/Card use (2.8% of the rich and 0.4% of the poor use it). The mid-quintile individuals use interest free banking the most (15.4% of the respondents having said they used the service). Only 8% of individuals in the lowest quintile use the service (See table ).
The survey shows that about 42.2% of married individuals, 58.9% of unmarried individuals, 35.2% of divorced or separated individuals, and 19% of widowed individuals use their account to get a range of financial services.
Account use is higher for the upper quintile (the top 20% richest group) which is approximately 55%. The lowest quintile (the lowest 20% poorest group) uses financial services the least. It is nearly 21%. For the second lowest, middle income, and second highest groups the use of account is 28.7%, 39.4%, and 41.9% in their respective order.
About 77% respondents with tertiary education, 52.2% of respondents with secondary education, 22.5% of respondents with informal education and 29% with elementary education use their account to get financial services.
About 52.2% respondents who are employed, 59% of unemployed, 38.1% of potential jobseekers, and 36.8.1% of individuals who are out of labor force have used their account to get different financial services.
Nearly 40% of Non-Muslim individuals report to have used their account to get various financial services from financial institutions. The figure is 56.8% for Muslims.
About 48.6% of respondents who know-how to open a bank account use their account to get various financial services. The figure is only 15.7% for those who do not know.
5.1.3. Use of accounts to save
Approximately 31.2% of adults reported that they saved in the past year. There is noticeable variation of saving between men and women. The gap is about 12%. Out of the total adult men 37.9% reported that they saved in the last year, while only 25.3% adult women do so. About 74% of individuals with formal account use their account for saving at a formal financial institution in the past year. There is no major difference between male and female in this regard. Approximately, 69.5% females and 77.6% males use their account to save during the last 12 months.
The urban-rural variation in saving behavior is very small. About 73.13% of urban and 78.13% of rural residents use their account to save money. In this case, rural residents use their account better. Out of the total account holders about 43.6% of males use their account to save and it is about 30.5% for females. This result shows that the rural–urban divide is less pronounced than the gender difference.
The survey shows that about 26.7% of married individuals, 29.1% of unmarried individuals, 29.2% of divorced or separated individuals, and 16.6% of widowed individuals use their account for saving.
Account use for saving is higher for the upper quintile (the richest group) which is approximately 48%. It is nearly 6% for the lowest quintile (the poorest group). For the second lowest, middle income, and second highest groups the use of account is 13.4%, 19.8%, and 30.7% in their respective order.
About 72% of respondents with tertiary education use their account for saving; 45.3% of respondents with secondary education, 29% of respondents with informal education, and 25.6% with elementary education use their account to save. Approximately 43.7% of employed, 25.3% of unemployed, 16.2% of potential jobseekers, and 8.5% of individuals who are out of labor force use their account to save.
Unlike in the case of account ownership and account use, the gap between Muslims and Non-Muslims in account use for saving is narrow. Approximately 70% of Muslim and 75% of Non- Muslim individuals report to have used their account to save.
Account use for saving is higher for those who are aware of how to open a bank account, which is approximately 51.1%. However, this figure is only 4.6% for their counterparts.
There is also a wide variation across regions in using their accounts for savings. Benishangul Gumuz Regional State has the highest percentage of people who used their account to save in formal institutions. Almost 85.7% of the respondents report that they saved at least in one of the institutions. Somali Regional State has the lowest percentage of people who saved in formal institutions. About 53.4% of the respondents report that they saved at least in one of the institutions during the past 12 months (see ).
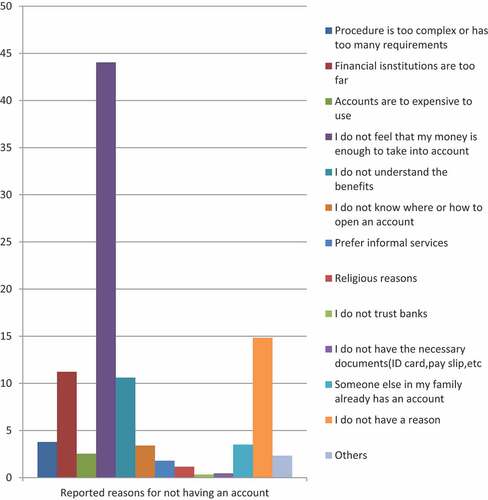
5.1.4. Reported barriers to account ownership
In order to identify barriers to account ownership, those respondents with no formal account were provided with multiple reasons to select from. The predominant reason cited by the respondents was “I don’t feel that my money is enough to take into account.” Nearly 44% of the respondents gave this reason. The second most common reason is “I don’t have a reason” (14.84%) followed by “financial institutions are too far” (11.22%). From this result, we can observe that 70.08% respondents gave either of the above three reasons. The rest of the respondents select the following reasons for not having an account: “I do not understand the benefits” (10.6%); “Procedure is too complex or has too many requirements” (3.78%); “Someone else in my family already has an account” (3.5%); “I do not know where or how to open an account” (3.41%); “Accounts are too expensive to use” (2.53%); Prefer informal services” (1.79%); “Religious reasons” (1.16%); “I do not have the necessary documents (ID card, pay slip, etc.)” (0.46%); “I do not trust banks” (0.34%).
5.2. Econometric results
In Table we present results for the three measures of the use of accounts. The second column shows results from the simple probit estimation for account ownership; the third column shows results from the probit model with sample selection for using the account to save; and the last column shows results from the probit model with sample selection for account use.
Table 3. Estimation results for financial inclusion indicators
5.2.1. Account ownership
As can be seen from column 2 those individuals who are male, older, married, educated, richer, with smaller household size, or from urban areas have a higher likelihood of account ownership than their counterparts. Similar results were obtained by Ndanshau and Njau (Citation2021), Badar et al. (Citation2020), Rashdan and Noura (Citation2020), Lanie (Citation2017), Gashaw and Gebe (Citation2017), Zins and Weill (Citation2016), Tuesta et al. (Citation2015), and Allen et.al. (Citation2012). Furthermore, individuals who know-how to open an account are more likely to have an account at a formal financial institution than their counterparts. This finding is in line with Gashaw and Gebe (Citation2017).
The table also shows that mobile ownership is positively related to account ownership. It increases the likelihood of owning a bank account. Individuals with mobile phone have, on average, 13.5 percentage points higher probability of having an account than their counterparts. Sotomayor et al. (Citation2018) have also reported similar relationships for Peru. Likewise, average predicted probability for account ownership is higher for those people who know-how to open a bank account. Their likelihood is, on average, higher by 26.9 percentage points than those who do not know-how to open a bank account. Sotomayor et al. (Citation2018) have also reported similar relationships for Peru.
Rural residents are less likely to have formal bank accounts compared to urban residents. Being a rural resident reduces the probability of having a bank account by 6.3 percentage points. From the table, we can also observe that there is a gender imbalance in the likelihood of account ownership. On average, the likelihood of account ownership is 4.5 percentage points higher for males compared to females. However, Sotomayor et al. (Citation2018) finding contradicts our results.
Age also seems to increase the probability of having a bank account. Each additional year increases the likelihood of formal account ownership by 0.8 percentage points. However, the increase in probability diminishes at a later age. Sotomayor et al. (Citation2018) have also reported similar results for Peru.
Non-Muslim individuals are more likely to have an account than Muslims. On average, the likelihood of account ownership is 3.7 percentage points higher than their counterparts. Married individuals are more likely to have an account compared to unmarried people. The probability of having a bank account is higher by about 3.3 percentage point for married people.
Compared to people with elementary education individuals with secondary and tertiary education are more likely to have a bank account at a formal institution. Their likelihood is about 5.2 and 20.1 percentage points higher, respectively. Sotomayor et al. (Citation2018) have also reported similar results for Peru.
Account ownership also varies with income. Individuals at the lowest quintile (lowest 20%) are less likely to have an account compared to individuals at the top quintile (top 20%). Thus, the likelihood of having a bank account for poor people is 9.1 percentage points lower than the richest individuals. Those people with second lowest income, middle-income, and second highest income are 8.6, 4.9, and 3.8 percentage points less likely to have an account in their respective order. Sotomayor et al. (Citation2018) have also reported similar results for Peru.
Household size has a negative relation to the probability of having a bank account. Increasing household size by 100% reduces the likelihood of account ownership approximately by 0.05.
There is a regional variation in the likelihood of account ownership. Individuals from Tigray, Amhara Oromia, or SNNP Regional States or Addis Ababa City Administration (Group 1) have a higher likelihood of formal account ownership than people from Afar, Somali, Benishangul Gumuz, Gambella, and Harari Regional States and Dire Dawa City Administration (Group 2). On average, the likelihood of account ownership is 4.6 percentage points higher than their counterparts.
Estimation results from the first model show that income, area of residence, education, age, and awareness of how to open a bank account have highly significant impact on the probability of account ownership.
5.2.2. Use of accounts for savings
Table column 3 indicates results from model 2. Since the correlation between the error terms of the two equations, i.e. the outcome equation and the selection equation (model 2 and model 1) is different from zero, accounting the sample selection problem is warranted. Therefore, we have applied the probit model with sample selection.Footnote16 As can be seen from column 3, only those individuals who are from rural, employed, out of labor force, and richer have a higher likelihood of use of accounts for savings than their counterparts. Allen et al. (Citation2012) and Lanie (Citation2017) have also found similar results for the rich and employed individuals. However, Gashaw and Gebe (Citation2017) have found negative relation between financial capability (a proxy for income) and account use for saving in Ethiopia. Furthermore, Allen et al. (Citation2012) have found a positive association between urban dwelling and account use for savings.Footnote17Footnote18 However, Gashaw and Gebe (Citation2017) found that living in a rural area increases the likelihood of using formal accounts for saving in Ethiopia which is in line with our findings.
Table shows that rural residents are more likely to use their account for saving than urban dwellers. Their likelihood of using their bank account is, on average, 10.7 percentage points higher than their counterparts. Likewise, employed individuals are more likely to use their account for saving compared to those who are unemployed. Their likelihood is, on average, higher by 18.4 percentage points than their counterparts. Similarly, individuals who are out of labor force have a higher probability of using their bank account for saving than unemployed people. Their likelihood is higher by about 11.3 percentage points than unemployed. Compared to the top income quintile people the second highest (fourth quintile) are less likely to use their account for saving. It is lower by about 6.5 percentage points. From the results, we can infer that place of residence, employment status, and income are the most significant factors in determining use of accounts for saving.
From the table, we can also observe that there is no significant correlation between use of account for saving and shock, gender, age, religion, marital status, education status, and household size.
5.2.3. Account use (financial services use)
Table column 4 indicates results from model 3. Since the correlation between the error terms of the two equations, i.e. the outcome equation and the selection equation (model 3 and model 1) is different from zero, we have accounted the sample selection problem. Therefore, we have applied the probit model with sample selection.
As can be seen from column 4 male, Muslim, unmarried, more educated, or the rich have a higher chance of using their account to get a range of financial services, like ATM/Card services, online banking, mobile banking, agent banking or interest free banking. Sotomayor et al. (Citation2018) have also reported similar results for Peru. They found that being male, rich, educated, and having mobile phone increases the likelihood of account usage.
However, individuals who are worried about unexpected expenses, non-Muslims, married, widowed, and poor are less likely to use their account to get various financial services than their counterparts.
Furthermore, the table shows that place of residence, age, having mobile phone, divorced or separated, informal education, unemployment and potential job seeker and household size have not significant impact on account use.
From the table, we can also observe that there is a gender imbalance in the likelihood of account use. On average, the likelihood of account use is 12.8 percentage points higher for male compared to female.
Individuals who are worried about being able to cover unexpected expenses are less likely to use their account than their counterparts. On average, the likelihood of account use is 8.5 percentage points lower than their counterparts. Non-Muslim individuals are less likely to use their account than Muslims. On average, the likelihood of account use is 24.8 percentage points lower than their counterparts.
Married individuals are less likely to use their account compared to unmarried people. The probability of using bank account is lower by about 7 percentage point for married people compared to unmarried one. Likewise, widowed individuals have also a lower chance of using their account compared to unmarried ones. Their likelihood is lower by about 12.1 percentage points.
Compared to people with elementary education individuals with secondary and tertiary education are more likely to use their bank account to get financial services. Their likelihood is about 17.4 and 39.6 percentage points higher.
Account use also varies with income. Individuals at the lowest quintile (lowest 20%) are less likely to use their account to get financial services compared to individuals at the top quintile (top 20%). Thus, the likelihood of using a bank account use for poor people is 11.5 percentage points lower than the richest individuals. Those people with second lowest income, middle-income, and second highest income are 15, 9.8, and 10.8 percentage points less likely to use their account in their respective order.
6. Conclusion
Financial inclusion is one of the development priorities of Ethiopian Government. However, factors which might affect it are not explored adequately. To examine the relationship between financial inclusion and its demand-side determinants, we used the 2018/19 Ethiopia Socioeconomic Survey.
We have used three indicators of financial inclusion in our analysis: Account ownership, use of account for saving, and account use. Besides the simple probit model, we have deployed a probit model with sample selection to account for the sample selection problem observed in the survey. Our simple probit model estimation results show that male, older, non-Muslim, married, more educated, richest, mobile users or people who are aware of how to open a bank account are more likely to have a formal account than their counterparts. However, being from a rural area or from a larger household size reduces the likelihood of having an account at a formal financial institution. Results from the second model show that rural residents, employed, or people who are out of labor force are more likely to use their account to save money than their counterparts. However, poorer people are less likely to use their account for saving compared to richer people. Finally, the third model indicates that being non-Muslim, married, widowed, or poorer reduces the likelihood of account use to get a range of financial services compared to being Muslim, unmarried, or richer. In all models, income has a significant impact on the financial inclusion indicators.
Respondents have also reported some of the barriers, which hinder them to have an account at a formal financial institution. The main barrier reported by the respondents is that they do not have sufficient money, followed by “no reason”. Distance was cited as the third most common reason. We observed that collectively 70.08% of the respondents gave the three reasons for not having an account at a formal financial institution.
The state of financial inclusion in Ethiopia is far from universal. Hence, further concerted effort need to be exerted by policy makers, regulators, partners, and donors. Based on our findings, we recommend that digital financial services should be promoted. Mobile phones use is now on the rise. Thus, promoting digital financial services are especially useful for the young and people who live in more remote and under-banked and underserved areas. Telecom companies and financial institutions should also be encourage and supported to provide free mobile phones to the poor.
More gender, culture, and religion sensitive products should be developed and promoted to the society. Especially, products targeting women should be encouraged. Products which already focus on women and the Islamic population should be further strengthened.
Awareness and financial education programs should be promoted. Awareness and financial education programs have a favorable impact on financial inclusion. Thus, financial institutions should design and promote those programs to the poor and people who live in remote, rural, and under-banked/underserved areas using various information communication technologies, including the mainstream media. As has been evidenced in our study, individuals who do not know-how to open an account at formal financial institutions are less likely to have an account. Hence, formal financial institutions need to engage themselves in educating the most vulnerable groups.
Financial institutions should be encouraged to incorporate financial inclusion objectives into their corporate social responsibility strategy. Most financial institutions’ branches are located at urban areas leaving the rural population underserved. Thus, financial institutions should be given various incentive packages to extend their services to the most vulnerable groups of the society. Furthermore, financial institutions should be encouraged to mainstream financial inclusion strategy into their corporate social responsibility strategy.
Adults should be encouraged to open bank account to collect their wages and salaries, assistance, receive government transfers or pensions. During the study period 88.19% of payments made to those who receive assistance from the Government and NGOs were made through direct cash transfers. Government and NGOs should encourage beneficiaries of their programs to open an account at a formal financial institution. In relation to this, the Government may also give direct support to people at the lowest income quintile and with lowest education level.
Using the national survey, we have tried to identify the underpinnings of financial inclusion, which is defined as, the use of formal financial services, in the Ethiopian context. We believe that the econometric results obtained from the study could be used as policy options for the Ethiopian economy. However, caution should be taken in interpreting the results since endogeniety bias might be present in the estimation. Hence, results are interpreted as associations rather than causal relationships.
Our study has its own limitations. First, our assumption is that all explanatory variables are exogenous. However, the author acknowledges that endogeneity might be present in the estimations and future researchers could extend this study by allowing for endogenous explanatory variables in the model. Second, the study focuses only on the demand-side determinants of financial inclusion. However, in order to fully understand the foundations of financial inclusion in Ethiopia supply-side factors and national regulatory and competition policy issues should also be considered in future researches.
Disclosure statement
No potential conflict of interest was reported by the author(s).
Additional information
Funding
Notes on contributors

Haftu Girmay Giday
Haftu Girmay Giday The author is an independent researcher and has published two articles previously. The first relates to information communication technology and profitability of commercial banks in Ethiopia and the second study is about information communication and economic growth in sub-Saharan Africa. Furthermore, the author is interested in digital financing, network industries, and competition policy and regulatory economics.
Notes
1. The Social Exclusion Unit (SEU) of UK set up in 1997 established a number of Policy Action Teams (PATs) among which PAT14 is one of them. The team was responsible for looking at financial exclusion. In this task the Financial Services Authority (UK) was involved. Thus, we can fairly say that the UK Government gave a special attention to the issue of financial access earlier than the United Nations (See, Kempson et al., Citation2000).
2. “Kebeles” are the smallest administrative units in Ethiopia.
3. For instance, data on mobile phones for individuals of age 18 years and above were not available in the previous datasets. Furthermore, as has been stated by Central Statistical Agency (Now called Ethiopian Statistics Service) and the World Bank “Unlike previous ESS waves, ESS4 is also representative of regions as well as rural and urban areas”. Generally, the current dataset has relatively wider coverage, consistent data, and improved availability and quality of individual-disaggregated household data.
4. It is a household survey conducted in 2018/19 by the Central Statistics Agency of Ethiopia and the World Bank as part of the Living Standards Measurement Study.
5. According to the Ethiopian law only individuals 18 years of age and above are allowed to have a bank account.
6. According to various media reports additional 8 private commercial banks are licensed since June 2022.
7. The interbank exchange rate of Birr per USD at the second quarter of 2021(end of Ethiopian budget year) was 43.691. Dollar values are calculated by the author based on the exchange rate. Note that “Birr” is the currency of Ethiopia.
8. Central Statistical Agency’s population projection for the year 2020/21 was 102,816,000.
9. However, the Government of Ethiopia has repeatedly said that entry of foreign banks is imminent in the near future.
10. The ESS4 data is accessed from the World Bank’s database on 8 January 2021.
11. Note that account ownership, (defined as having an account at a bank (public or private), microfinance institution, Savings and Credit Cooperative Organization (SACCO), mobile money application (M-Birr and Hello Cash), or in any other formal financial institution) is used as a proxy for financial inclusion.
12. Following Gashaw and Gebe (Citation2017) we adopt “account use (use of financial services)” as a proxy for “Frequency of use” used by Allen et al. (Citation2012). In the Ethiopian context, the survey did not collect data on the frequency of use; specifically data is not available on the number of withdrawals made during a typical month by an individual.
13. Graphs are presented in the Appendix.
14. In the survey, there are 15,344 individuals whose age is 18 years and above. However, 482 of them have not responded to the account ownership questionnaire.
15. Note that during the data collection period there were nine Regional States and two City Administrations.
16. Detail regression results will be provided upon request from the author.
17. Ethiopia was not included in their study.
18. All calculations are made by the author using ESS4 data and STATA 14.
References
- Abel, S., Mutandwa, L., & Le Roux, P. (2018). A review of determinants of financial inclusion. International Journal of Economics and Financial Issues, 8(3), 1–28. https://www.econjournals.com/index.php/ijefi/article/view/5458
- Allen, F., Demirguc-Kunt, A., Klapper, L., & Martinez Peria, M. S. (2012). The foundations of financial inclusion: Understanding ownership and use of formal accounts, policy research working paper 6290, the World Bank Development Research Group Finance and Private Sector Development.
- Alliance for Financial Inclusion. (2013). Defining and measuring financial inclusion. T. Tiriki & I. Faye Eds. African Development Bank Group
- Alliance for Financial Inclusion. (2017). Defining financial inclusion. In Guideline Note No (pp. 28). Financial Inclusion Strategy Working Group.
- Alliance for Financial Inclusion. (2022). Enhancing financial inclusion in rural areas. In Guideline Note No (pp. 50). Financial Inclusion Strategy(FIS) Peer Learning Group.
- Altarawneh, Y., Al-Nuaimi, M., & Al-Nimri, A. (2020). The determinants of financial inclusion in Latin America and Europe (Brazil and Romania Case). Systemic Reviews in Pharmacy, 11(12), 192–196. https://www.sysrevpharm.org/articles/the-determinants-of-financial-inclusion-in-latin-america-and-europe-brazil-and-romania-case.pdf
- Andualem, B., & Sambasiva, K. (2017). Financial inclusion in Ethiopia. International Journal of Economics and Finance, 9(4), 191–201. https://doi.org/10.5539/ijef.v9n4p191
- Badar, R., Anwar, S., & Naqvi, S. A. A. (2020). Financial inclusion and determinants in South Asian countries. Journal of Accounting and Finance in Emerging Economies, 6(2), 623–633. https://doi.org/10.26710/jafee.v6i2.1300
- Barajas, A., Beck, T., Belhaj, M., & Naceur, B. (2020). Financial inclusion: What have we learned so far? What do we have to learn? IMF working paper No. WP/20/157, International Monetary Fund.
- Central Statistical Agency of Ethiopia. (2019). Ethiopia socioeconomic survey (ESS4), 2018-2019. Ref: ETH_2018_ESS_v01. Downloaded from: www.worldbank.org on January 8, 2021.
- Cooperative Agency. (2020). Cooperative Sector 5 year strategic plan (2020/21-2025/2026), January 2020, Federal Democratic Republic of Ethiopia (Amharic version).
- Gashaw, D., & Gebe, Y. (2017). Financial inclusion in Ethiopia: Using LSMS (Ethiopia Socioeconomic Survey) data. Ethiopian Journal of Economics, XXVI(2), 31–57. https://eea-et.org/wp-content/uploads/2021/06/Financial-Inclusion-in-Ethiopia-Using-LSMS-Ethiopia.pdf
- Gautier, T., Luc, N., & Djimoudjiel, D. (2020). Dynamic analysis of determinants of financial inclusion in Cameroon. European Scientific Journal, 16(36), 1. http://dx.doi.org/10.19044/esj.2020.v16n1p106
- Global Partnership for Financial Inclusion. (2020). G20 2020 Financial inclusion action plan.
- Gupta, S., & Sharma, M. (2021). A demand-side approach to measuring financial inclusion: Going beyond bank account ownership. Working Paper Series No. WP-2021-05, Dvara Research.
- İbrahim, B. O. Z. K. U. R. T., & Rıfat, K. A. R. A. K. U. Ş. (2020). Provincial financial inclusion in Turkey: Measurement and its spatial determinants. Ege Academic Review. https://doi.org/10.21121/eab.729532
- ILO. (2013). Resolution I. Resolution concerning statistics of work, employment and labour underutilization: The 19th International Conference of Labour Statistician, 11th day of October 2013.
- Joshi, P. (2011, June). Financial inclusion and financial literacy.BI. OECD Seminar- Roundtable on the Updates on Financial Education and Inclusion Programs in India, 28, 2011. https://www.oecd.org/finance/financial-education/48303408.pdf
- Kempson, E., Whyley, C., Caskey, J., & Collard, S. (2000). In or out? Financial exclusion: A literature and research review, consumer research 3, Financial Services Authority, UK.
- Lanie, T. (2017). Demand-driven determinants and self-reported barriers to financial inclusion in the West African economic and monetary union (WAEMU). Journal of Economics and International Finance, 9(11), 120–130. https://doi.org/10.5897/JEIF2017.0875
- Massa, I. (2013). DFIs support to financial inclusion in Africa (T. Tiriki & I. Faye, Eds). African Development Bank Group.
- Mhlanaga, D., & Denhere. (2020). Determinants of financial inclusion in Southern Africa. Studia Universitatis Babeş-Bolyai . Oeconomica, 65(3), 39–52. https://doi.org/10.2478/subboec-2020-0014
- National Bank of Ethiopia. (2017). National financial inclusion strategy. http://www.nbe.gov.et
- National Bank of Ethiopia. (2021). Annual Report 2020/2021.
- Ndanshau, O. A., & Njau, E. (2021). Empirical investigation into demand-side determinants of financial inclusion in Tanzania. African Journal of Economic Review, IX(I), 172–190.
- Ozili, P. K. (2020). Theories of financial inclusion. Munich personal RePEc archive, Paper No. 101810. https://mpra.ub.uni-muenchen.de/101810/.
- Özşuca, E. (2019). Financial inclusion in Turkey: Evidence from individual level data. Ankara Üniversitesi SBF Dergisi, 74(4). https://doi.org/10.33630/ausbf.614032
- Rashdan, A., & Noura, E. (2020). The determinants of financial inclusion in Egypt. International Journal of Financial Research, 11, 1. https://doi.org/10.5430/ijfr.v11n1p123
- Sotomayor, N., Talledo, J., & Wong, S. (2018). Determinants of financial inclusion in Peru: Recent Evidence from the demand side. DT/06. SBS.
- Stein, P., Randhawa, B., & Bilandzic, N. (2011). Toward universal access: Addressing the global challenge of financial inclusion. International Finance Corporation.
- Tiriki, T., & Faye, I. (2013). Financial inclusion in Africa. African Development Bank Group.
- Tuesta, D., Sorensen, G., Haring, A., & Cámara, N. (2015). Financial inclusion and its determinants: The Argentine case, Working Paper No. 15/03, BBVA Research.
- United Nations Conference on Trade and Development. (2021). Financial inclusion for development: Better access to financial services for women, the poor, and migrant workers, United Nations.
- Verbeek, M. (2017). A guide to modern econometrics (Fifth edition) ed.). John Wiley& Sons,Inc.
- Wooldridge, M. (2002). Econometric analysis of cross section and panel data. The MIT Press.
- Workineh, A. (2022). Understanding financial inclusion in Ethiopia. Cogent Economics & Finance, 10:1, 2071385. https://doi.org/10.1080/23322039.2022.2071385
- World Bank. (2014). Global financial development report 2014: Financial inclusion. https://doi.org/10.1596/978-0-8213-9985-9
- Yangdol, R., & Sarma, M. (2019). Demand-side factors for financial inclusion-A cross-country empirical analysis. Sage Journals, 56(2–3). . https://doi.org/10.1177/0020881719849246.
- Yoshino, N., & Morgan, P. (2016). Overview of financial inclusion, regulation, and education. ADBI Working Paper 591. Tokyo: Asian Development Bank Institute. http://www.adb.org/publications/overview-financial-inclusion-regulation-and-education/
- Zins, A., & Weill, L. (2016). The determinants of financial inclusion in Africa. Review of Development Finance, 6(1), 46–57. https://doi.org/10.1016/j.rdf.2016.05.00
Appendix
Figure A1. Formal account ownership and use by gender.
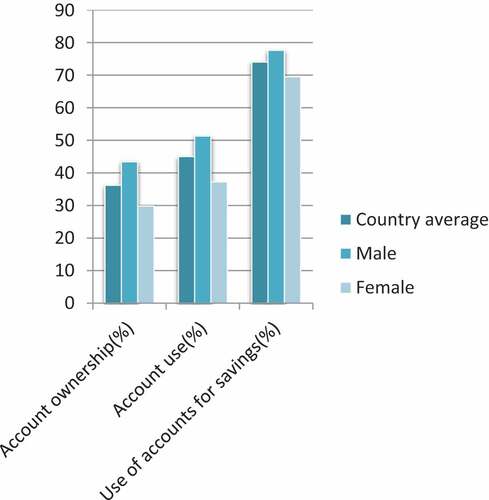
Figure A2. Formal account ownership and use by residence.
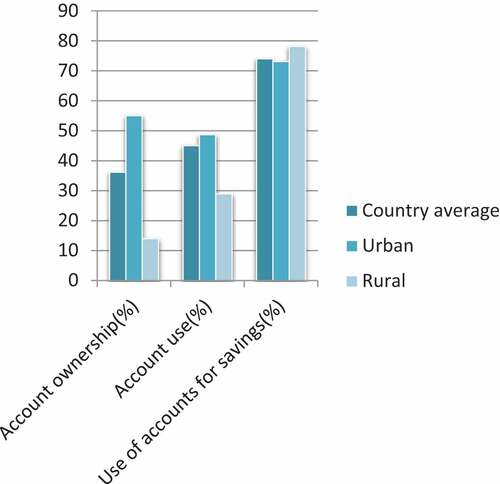
Figure A3. Formal account ownership and use by marital status.
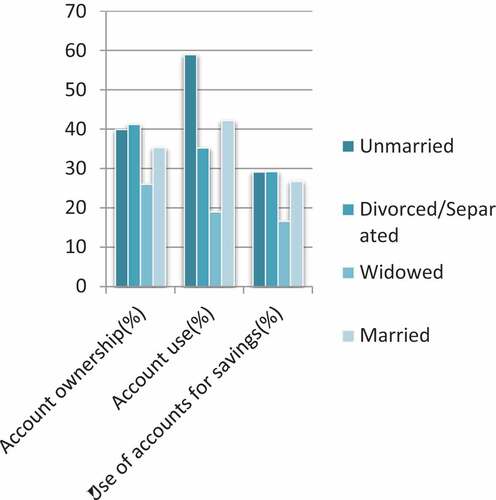
Figure A4. Formal account ownership and use by consumption quintile.
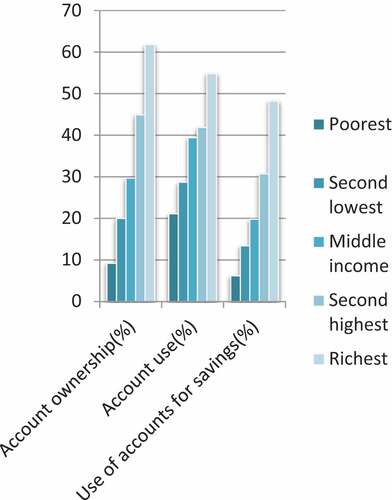
Figure A5. Formal account ownership and use by educational level.
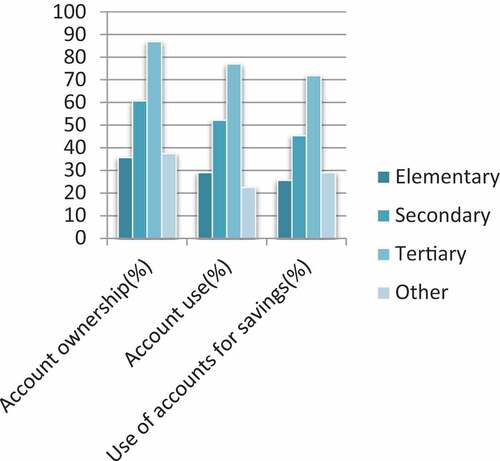
Figure A6. Formal account ownership and use by employment status.
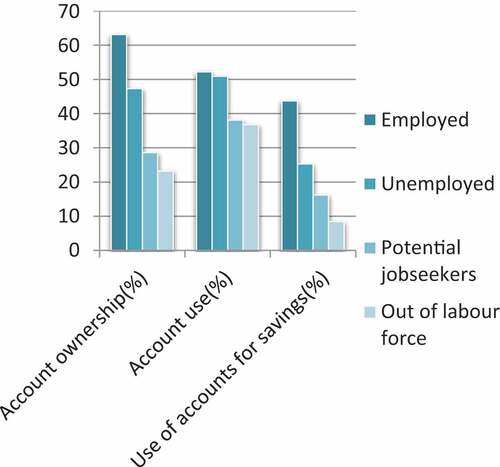
Figure A7. Formal account ownership and use by religion.
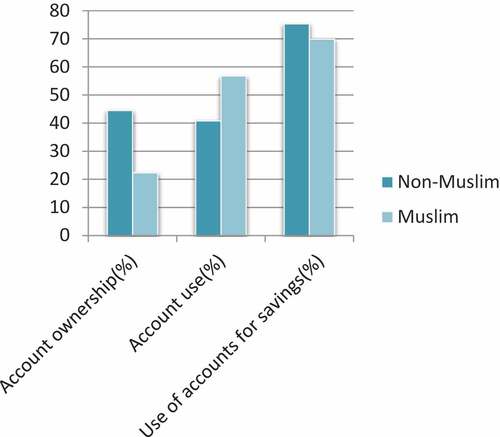
Figure A8. Formal account ownership and use by awareness level.
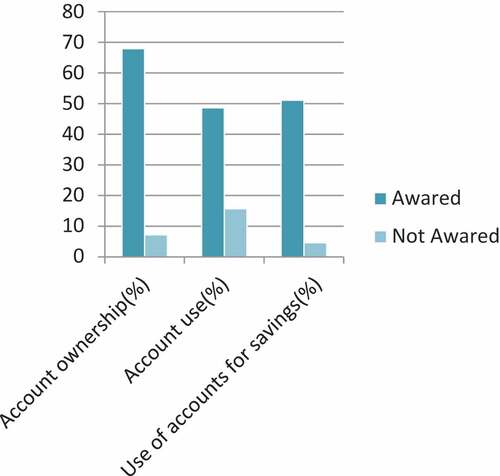
Figure A9. Formal account ownership by Regional States and City Administrations.
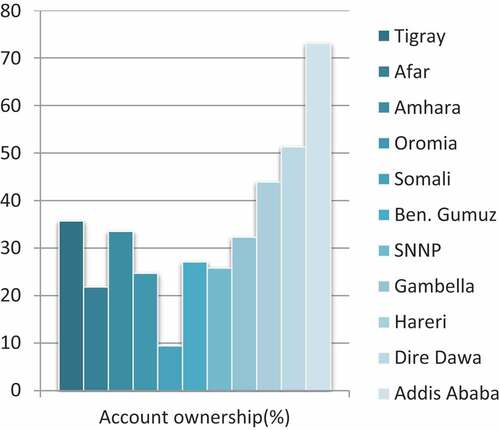
Figure A10. Formal account use by Regional States and City Administrations.
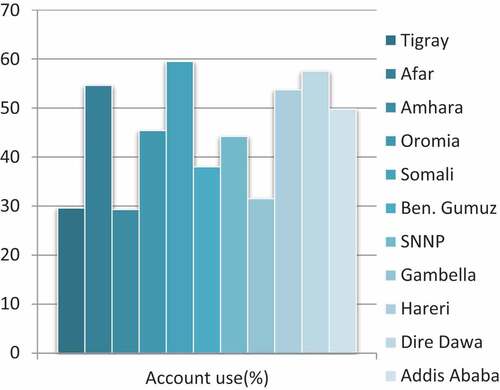
Figure A11. Regional States/City Administrations account use by financial service type.
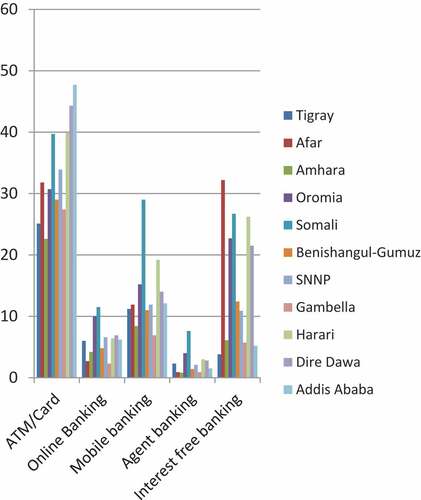
Figure A12. Formal account use for saving by Regional States and City Administrations.
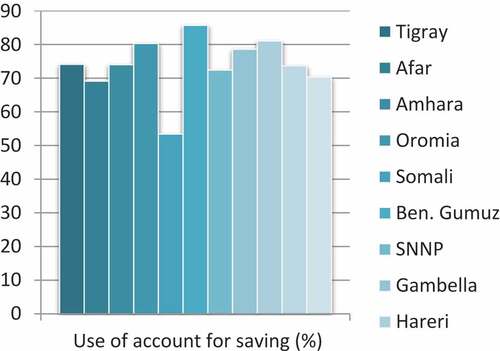
Figure A13. Reported reasons for not having an account.