
Abstract
The current series of studies examine how local food prices are affected by domestic and international factors. This research advances the existing body of knowledge by examining this effect at different quantiles, frequencies, and times. We use research data from January 1999 to August 2022 using three local and six global variables as independent variables. Additionally, our study uses recent econometric methods, including Wavelet Coherence, Quantile-on-Quantile Regression (QQR), and Granger Causality in Quantiles (GCQ). Moreover, this research uses the Quantile Regression (QR) approach to determine how reliable the findings are. Based on the GCQ approach, the results demonstrate that the correlation persists at most of the quantiles. Moreover, the WC results demonstrate a substantial association between local prices of food and the independent factors across various frequencies and times. Additionally, QQR estimates demonstrate that the impact of exogenous variables on food prices vary among quantiles. These findings are also supported by the QR method. Last but not least, our study offers policy suggestions obtained based on the results of this study.
1. Introduction
The life quality and living environment for local people is expected to increase in both developing and developed countries by sustaining socioeconomic expansion and development. Macroeconomic and financial variables like bond yields, GDP, and currency exchange rates are among the key topics that regulatory agencies focus on when assessing the market (Ayhan & Kartal, Citation2021; Uche, Chang, & Effiom, Citation2022). Nevertheless, such metrics strongly correlate with scientific advancement and economic security. Consequently, lowering such leading measures’ instability and unpredictability can improve the economy and society. Additionally, they require necessities like food (Maslow, Citation1943). Even if still significant, economic indicators and progress come second to the most pressing issues (e.g., basic needs). The value of food increases with the global population.
Food availability and distribution must be kept stable because it significantly affects people’s well-being and quality of life. Hence, the availability and supply of food directly impact food prices. Additionally, in India, a sizeable chunk of the price bundles comprises of food prices. For instance, as of July 2021, food prices comprised 25.94% of the India’s consumer price basket (Indian Statistical Institute, 2021). Consequently, changes in food prices may greatly influence the stability of food prices and financial prosperity.
Additionally, food prices have substantially increased household inflation in countries such as India. Therefore, these countries now place a greater emphasis on food pricing. The pricing development of household food in India is shown in Figure .
Figure 1. Domestic Food Prices data for India.
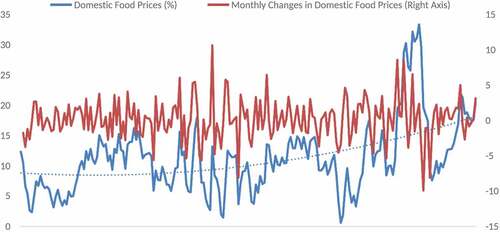
Figure illustrates India’s erratic domestic food price rise trend. Food prices increased significantly throughout some time frames, such as 2019–4 (33.23%), but modestly during others, including 2016–4 (0.58%). Food prices in India increased recently, notwithstanding a brief period of small growth. In an economic crisis, controlling food prices is frequently necessary to maintain equilibrium and avoid harm to consumers’ purchasing power and inflationary pressures.
Numerous studies investigate the connection between prices of food and local and international variables, such as fuel prices, global warming, and currency exchange rates (İ̇slam & Wong, Citation2017). While determining food prices, alternative factors have also been taken into account. These include oil prices (Kirikkaleli & Darbaz, Citation2021) and interest rates (Kara, Citation2017). Utilizing established approaches such as vector error correction models (e.g., Khatun et al., Citation2016) and vector autoregressive models (e.g., Chang, Meo, et al., Citation2019; Chang, Rajput, et al., Citation2019; Li & Li, Citation2021). Research shows that these factors affect food prices (e.g., Ali et al., Citation2022; Letta et al., Citation2021). Consequently, such results add to considering various factors while analyzing the fluctuation in food prices.
Limited research is available (such as Ertuğrul & Seven, Citation2021) that uses conventional methods to assess the relationship between regional and global variables and food prices in India. However, this relationship is yet to be properly examined using novel nonlinear methods in India. Consequently, it is crucial to use unique nonlinear methods to examine the impact of regional, local, and international variables on local prices of food in India at different frequencies, quantiles, and timeframes, as well as from effect, causation, and correlation perspectives. From these perspectives, our study fills the void in the previous research. Furthermore, this study aids decision-makers in other underdeveloped countries dealing with rising food prices. The previous research indicated that following India, other countries might achieve overall financial prosperity by controlling regional food prices (Chang, Rajput, Ahmed, et al., Citation2020; Derindag et al., Citation2022).
This study makes the following contributions to prior literature. First, this study looks how regional food prices in India are impacted by national, regional, and international factors at different frequencies, quantiles, and timeframes. Analyzing India is crucial because it shows a peculiar pattern in the rise of regional food prices. Previous literature analyzed the food prices in India (e.g., Ali et al. (Citation2022); (Uche, Chang, & Effiom, Citation2022; (Ertuğrul, Citation2021 (Chang, Gohar, et al., Citation2022). However, these investigations do not examine the food prices at various frequencies, quantiles, or times. Consequently, a complete investigation into the impact of the independent factors on regional food prices needs to be conducted. As a result, this study uses distinct nonlinear approaches such as the WC, GCQ, and QQR. Finally, the QR is employed to improve resilience. To the best of the authors’ knowledge, this is the only study that examines domestic food prices in India using the QQR, WC, and GCQ techniques.
Given that one of the main sources of inflation in India is an increase in food prices, this study chooses India for our research (Anand et al., Citation2016). Food prices make up over 43% of the Indian consumer price index. Additionally, previous studies mention that both the foreign and local variables influence inflation. Although the majority of the developing and advanced markets possess numerous fundamental characteristics, the past few years have witnessed increasingly synchronized cyclical variations (Levine, Citation2012; Mallick & Sousa, Citation2012). India’s economy is open, therefore, external and internal factors impact it (Bhattacharya et al., Citation2011). Inflation in India is primarily affected by changes in the currency rate and oil prices. Oil imports account for almost 40% of India’s overall imports. Along with the local disasters, this outside shock places significant pressure on India’s food prices. Consequently, foreign and domestic factors have been considered in this research to explain the food prices in India.
Here is a list of the remaining sections. A study overview and conceptual background are presented in Part 2. Part 3 covers the study’s objectives, methodology, and data, whereas Part 4 presents the policy recommendations, discussions, and scientific findings. The paper concluded with Part 5.
2. The conceptual background and literature review
2.1. Conceptual foundation
In this domain, there are several different underpinning theories. For example, consumer choice theory stresses how customers consume food and other items. Therefore, by affecting the quantity demanded, customer needs can influence purchasing choices, such as the food prices. Additionally, only a few researchers focus on the supply side, whereas others focus on the demand side (e.g., Sumberg & Sabates-Wheeler, Citation2011). These fundamental hypotheses illustrate the theoretical association between independent factors and food prices.
The theoretical association between local prices of food and independent (international and local) factors are supported by previous studies. There are several reasons why local, regional, and international variables influence food prices. For instance, a rise in interest rates lowers the company’s ability to take on debt. As a result, businesses need more capacity to take out loans and use them to produce food-related goods. Consequently, the price of items associated with food rises when the supply of such goods declines.
Like this, increasing oil prices raise the price of food-related goods by driving up the cost. Likewise, the cost of raw materials rises, so do the prices of food-related items. Hence, international and national variables, such as temperature, FX rate, fertilizer prices, raw material prices, interest rate, country risk, volatility index, oil prices, and uncertainty in economic policy, influence local food prices through various channels. The literature review section further discusses the relationship between the factors involved. Mitchell (Citation2008), for instance, looked into what led to the abrupt rise in food prices in international markets. Likewise, Baffes and Dennis (Citation2013) looked into the long-term factors influencing food prices.
2.2. Literature review
Many academics look into the relationship between various exogenous variables and food prices. These variables are split into two groups, international and national. We start by discussing international factors like uncertainty, raw material pricing, energy (oil) prices, economic policy uncertainty, the weather, and fertilizer prices. For instance, studies by Wen et al. (Citation2021 Li and Li (Citation2021), Xiao et al. (Citation2019), Gohar, Bagadeem, et al. (Citation2022), and Wen et al. (Citation2021) looked at the relationship between prices of food prices and the unpredictability of economic policy. Using the time-varying parameter vector autoregression (TVP-VAR) method, Xiao et al. (Citation2019) investigated the impact of uncertainty in the economic (EPU) on prices of food in India. Their research indicates that EPU has a considerable impact on grain futures prices.
Additionally, Li and Li (Citation2021) examined the EPU impact on food prices in India while employing the TVP-SV-VAR approach. Researchers discovered that rising trade costs and declining overall imports cause food prices to rise due to economic policy uncertainties. Likewise, Wen et al. (Citation2021) looked into the impact in India using the nonlinear ARDL technique. They discovered that negative fluctuations in policy uncertainty have a higher influence prices of food compared to positive fluctuations in policy uncertainty.
Other latest evidence (Zhang & Qu, Citation2015; Salisu et al., Citation2017; Nazliolu & Soytas, Kirikkaleli & Darbaz, Citation2021; Pal & Mitra, Citation2019; 2011; Gilbert, Citation2010; Taghizadeh-Hesary et al., Citation2019; Wen et al., Citation2021) look into the connection between food and energy prices. Similarly, the dynamic conditional correlation (DCC) approach was used by Pal and Mitra (Citation2019) to assess the impact of gasoline prices on agricultural output in the US. Another research employing the panel VAR technique was carried out by Taghizadeh-Hesary et al. (Citation2019) in eight Asian nations. Researchers discovered that energy prices had a significant impact on food prices.
Likewise, Wen et al. (Citation2021) investigated India based on nonlinear ARDL method and discovered that oil price movements benefit food prices. Additional studies on the subject were conducted by Baltzer et al. (Citation2008), Abbott et al. (Citation2008), Gohar, Bhatty, et al. (Citation2022, Citation2022) Citation2008), and Ott (Citation2012). Mitchell (Citation2008) claimed that, in the United States, food prices raised because of higher input costs. In addition, Ott (Citation2012) used the VAR technique for analyzing the impact of fertilizer prices on world food prices and discovered a clear correlation between the two. The same conclusions were reached by Baltzer et al. (Citation2008) and Abbott et al. (Citation2008).
Weather and climate variables’ effects on food costs has been studied by Hirvonen (Citation2016), Maydybura et al. (Citation2022), D’agostino and Schlenker (Citation2016), Letta et al. (Citation2021), Schlenker and Roberts (Citation2006), Schnepf (Citation2008), Quiggin (Citation2007), and Dercon (Citation2004). Australia’s grocery prices are affected by global warming, according to (Quiggin, Citation2007 research. Furthermore, Schnepf (Citation2008) concluded that having less supplies and stocks due to severe weather affects food prices. Likewise, Letta et al. (Citation2021) used econometric models in the context of India to conclude that bad weather increases farm production prices by lowering productive capacity. Moreover, it was determined by Wang et al. (Citation2022), D’agostino and Schlenker (Citation2016), Hirvonen (Citation2016), Peng et al. (Citation2022), Schlenker and Roberts (Citation2006), and Dercon (Citation2004) that there is a significant correlation between agricultural prices and weather anomalies. According to their study, agricultural prices increase when the weather and climate deteriorate. Since climate changes cause shortfalls and decreased crop yield, temperature swings are recorded by meteorological and ecological indicators.
The next group of studies uses local factors including interest rates, exchange rats and country risk. The relationship between food prices and exchange rates was studied by Khatun et al. (Citation2016), Verbicki (Citation2021), and Kornher and Kalkuhl (Citation2013). For example, Kornher and Kalkuhl (Citation2013) used the GMM approach in the chosen nations and concluded that food prices and exchange rates are significantly correlated. Khatun et al. (Citation2016) also conducted a study in Bangladesh and used the Vector Error Correction Model (VECM) method to examine how foreign exchange rates affect food prices. Investigators concluded that the two had a positive connection with each other.
Verbicki (Citation2021), on the other hand, asserted that prices of foods in the nations of the European Union (EU) are unaffected by currency rates. In addition, research by Campos (Citation2020), Kara (Citation2017), Arango et al. (Citation2012) Baffes and Dennis (Citation2013), and Gohar, Chang, et al. (Citation2022) indicated a substantial correlation between interest rates and the food prices. Moreover, using the OLS method, Baffes and Dennis (Citation2013) examined the relationship between Thai bond yields and food prices. They concluded that food prices and interest rates are significantly related. According to Campos (Citation2020), interest rates and agricultural commodity prices have a U-shaped relationship. Researchers also concluded that if interest rates go up, food prices will likely rise as well.
Our study adds country risk as an essential component to the domestic factors since it is plausible that rise in the country risk causes a rise food prices. For instance, panel data across 120 nations were used by Arezki and Bruckner (Citation2011) in their research. The study concluded that the correlation between political turmoil and food prices is positive, where political turmoil is defined as the deterioration of representative democracy. A brief overview of the scientific research on prices of foods may be found in Table .
Table 1. Description of the variables
In our research, nine separate parameters are taken into account. A list of the variables employed in the research is presented in Table .
Table 2. Brief discussion of the empirical studies
2.3. Evaluation of the literature
The literature reviewed states that various studies have looked at food prices. Consequently, many independent variables—both international and national—are employed in this study. The level of production (price of raw materials, temperature, fertilizer, and oil), price shocks, and volatility (country risk, interest rates, and exchange rates) are the primary explanatory factors utilized in this study. While several of these factors, including currency exchange rates and temperature, affect food prices in the long-term, others, like the cost of fertilizer and gasoline, may have a short-run effect.
In addition, these studies employ econometric techniques to assess food prices, including causality (Granger, Toda-Yamamoto) ARDL, nonlinear ARDL, GARCH, GMM, Regression (OLS), TVP-VAR, TVP-SV-VAR, VECM, DCC, and Panel VAR. In order to progress in the area, contemporary and innovative nonlinear approaches could be used in the future. The researchers also think that there needs to be more literature that stresses food prices in India by considering a variety of explanatory variables and using special nonlinear approaches. As a consequence, the following series of hypotheses are tested in this study. This study uses unique nonlinear approaches to examine the effects of selected international and domestic explanatory variables on local food prices in India:
Hypothesis 1: There is a significant connection between prices of foods and national and international factors like the volatility index, oil prices, interest rate, the FX rate, the cost of fertilizer, the cost of raw materials, and the country risk in question.
Hypothesis 2: The connection between prices of foods and exogenous (domestic and international) variables like the country risk, raw material prices, temperature, fertilizer prices, volatility index, oil prices, and FX rate differs at different causation levels.
Hypothesis 3: The association between explanatory (domestic and international) factors and food prices varies at various frequencies, quantiles, and times, including FX rate, interest rate, fertilizer prices, raw material prices, volatility index, economic policy uncertainty, oil prices, temperature, and country risk.
As a result, this research contributes to the literature by illuminating the connection between independent factors and prices of foods across various frequencies, quantiles, and timeframes. Our analyses also include policy suggestions for India and rest of the nations.
3. Research objectives, methodology and data
3.1. Research objective
The following objectives are achieved while conducting this study:
To analyze whether the impact of independent factors on local prices of foods varies over various quantiles frequencies, and, times.
To analyze whether the advanced techniques bring any changes in the findings of the existing literature
To describe the association between different independent (national and international) factors and local food prices,
To establish the causality between the local food prices and explanatory factors,
3.2. Data
The time frame for this study is from January 1999 to August 2022. Considering the local issues in India in 2000 and 2001 and their long-lasting adverse effects in the years that followed, notably 2002 and 2003, this time frame was selected to include a sizable period. The researchers used Bloomberg (Citation2021) to obtain data related to the CDS spreads factors, oil prices, volatility index, USD/INR FX rates, and economic policy uncertainty index. In addition, the authors used CBRT (Citation2021) is used to collect data on interest rates and local food prices.
Additionally, Berkeley (Citation2021) is used to collect data for the temperature. Data for the fertilizer price index and raw material price are gathered using the WB (Citation2021). Since India releases food price data every month, this research investigates monthly data for the variables.
4. Methodology
The empirical analysis is conducted using the steps listed below:
The dataset and the procedure for gathering data are examined in the present study’s first and second stages.
The baseline statistics are shown and examined in the third stage.
The fourth stage offers unit root tests to examine the variables’ stationarity characteristics. In the current study, Philip & Perron (PP) and Augmented Dickey-Fuller (ADF) tests and the have been used (PP, 1988; Dickey & Fuller, Citation1979).
In the fifth step, we investigate the variables’ linearity conditions. For the linearity purpose, this research uses the BDS test (Broock et al., Citation1996).
The WC technique is applied in the sixth phase. By considering both frequencies and times, this approach considers the relationship between the components (Goupillaud et al., Citation1984; Torrence & Compo, Citation1998).
The correlation between the provided factors across various quantiles is analyzed in the seventh stage using the GCQ and QQR approaches (Troster, Citation2018; Sim et al., Citation2015).
The QR is utilized in the eighth phase to assess the QQR results’ reliability (Koenker, Citation2005).
Finally, analysis and practical recommendations are then presented. The future research directions and limitations of this study are also mentioned.
Nonlinear methods should be used when results indicate that the factors are not linear (Kirikkaleli, Citation2021). The key benefit of the nonlinear methods include the lack of requirements for stationarity of the variables at the same of integration (Kartal et al., Citation2021; Torrence & Compo, Citation1998). By taking into account the properties of the variables, such as linearity criteria and stationarity techniques, the GCQ, QQR, and WC are used. The QR method is also used to test the reliability of QQR results.
The approaches used in the investigation are briefly addressed to save the space. References like Koenker (Citation2005) related to the QR approach and Troster (Citation2018) regarding the Granger causality in quantile technique can be used to get more specific information about the techniques. For the BDs test refer to Broock et al. (Citation1996), for the PP unit root test refer to Citation1988), and for the ADF unit root test refer to Dickey and Fuller (Citation1979). In addition, Torrence and Compo (Citation1998), Citation2015) for the QQR technique, and Goupillaud et al. (Citation1984) for the WC approach.
5. Analysis of findings
5.1. An initial analysis
Table mentions the descriptive analysis of the factors used in this research.
Table 3. Descriptive statistics
The mean FOOD value is 12%, whereas its standard deviation is 6.58, as shown in Table . The Jarque-Bera technique shows that the factor FOOD is not able to conform to the assumptions of normality. Similar to this, most of the additional study’s factors—except TEMPERATURE—do not adhere to the normality condition. According to the coefficient of variance, USD/INR have comparatively higher variability (larger than 50%) than other variables. In contrast, RAW and TEMPERATURE are less volatile than the other variables.
5.2. The linearity and the stationarity estimates
The variable-related stationarity is further investigated after the descriptive statistics of the variables. The results based on the unit root test at first difference and level are shown in Table . The findings related to the ADF stationarity technique show that RAW, OIL, FERTILIZER, USD/INR, and FOOD are stationary at I(1). In contrast, VIX, TEMPERATURE, CDS, INTEREST, and UNCERT are stationary at I(0). Moreover, the estimates based on the PP test also produces consistent findings. The characteristics of the variables used in this research have been evaluated using the linearity analysis. Table displays the results of the linearity test.
Table 4. Results for stationarity tests
Table 5. Results for the BDS linearity test
The BDS test indicates that the variables do not conform to the assumption of linearity. This test shows that there is not enough data to oppose the null hypothesis. Thus, nonlinear analytic metrics like GCQ, QQR, and WC are selected. The robustness of the QQR results is also evaluated using the QR technique.
5.3. The results based on WC estimates
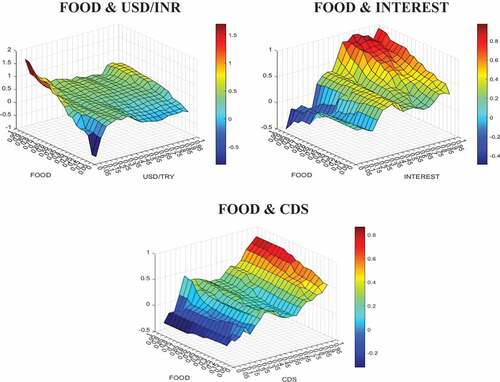
The WC method reveals the feedback connection between independent factors and regional prices of foods by considering varying frequencies and times. This method is premised on preliminary evaluations of the variables, in which the preliminary evaluation was built using the linearity and the normality test and linearity test statistics. The results found while employing the WC technique are shown in Figure . Such results are supported by earlier research (Chang & Rajput, Citation2018; Chang et al., Citation2018; Chang, Citation2020).
Figure 2. The WC Results.
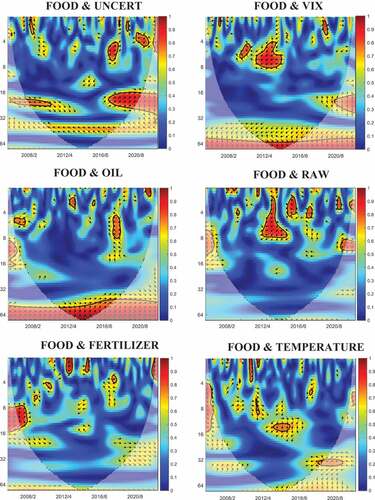
Figure 2. (Continued).
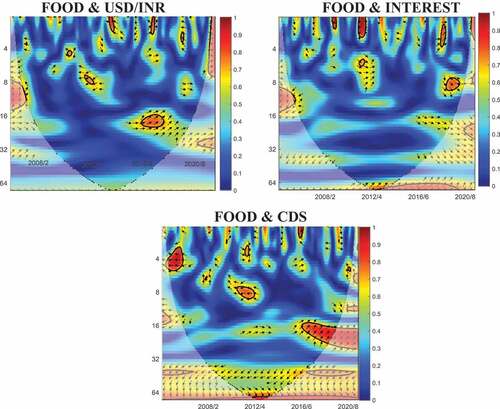
The WC approach showed a crucial connection between the regional food prices and explanatory factors. More specifically, the long-term connection between UNCERT and FOOD has been found up until the first quarter of 2012. Furthermore, positive short-term and long-run interactions between UNCERT and FOOD are seen after 2015. However, since 2004 it has been observed that UNCERT has a detrimental impact on food. Additionally, analyzing the bidirectional relationship between FOOD, RAW and VIX, results show that from 2010 to 2013, VIX and RAW hurt FOOD. These results are consistent with the past studies by Hashmi and Chang (Citation2021) and Uche, Chang, and Gohar (Citation2022)
On the other hand, at the beginning of 2004, VIX and FOOD has a long-term adverse impact on one another. During 2004, VIX lags FOODS. In 2016, the correlation between OIL and FOOD demonstrated that FOOD has a long-term positive impact on OIL while having a short-term adverse effect. The feedback association between FOOD and USD/INR from 2010 to 2012 reveals a transiently unfavorable connection. Nevertheless, previous studies found inconsistent findings (Hashmi & Chang, Citation2021; Hashmi et al., Citation2022; Hashmi, Chang, & Shahbaz, Citation2021; Syed et al., Citation2019).
Nonetheless, the long-term impact is positive after 2012. Both in the long and short-run, FOOD has a positive influence on INTEREST. Examining the association between FOOD and TEMPERATURE reveals that, starting in 2008, FOOD prices were strongly affected by TEMPERATURE. However, the robust relationship from 2008 to 2020 converted from short-term to long-term. Moreover, compared to other relevant components, interactions between CDS and FOOD are more difficult. There is an unfavorable correlation between CDS and FOOD. Additionally, before the middle of 2012, FOOD induced CDS in the short term previous studies like Derindag et al. (Citation2022); Gohar, Bagadeem, et al. (Citation2022) also provide consistent findings.
However, starting in 2012, CDS eventually started to lead to FOOD. After 2017, this effect is especially crucial in the long run. Additionally, CDS has a long-term detrimental effect on FOOD from 2004 to 2020. Furthermore, Uche, Chang, and Gohar (Citation2022) and Hashmi and Chang (Citation2021) provide consistent findings.
5.4. Results of QQR and GCQ techniques
A substantial feedback connection between predictor variables and FOOD is revealed while using these techniques. As a result, the GCQ method is utilized to evaluate causation in quantiles to identify specific quantiles that significantly affect the outcome variables. The results of the GCQ approach are displayed in Table .
Table 6. The GCQ results
Table demonstrates that, at a 5% significance level, all quantiles based on the Granger causality from the predictors are found significantly related with the FOOD, except the 0.10, 0.40, 0.50, 0.55, and 0.60 quantiles. These findings suggest that a substantial feedback association between the independent factors and prices of the foods for most quantiles. Nevertheless, the insignificance of a few quantiles implies that the extent of the food prices in the Indian marketplaces determines the association between food prices and the rest of the exogenous factors. After the granger causality in quantile methodology, the relationship between the food prices and independent factors over various quantiles of is then evaluated using the QQR technique. Figure , where the x and y axes are the tth quantile coefficient of the food price and the qth quantile coefficient of the predictor factors, illustrates the relationship.
Figure 3a. The findings based on QQR technique.
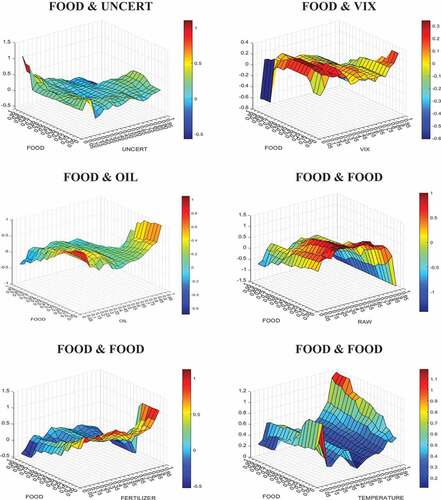
Figure 3b. (Continued).
Aside from the area where the smallest UNCERT and highest FOOD quantiles are combined, the estimations show that the UNCERT has a moderately beneficial impact on food. Additionally, UNCERT significantly affects food in regions where both components’ quantile coefficients are greater than 0.8. Like the connection between UNCERT and food, VIX has a detrimental impact on food. Additionally, from the lowest to the highest quantiles, the impact grows. Furthermore, the results demonstrate that OIL and FERTILIZER have the same effects on FOOD. The magnitude to which these factors affect FOOD, on the other hand, differs. Particularly, in regions where the significance of the food quantiles is more than 0.5, the detrimental influence of OIL on FOOD rises from lower to higher quantiles of OIL. However, these results are not supported by Chang, Gohar, et al. (Citation2022, Citation2022); Maydybura et al. (Citation2022)
On the contrary, where the FOOD quantiles are less than 0.5 and the upper and lower quantiles of the OIL, the effect of OIL on FOOD is positive and significant. Furthermore, the relationship between food and fertilizer is more significant than between food and oil. Whenever the relationship involving FOOD and RAW is investigated, it is shown that RAW has a favorable effect on FOOD. This effect is noticeably greater from low to extremely high RAW quantiles in each FOOD quantile. This conclusion is backed by earlier studies (Bhat et al., Citation2018; Kotyza et al., Citation2021; Chang, Rajput, Bhutto, et al., Citation2020, Chang et al., 2020b).
The relationship between TEMPERATURE and FOOD is observed in a U-shape, comparing RAW and FOOD. It suggests that the biggest and smallest quantiles of temperature have a substantial and positive impact on food. However, it is discovered to need improvement in the middle quantiles. The correlation between USD/INR and FOOD is negligible, except for the smallest (less than 0.4) and highest (greater than 0.6) quantiles. However, the relationship between CDS and FOOD and INTEREST vs. FOOD is strikingly similar. From smaller to the upper quantiles, INTEREST and CDS impact on food increases, more pronounced at the greatest quantile.
5.5. QR test for the resiliency of QQR findings
This section compares the QQR and QR coefficients to determine their reliability. The QQR and QR estimates over various quantiles are compared in Figure .
Figure 4a. QR estimates to check the Robustness of QQR results.
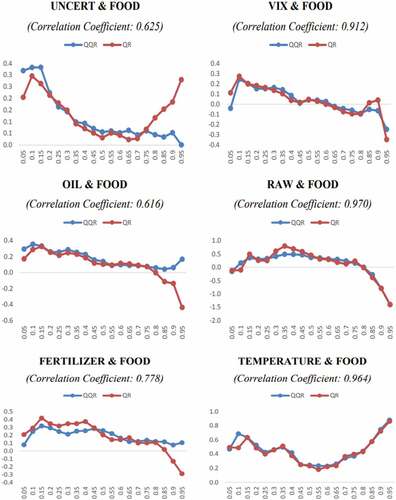
Figure 4b. (Continued).
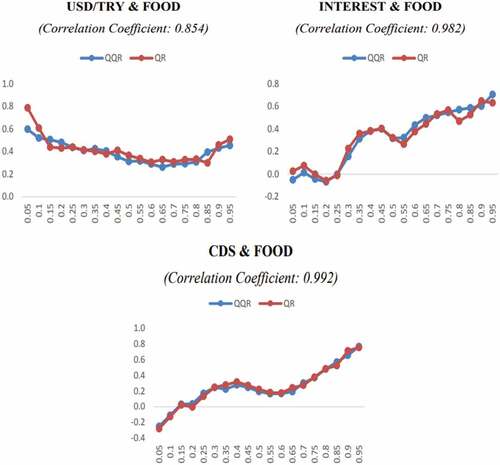
Figure demonstrates the strong statistical significance of the association between the QQR and QR approaches. In addition, the correlation coefficients for the USD/INR, INTEREST, VIX, TEMPERATURE, CDS, and RAW impact on FOOD are highly significant and above 0.80.
5.6. Discussion and policy recommendations
Three hypotheses have been proposed based on the objectives of this study. The key components are listed below while we examine those hypotheses. First, local food prices increase due to an increase in the exogenous variables. Second, there is a causation interaction between the exogenous factors (domestic and international) and regional food prices. Third, there are differences in the relationship between exogenous variables and national food prices over time, frequency, and quantiles. Fourth, there is a nonlinear relationship between exogenous variables and regional food prices.
Except for the few upper intermediate and lower quantiles of several exogenous variables, there is a link between local food prices and exogenous variables throughout all quantiles. The findings vary depending on the factors selected. Our results support the hypotheses put forth in this work using cutting-edge nonlinear methods. The general conclusions drawn from nonlinear approaches are typically consistent with the presumptions and conclusions of previous studies (For example, Campos, Citation2020; Kirikkaleli & Darbaz, Citation2021; Letta et al., Citation2021; Ott, Citation2012; Verbicki, Citation2021; Wen et al., Citation2021). According to this research, the Government of India and other interested parties must consider exogenous factors (domestic and international) when formulating and implementing policies.
Because food prices comprise the majority of inflationary indices (25.94%), India might benefit from regulated regional food prices, especially if inflation picks up (TSI, Citation2021). Similarly, other emerging economies may benefit from India’s experience while implementing this study’s policy recommendations. As local factors may typically be managed, the main issue is that India needs to consider the factors that occur at the regional level and significantly affect regional food prices. Equally, India must address the rise in domestic food prices and consider it a key fundamental government policy. Second, India should tackle CDS spreads. India can lower the danger to its finances, politics, and economy by taking appropriate measures, such as structural adjustment. Consequently, the country’s risk could be mitigated without negatively impacting domestic food prices. Additionally, lowering country risk contributes to the stability of inflation, interest rates, and currency exchange rates.
Third, India must manage domestic variables like foreign exchange and interest rates. While India lowers the nation’s risk, capital inflows (portfolio and direct) may increase. In this scenario, constancy may be provided by FX rates. By maintaining its risk and currency rates, India could reduce interest rates, inflation, and food prices. In order to encourage inflation and control food prices, favorable trends in country risk, FX rates, and interest rates could be created.
Fourth, fertilizer prices greatly influence regional food prices, especially in the higher fertilizer price quantiles. In light of this view, India must also concentrate on producing natural fertilizers. It also must take into account an increase in the usage of native fertilizer in the production of food. Consequently, India could not be significantly impacted by changes in fertilizer prices worldwide. Fifth, raw materials’ cost greatly influences local food prices. Like fertilizer, India might investigate producing domestic raw materials for food production to reduce the unfavorable global prices of raw materials.
Sixth, considering the harmful consequences of global warming, reducing greenhouse gas emissions is essential, as shown by the change in temperature in this study. Ecological accords like the Paris Agreement and Kyoto Protocol can assist this situation. Therefore, it is crucial to implement environmental treaties and participate in them. Indian cooperation in the Paris accord is also well regarded. It was expected that the key regulations would be followed and that India and some other countries’ initiatives would reduce global warming. Seventh, India also should take instability and bizarre behavior into consideration. India may have an enormous influence on market uncertainty, but it also has the power to lessen domestic instability and ambiguity.
Other econometric methodologies, such as WC, GCQ and QQR methods, provide additional information about the impact of the exogenous variables on nationwide food prices, although compatible with one another. Therefore, it is highly recommended that data assessment in innovative policy development and implementation methods use many methodologies. Other tactics also offer thorough information that can be used to create more detailed plans. By reducing the detrimental effects of the variables, the development and successful use of appropriate procedures considering the country’s economic system and realities may aid India’s dependable regional food prices.
6. Conclusion
This study utilizes cutting-edge approaches to examine how regional food prices in India are impacted by regional, national, and international factors. In this regard, nine factors are used. In addition, our research makes use of monthly data from January 1999 to August 2022. Consequently, a comprehensive analysis is conducted to study the effects of the exogenous variables on the local food prices at various frequencies, quantiles, and timeframes. The results indicate that a relationship between independent variables and local food prices exists at different frequencies, quantiles and times.
In brief the results indicate that the relationship exists over most quantiles, except for a few variables at the highest, middle, and lowest quantiles. Additionally, different quantiles determine to what extent the exogenous factors impact regional food prices. The QR results further support the reliability of the QQR estimates used in this study. Overall, the results of this study are solid and consistent with theories and the existing body of knowledge.
The current investigation is the first to assess local food prices in India using the QQR, WC, and GCQ techniques. The results show how both domestic and international variables affect regional food prices. The results of cutting-edge nonlinear econometric approaches lead to several useful recommendations. First, food prices should be considered major because they impact large-scale variables like interest rates and inflation. The second concern is lowering the country’s risk to stabilize FX rates and boost international investment inflows. As a result, India’s structures and economic realities must be considered when developing and implementing policy.
As previously mentioned, this study complements available research in several ways, but it also has some drawbacks. India is the main focus of the investigation. However, several developing and developed countries have experienced a rise in regional food prices, which may be the subject of future studies. Algorithms for machine learning are one example of additional statistical and economic methods that could be applied. Moreover, switching models can also be used to explain that there are changes in the significance and strength of the relationship between food prices and selected macroeconomic variables.
Acknowledgments
The fourth author would like to thank Robert B. Miller and Howard E. Thompson for their continuous guidance and encouragement. This research has been supported by Asia University, China Medical University Hospital, The Hang Seng University of Hong Kong, Research Grants Council (RGC) of Hong Kong (project numbers 12502814 and 12500915), and the Ministry of Science and Technology (MOST, Project Numbers 106-2410-H-468-002 and 107-2410-H-468-002-MY3), Taiwan.
Disclosure statement
No potential conflict of interest was reported by the authors.
Additional information
Funding
References
- Abbott, P. C., Hurt, C., & Tyner, W. E. (2008). What’s driving food prices? Farm Foundation Issue Report, No. 741-2016-51224.
- Ali, W., Gohar, R., Chang, B. H., & Wong, W. K. (2022). Revisiting the impacts of globalization, renewable energy consumption, and economic growth on environmental quality in South Asia. Advances in Decision Sciences, 26(3), 78–23.
- Anand, R., Kumar, N., & Tulin, V. (2016). Understanding India’s food inflation: The role of demand and supply factors. IMF Working Paper, 16(2), 1. https://doi.org/10.5089/9781513581347.001
- Arango, L. E., Arias, F., & Flórez, A. (2012). Determinants of commodity prices. Applied Economics, 44(2), 135–145. https://doi.org/10.1080/00036846.2010.500273
- Arezki, M. R., & Bruckner, M. (2011). Food prices and political instability. International Monetary Fund Working Paper, No. 11/62.
- Ayhan, F., & Kartal, M. T. (2021). The macroeconomic drivers of non-performing loans (NPL): Evidence from selected countries with heterogeneous panel analysis. MANAS Social Sciences Journal, 10(2), 986–999. https://doi.org/10.33206/mjss.800648
- Baffes, J., & Dennis, A. (2013). Long-term drivers of food prices. In Gillson, I., & Fouad, A. (Eds.), Trade Policy and Food Security (pp. 17). World Bank.
- Baltzer, K., Hansen, H., & Lind, K. M. (2008). A Note on the Causes and Consequences of the rapidly increasing international food prices. University of Copenhagen, Institute of Food and Resource Economics, 56–78.
- Berkeley. (2021). Temperature, http://berkeleyearth.lbl.gov/auto/Global/Complete_TAVG_daily.txt, August 26, 2021.
- Bhat, J. A., Ganaie, A. A., & Sharma, N. K. (2018). Macroeconomic response to oil and food price shocks: A structural var approach to the Indian economy. International Economic Journal, 32(1), 66–90. https://doi.org/10.1080/10168737.2018.1446038
- Bhattacharya, R., Patnaik, I., & Shah, A. (2011), Monetary policy transmission in an emerging market setting, IMF Working Paper 11/5.
- Bloomberg. (2021). Bloomberg Terminal. August 26, 2021.
- Broock, W. A., Scheinkman, J. A., Dechert, W. D., & LeBaron, B. (1996). A test for independence based on the Correlation Dimension. Econometric Reviews, 15(3), 197–235. https://doi.org/10.1080/07474939608800353
- Campos, B. C. (2020). Are there asymmetric relations between real interest rates and agricultural commodity prices? testing for threshold effects of us real interest rates and Adjusted Wheat, Corn, and Soybean Prices. Empirical Economics, 59(1), 371–394. https://doi.org/10.1007/s00181-019-01636-1
- CBRT. (2021). Electronic Data Distribution System, https://evds2.tcmb.gov.tr/index.php?/evds/serieMarket, August 26, 2021.
- Chang, B. H. (2020). Oil prices and E7 stock prices: An asymmetric evidence using multiple threshold nonlinear ARDL model. Environmental Science and Pollution Research, 27(35), 1–12. https://doi.org/10.1007/s11356-020-10277-2
- Chang, B. H., Derindag, O. F., Hacievliyagil, N., & Canakci, M. (2022). Exchange rate response to economic policy uncertainty: Evidence beyond asymmetry. Humanities and Social Sciences Communications, 9(1), 1–14. https://doi.org/10.1057/s41599-022-01372-5
- Chang, B. H., Gohar, R., Derindag, O. F., & Uche, E. (2022). COVID-19, lockdown measures and their impact on food and healthcare prices: Empirical evidence using a dynamic ARDL model. Journal of Economic Studies, (ahead-of-print). https://doi.org/10.1108/JES-12-2021-0627
- Chang, B. H., Meo, M. S., Syed, Q. R., & Abro, Z. (2019). Dynamic analysis of the relationship between stock prices and macroeconomic variables. South Asian Journal of Business Studies, 8(3), 229–245. https://doi.org/10.1108/SAJBS-06-2018-0062
- Chang, B. H., & Rajput, S. K. O. (2018). Do the changes in macroeconomic variables have a symmetric or asymmetric effect on stock prices? Evidence from Pakistan. South Asian Journal of Business Studies, 7(3), 312–331. https://doi.org/10.1108/SAJBS-07-2018-0077
- Chang, B. H., Rajput, S. K. O., Ahmed, P., & Hayat, Z. (2020). Does gold act as a hedge or a safe haven? Evidence from Pakistan. Pakistan Development Review, 59(1), 69–80. https://doi.org/10.30541/v59i1pp.69-80
- Chang, B. H., Rajput, S. K. O., & Bhutto, N. A. (2019). Impact of exchange rate volatility on the US exports: A new evidence from multiple threshold nonlinear ARDL model. Journal of International Commerce, Economics and Policy, 10(02), 1950009. https://doi.org/10.1142/S1793993319500091
- Chang, B. H., Rajput, S. K. O., Bhutto, N. A., & Abro, Z. (2020). The asymmetric effect of extreme changes in the exchange rate volatility on the US imports: Evidence from multiple threshold nonlinear ARDL model. Studies in Economics and Finance, 37(2), 293–309. https://doi.org/10.1108/SEF-03-2019-0122
- Chang, B. H., Rajput, S. K. O., & Ghumro, N. H. (2018). Asymmetric impact of exchange rate changes on the trade balance: Does global financial crisis matter? Annals of Financial Economics, 13(04), 1850015. https://doi.org/10.1142/S201049521850015X
- D’agostino, A. L., & Schlenker, W. (2016). Recent weather fluctuations and agricultural yields: Implications for climate change. Agricultural Economics, 47(S1), 159–171. https://doi.org/10.1111/agec.12315
- Dercon, S. (2004). Growth and Shocks: Evidence from Rural Ethiopia. Journal of Development Economics, 74(2), 309–329. https://doi.org/10.1016/j.jdeveco.2004.01.001
- Derindag, O. F., Chang, B. H., Gohar, R., & Salman, A. (2022). Exchange rate effect on the household consumption in BRICST Countries: Evidence from MATNARDL Model. Journal of International Commerce, Economics and Policy, 13(02), 2250010. https://doi.org/10.1142/S1793993322500107
- Dickey, D. A., & Fuller, W. A. (1979). Distribution of the estimators for autoregressive time series with a unit root. Journal of the American Statistical Association, 627, 74(366a), 427–431. https://doi.org/10.1080/01621459.1979.10482531
- Ertuğrul, H. M. (2021). The local currency oil price and food price relationship for Turkey: A dynamic correlation and time-frequency dependency analysis. International Journal of Monetary Economics and Finance, 14(3), 233–248. https://doi.org/10.1504/IJMEF.2021.116542
- Ertuğrul, H. M., & Seven, Ü. (2021). Dynamic spillover analysis of International and Turkish Food Prices. International Journal of Finance & Economics. https://doi.org/10.1002/ijfe.2517
- Gilbert, C. L. (2010). How to understand high food prices. Journal of Agricultural Economics, 61(2), 398–425. https://doi.org/10.1111/j.1477-9552.2010.00248.x
- Gohar, R., Bagadeem, S., Chang, B. H., & Zong, M. (2022). Do the income and price changes affect consumption in the emerging 7 countries? empirical evidence using quantile ardl model. Annals of Financial Economics, 2250024(04). https://doi.org/10.1142/S2010495222500245
- Gohar, R., Bhatty, K., Osman, M., Wong, W. K., & Chang, B. H. (2022). Oil prices and sectorial stock indices of Pakistan: Empirical evidence using bootstrap ARDL model. Advances in Decision Sciences, 26(4), 1–27.
- Gohar, R., Chang, B. H., Derindag, O. F., & Abro, Z. (2022). Nexus between consumption, income, and price changes: Asymmetric Evidence from NARDL Model. ETIKONOMI, 21(2), 213–228. https://doi.org/10.15408/etk.v21i2.23339
- Gohar, R., Salman, A., Uche, E., Derindag, O. F., & Chang, B. H. (2022). Does us infectious disease equity market volatility index predict g7 stock returns? evidence beyond symmetry. Annals of Financial Economics, 2250028. https://doi.org/10.1142/S2010495222500282
- Goupillaud, P., Grossmann, A., & Morlet, J. (1984). Cycle-Octave and related transforms in seismic signal analysis. Geoexploration, 23(1), 85–102. https://doi.org/10.1016/0016-71428490025-5
- Hashmi, S. M., & Chang, B. H. (2021). Asymmetric effect of macroeconomic variables on the emerging stock indices: A quantile ARDL approach. International Journal of Finance & Economics, 28(1), 1006–1024. https://doi.org/10.1002/ijfe.2461
- Hashmi, S. M., Chang, B. H., Huang, L., & Uche, E. (2022). Revisiting the relationship between oil prices, exchange rate, and stock prices: An application of quantile ARDL model. Resources Policy, 75, 102543. https://doi.org/10.1016/j.resourpol.2021.102543
- Hashmi, S. M., Chang, B. H., & Shahbaz, M. (2021). Asymmetric effect of exchange rate volatility on India’s cross‐border trade: Evidence from global financial crisis and multiple threshold nonlinear autoregressive distributed lag model. Australian Economic Papers, 60(1), 64–97. https://doi.org/10.1111/1467-8454.12194
- Hirvonen, K. (2016). Temperature Changes, Household Consumption, and Internal Migration: Evidence from Tanzania. American Journal of Agricultural Economics, 98(4), 1230–1249. https://doi.org/10.1093/ajae/aaw042
- İ̇slam, M. S., & Wong, A. T. (2017). Climate Change and Food In/Security: A Critical Nexus. Environments, 4(2), 38–53. https://doi.org/10.3390/environments4020038
- Kara, E. (2017). Does US monetary policy respond to oil and food prices? Journal of International Money and Finance, 72, 118–126. https://doi.org/10.1016/j.jimonfin.2016.12.004
- Kartal, M. T., Kirikkaleli, D., & Ayhan, F. (2021). Nexus between Non-performing loans and economic growth in emerging markets: evidence from Turkey with Wavelet Coherence Approach. International Journal of Finance & Economics, 1–11. https://doi.org/10.1002/ijfe.2474
- Khatun, R., Roy, R., & Rahman, M. M. (2016). Impact of Remittances on Food Prices in Bangladesh. Journal of Institute of Bankers of Bangladesh, 62-63(1–2), 1–23.
- Kirikkaleli, D. (2021). Analyses of Wavelet coherence: financial risk and economic risk in China. Journal of Financial Economic Policy, 13(5), 587–599. https://doi.org/10.1108/JFEP-08-2019-0174
- Kirikkaleli, D., & Darbaz, I. (2021). The causal linkage between energy price and food price. Energies, 14(14), 4182. https://doi.org/10.3390/en14144182
- Koenker, R. (2005). Quantile Regression. Cambridge University Press.
- Kornher, L., & Kalkuhl, M. (2013). Food price volatility in developing countries and its determinants. No. 870-2016-60757. https://ageconsearch.umn.edu/record/156132/
- Kotyza, P., Czech, K., Wielechowski, M., Smutka, L., & Procházka, P. (2021). Sugar prices vs. financial market uncertainty in the time of crisis: Does COVID-19 induce structural changes in the relationship? Agriculture, 11(2), 93. https://doi.org/10.3390/agriculture11020093
- Letta, M., Montalbano, P., & Pierre, G. (2021). Weather Shocks, Traders’ Expectations, and Food Prices. American Journal of Agricultural Economics, 104(3), 1100–1119. https://doi.org/10.1111/ajae.12258
- Levine, P. (2012). Monetary policy in an uncertain world: Probability models and the design of robust monetary rules. Indian Growth and Development Review, 5(1), 70–88. https://doi.org/10.1108/17538251211224141
- Li, Y., & Li, J. (2021). How Does China’s Economic Policy Uncertainty Affect the Sustainability of Its Net Grain Imports? Sustainability, 13(12), 6899. https://doi.org/10.3390/su13126899
- Mallick, S. K., & Sousa, R. M. (2012). Real effects of monetary policy in large emerging economies. Macroeconomic Dynamics, 16(S2), 190–212. https://doi.org/10.1017/S1365100511000319
- Maslow, A. H. (1943). A Theory of Human Motivation. Psychological Review, 50, 370–396. https://doi.org/10.1037/h0054346
- Maydybura, A., Gohar, R., Salman, A., Wong, W. K., & Chang, B. H. (2022). The asymmetric effect of the extreme changes in the economic policy uncertainty on the exchange rates: evidence from emerging seven countries. Annals of Financial Economics, 2250031. https://doi.org/10.1142/S2010495222500312
- Mitchell, D. (2008). A Note on Rising Food Prices. World Bank Policy Research Working Paper, No. 4682.
- Ott, H. (2012). Fertilizer markets and their interplay with commodity and food prices. Report for the European Commission Join Research Centre,
- Pal, D., & Mitra, S. K. (2019). Correlation dynamics of crude oil with agricultural commodities: A comparison between energy and food crops. Economic Modelling, 82, 453–466. https://doi.org/10.1016/j.econmod.2019.05.017
- Peng, B., Chang, B. H., Yang, L., & Zhu, C. (2022). Exchange rate and energy demand in G7 countries: Fresh insights from Quantile ARDL model. Energy Strategy Reviews, 44, 100986. https://doi.org/10.1016/j.esr.2022.100986
- Phillips, P. C., & Perron, P. (1988). Testing for a unit root in time series regression. Biometrika, 75(2), 335–346. https://doi.org/10.1093/biomet/75.2.335
- Quiggin, J. (2007). Drought, Climate change and food prices in Australia. In School of Economics and School of Political Science and International Studies (pp. 3). University of Queensland.
- Salisu, A. A., Isah, K. O., Oyewole, O. J., & Akanni, L. O. (2017). Modelling oil price-inflation nexus: the role of Asymmetries. Energy, 125, 97–106. https://doi.org/10.1016/j.energy.2017.02.128
- Schlenker, W., & Roberts, M. J. (2006). Nonlinear effects of weather on corn yields. Review of Agricultural Economics, 28(3), 391–398. https://doi.org/10.1111/j.1467-9353.2006.00304.x
- Schnepf, R. (2008). High Agricultural Commodity Prices: What are the Issues?. Library of Congress, Congressional Research Service.
- Sim, N., & Zhou, H. (2015). Oil Prices, US Stock Return, and the Dependence between Their Quantiles. Journal of Banking & Finance, 55, 1–8. https://doi.org/10.1016/j.jbankfin.2015.01.013
- Sumberg, J., & Sabates-Wheeler, R. (2011). Linking agricultural development to school feeding in Sub-Saharan Africa: Theoretical Perspectives. Food Policy, 36(3), 341–349. https://doi.org/10.1016/j.foodpol.2011.03.001
- Syed, Q. R., Malik, W. S., & Chang, B. H. (2019). Volatility spillover effect of federal reserve’s balance sheet on the financial and goods markets of indo-pak region. Annals of Financial Economics, 14(03), 1950015. https://doi.org/10.1142/S2010495219500155
- Taghizadeh-Hesary, F., Rasoulinezhad, E., & Yoshino, N. (2019). Energy and Food Security: Linkages through price volatility. Energy Policy, 128, 796–806. https://doi.org/10.1016/j.enpol.2018.12.043
- Torrence, C., & Compo, G. P. (1998). A Practical Guide to Wavelet Analysis. Bulletin of the American Meteorological Society, 79(1), 61–78. doi:10.1175/1520-0477(1998)079<0061:APGTWA>2.0.CO;2
- Troster, V. (2018). Testing for granger-causality in quantiles. Econometric Reviews, 37(8), 850–866. https://doi.org/10.1080/07474938.2016.1172400
- TSI 2021. (2021 JulyAugust). Cpi. 26, 2021. https://data.tuik.gov.tr/Bulten/Index?p=T%C3%BCketici-Fiyat-Endeksi-Temmuz-2021-37385&dil=1
- Uche, E., Chang, B. H., & Effiom, L. (2022). Household consumption and exchange rate extreme dynamics: Multiple asymmetric threshold non‐linear autoregressive distributed lag model perspective. International Journal of Finance & Economics. https://doi.org/10.1002/ijfe.2601
- Uche, E., Chang, B. H., & Gohar, R. (2022). Consumption optimization in G7 countries: Evidence of heterogeneous asymmetry in income and price differentials. Journal of International Commerce, Economics and Policy, 13(1), 2250002. https://doi.org/10.1142/S1793993322500028
- Verbicki, V. (2021). The Relationship of Oil and Food Prices in the European Union. ISM University of Management and Economics, Doctoral Dissertation.
- Wang, X., Chang, B. H., Uche, E., & Zhao, Q. (2022). The asymmetric effect of income and price changes on the consumption expenditures: Evidence from G7 countries using nonlinear bounds testing approach. Portuguese Economic Journal, 1–19. https://doi.org/10.1007/s10258-022-00229-8
- WB. (2021). Commodity Prices, https://www.worldbank.org/en/research/commodity-markets, 705 August 1, 2021.
- Wen, J., Khalid, S., Mahmood, H., & Zakaria, M. (2021). Symmetric and asymmetric impact of economic policy uncertainty on food prices in China: A New Evidence. Resources Policy, 74, 102247. https://doi.org/10.1016/j.resourpol.2021.102247
- Xiao, X., Tian, Q., Hou, S., & Li, C. (2019). Economic policy uncertainty and grain futures price volatility: Evidence from China. China Agricultural Economic Review, 11(4), 642–654. https://doi.org/10.1108/CAER-11-2018-0224
- Zhang, C., & Qu, X. (2015). The effect of global oil price Shocks on China’s agricultural commodities. Energy Economics, 51, 354–364. https://doi.org/10.1016/j.eneco.2015.07.012