
 ?Mathematical formulae have been encoded as MathML and are displayed in this HTML version using MathJax in order to improve their display. Uncheck the box to turn MathJax off. This feature requires Javascript. Click on a formula to zoom.
Abstract
The purpose of this paper is to explore the impact of the first wave of COVID-19 lockdowns on retail stock trading patterns, at a transnational level. Cross-sectional empirical research was utilized with five samples of public companies from the US, Europe, Asia, and blended equity capital markets globally. The impact of the first wave of COVID-19 lockdowns on stock trading patterns was investigated using median tests and the factors that influence retail stock trading were explored with regression analyses. Contrary to the conventional proposition that stock trading activity is reduced during times of crisis, the results of this study indicate that retail stock trading increased during the first wave of COVID-19 lockdowns. In addition, the findings raise awareness of the risks to novice retail investors associated with the increased stock trading due to herd behavior.
1. Introduction
The outbreak of the coronavirus disease (COVID-19), which is caused by the severe acute respiratory syndrome coronavirus 2 (SARS-CoV-2), promptly became a pandemic in 2020 affecting millions of people globally (WHO, Citation2021). Apart from the ongoing severe impact on human health and the tragic loss of human lives, the COVID-19 pandemic is having also enormous impact on the social and economic activities of people worldwide (Goodell, Citation2020).
In the economic context, the COVID-19 pandemic has affected stock markets as well as investors’ stock trading patterns (Okorie & Lin, Citation2021; Ortmann et al., Citation2020). Despite heightened attention by investors (Smales, Citation2021), increased fear in stock trading due to the COVID-19 pandemic (Subramaniam & Chakraborty, Citation2021) and decline in the investors’ trust and confidence in stock markets during the COVID-19 pandemic (Shrotryia & Kalra, Citation2021), stock market liquidity had increased during the first nine months of 2020. Stock market volatility had also increased during the first wave of COVID-19 lockdowns (Okorie & Lin, Citation2021). Brandt et al. (Citation2010) suggest that high levels of volatility are usually associated with increased speculation by retail investors. Speculative trading is often related to herd trading (Omane-Adjepong et al., Citation2021).
In fact, during the first wave of COVID-19 lockdowns, stock trading activity had been dominated by novice retail stock traders, who overpowered the experienced and fundamentally driven stock traders (Tokic, Citation2020). Increase stock trading by retail investors is often associated with herd trading behavior, since during volatile and uncertain times retail investors are imitating each other’s stock trading behavior (Padungsaksawasdi, Citation2020). Herd trading behavior makes stock securities mispriced and consequently leads to market inefficiencies (Akbar et al., Citation2019). Thus, the increased stock trading activity from newcomers and novice retail investors, raises the caveat that these inexperienced stock traders may be susceptible to artificial stock price inflating practices that transfer wealth from the general population, which suffers more from the economic consequences of the pandemic to the expert arbitrageurs and speculators (Tokic, Citation2020).
The purpose of this study, which employs an empirical research design with five samples of public companies from global equity capital markets, is to explore the impact of the first wave of COVID-19 lockdowns on investors’ trading patterns, with an emphasis on retail investor as well as to investigate the factors that shape retail stock trading behavior. The study focuses on the first wave of COVID-19 lockdowns during the first nine months of 2020 because the universal and global lockdown was an unprecedented shock that disrupted both social and economic activity. Subsequent regional and partial lockdowns, especially after the introduction of COVID-19 vaccines, have lesser effect on stock trading activity that is more affected by other “black swan” events, such as the Russo-Ukrainian War and recessionary-inflationary environment in many economies.
The results of this study contradict the prevailing proposition that crises and other “distraction events” are associated with decreased trading volumes and stock volatility (Peress & Schmidt, Citation2020). However, the findings of this study concur with the result of recent studies, which focus on the effects of the COVID-19 pandemic on stock trading, indicating that during the COVID-19 pandemic, stock volatility has increased (see, Erdem, Citation2020; Heo et al., Citation2021; Okorie & Lin, Citation2021) and stock trading volumes have also increased (see, Ortmann et al., Citation2020). Most importantly, the results add to the body of existing literature that retail stock trading patterns changed during the first wave of COVID-19 lockdowns, underpinning strong presence of herd trading behavior.
The remaining sections of the paper are the following. Section 2 presents the recent literature findings and insights about the impact of the COVID-19 pandemic on retail investors’ stock trading patterns. Section 3 follows with the presentation of the methods and data used in the empirical exploratory study. Section 4 presents the results of the median tests to investigate the impact of the first wave of COVID-19 lockdowns on stock trading patterns as well as the regression analyses to explore the factors that influenced retail stock trading during the first wave of COVID-19 lockdowns. Section 5 discusses the findings of empirical research in conjunction with literature and section 6 concludes the paper with the main implications of the study as well as directions for future research.
2. COVID-19 pandemic and stock trading patterns
The abrupt transmission rate of the SARS-CoV-2 to the global population and the seriousness of the COVID-19, forced governments in many countries to proceed with unprecedented lockdowns and strict quarantine measures, during the first nine months of 2020 (Ortmann et al., Citation2020). Amid lockdowns, many people had found themselves sitting in their homes, in isolation. Due to the cancellation of live sports, cultural festivals and other social events, most people had been getting bored without any means of entertainment aside from the internet, an example of this is online stock trading (Tokic, Citation2020). Therefore, many people had turned to online stock trading, as being evident by the increased number of new stock brokerage accounts and increased average trading activity during the COVID-19 pandemic (Ortmann et al., Citation2020). The emergence of many online platforms and mobile applications with commission-light or even commission-free accounts, such as Robinhood, TradeStation, TD Ameritrade, Firstrade, M1 Finance, Betterment and Interactive Brokers, accommodated the rapid expansion of online stock trading by inexperienced retail investors. These investors are mostly “positive feedback” stock traders. “Positive feedback” investors are the stock traders who base their trading decisions solely on stocks with rising price momentum, on the expectation of “good news” and on the expectation that the “good news” will keep pushing stock prices higher (Tokic, Citation2020). In addition, the emergence of online platforms most likely enabled a part of the population with compulsive gambling disorder (Cox et al., Citation2020) to increase its speculative stock trading activity, such as day-trading and high frequency trading, since peoples’ inclination towards gambling is positively related to increased stock trading behavior (Zhang et al., Citation2021).
Since the “positive feedback” stock traders are attracted by the uptrend in share price momentum and by the expectation of “good news” that will boost the stock prices even higher, there is an incentive from senior management of public companies and by speculative investors to manipulate stock prices. Senior managers are inclined to engage into “cheap talk” practices such as stock splits, CEO forecasts and press releases without any valuable information to convey, in terms of improved fundamentals of their companies, but rather aim to boost their stock price by creating the impression of “good news” (Gutiérrez et al., Citation2020). The “cheap talk” practices attract the attention of “positive feedback” stock traders, either directly, or indirectly through online media sources such as Yahoo! Finance, Seeking Alpha and social news aggregation websites such as Reddit (Bushee et al., Citation2020). In addition, lower levels of corporate transparency are found to be positively related to herd behavior (Padungsaksawasdi, Citation2020).
Speculative investors can also utilize various trading strategies that aim to artificially inflate stock prices to attract the attention of the “positive feedback” stock traders, who will most likely follow the uptrend momentum in anticipation that the momentum will persist (Tokic, Citation2020). A prominent trading strategy by speculative investors in mid-2020, which was labelled as the “Nasdaq whale” case, consisted of an aggressive purchase of out-of-money call options for Nasdaq-listed and high-profile stocks to boost their stock price (Inagaki et al., Citation2020). Lastly, the COVID-19 pandemic may also foster financial fraud and misrepresentations by public companies to positively manipulate their stock prices (Karpoff, Citation2021).
On a different note, fear of possible global recession due to the COVID-19 pandemic, led to stock selloff by many retail investors as a way to safeguard their households’ liquidity amid the lockdown and until the economic activity recovers (Okorie & Lin, Citation2021), as well as by young people due to concerns about their job security and thus uncertainty about their future income (Heo et al., Citation2021).
Regardless of the cause, i.e., as a mean of entertainment or as a mean of liquidity preservation, stock trading activity has increased during the COVID-19 pandemic period, raising concerns about herd trading behavior and requiring the close attention of regulators. Prior studies had focused on the impact of the COVID-19 pandemic on stock returns (see, Al-Najjar et al., Citation2021; Anh & Gan, Citation2021; Harjoto & Rossi, Citation2021; Shrotryia & Kalra, Citation2021; Subramaniam & Chakraborty, Citation2021) and not on retail stock trading behavior, such as stock trading liquidity, volume and volatility. This study aims to fill this gap in literature by focusing on retail stock trading patterns, at a transnational level.
3. Methods
3.1. Data
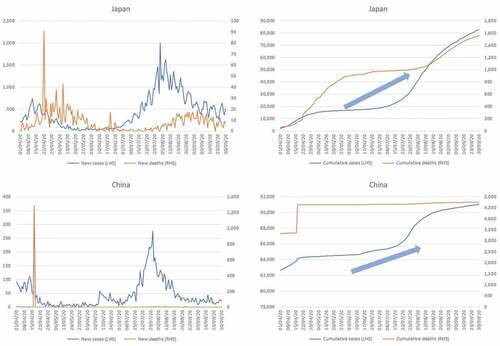
The study focuses on the first wave of COVID-19 lockdowns, because the universal and global lockdowns and quarantine measures during that period were an unprecedented shock that disrupted both social and economic activity. Since most lockdowns in Europe (EU) and the United States of America (US) took place in late March 2020 (see, Ortmann et al., Citation2020), this study focuses on the period started on 1 April 2020, and ended on 30 September 2020. The period since 30 September 2020, extends beyond the end of most initial lockdowns because the deterioration of the pandemic in terms of human cases and lives (see, Figure ., Figure . and Figure .) had been affecting the trading patterns of investors following the initial lockdowns. In particular, the increased number of new COVID-19 cases and deaths during the period started on 1 April 2020, and ended on 30 September 2020, had a significant impact on stock trading patterns, since stock trading liquidity had been found to be positively related to the number of new infections and deaths due to the COVID-19 (Mdaghri et al., Citation2021).
Figure 1. Impact of the COVID-19 on human health lives in US (April–September 2020).
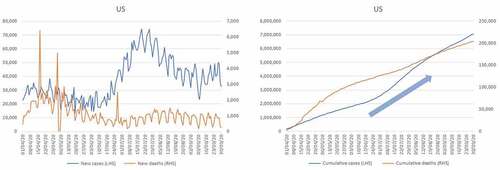
Figure 2. Impact of the COVID-19 on human health lives in EU (April–September 2020).
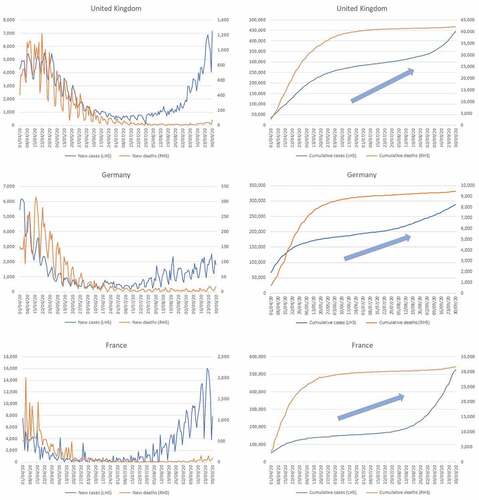
Figure 3. Impact of the COVID-19 on human health lives in Asia (April–September 2020).
This study employs an empirical research design by cross-sectionally comparing investors’ trading patterns between the April–September 2020 or 2Q-3Q 2020 period (first COVID-19 period) and the April–September 2019 or 2Q-3Q 2019 period, the April–September 2018 or 2Q&3Q 2018 period (pre-COVID-19 periods) and the April–September 2021 or 2Q-3Q 2021 period.
The sample of this paper is comprised of stocks in the US, EU, Asia and blended stocks listed on various global equity capital markets to cover all markets and all geographical regions in order to conduct a study at transnational level. The US stocks are being divided into large capitalization stocks taken from the S&P 500Footnote1 index and small capitalization stocks taken from the Russell 2000Footnote2 index to capture companies of all sizes in US. The sample of EU stocks is compiled from the CAC 40,Footnote3 the DAXFootnote4 and the FTSE 100Footnote5 indices to capture the more significant economies in Europe. Furthermore, the sample of Asian stocks is composed from the Nikkei 225Footnote6 and the Hang SengFootnote7 indices to capture the major stock trading activity in Asia. Lastly, the S&P Global 1200Footnote8 index is used as a blended sample of global stocks.
3.2. Variables
Abudy (Citation2020) provides evidence that there is a causal relation as well as positive relationship between retail investors’ activity and stock market liquidity. Therefore, the stock trading liquidity (LIQ) for the first COVID-19 period and the other periods was used as a proxy to measure retail investors’ trading activity.
The LIQ per stock for each period was computed as follows:
where is each of the four periods, i.e., 2Q-3Q 2018, 2Q-3Q 2019, 2Q-3Q 2020, 2Q-3Q 2021;
is a stock of a public company from the sample;
is a trading day in each of the four periods;
is the bid price per trading day per stock;
is the ask price per trading day per stock;
is the total trading days for each of the four periods.
The empirical research of retail stock trading patterns was also supplemented with the stock trading volume (VOL) and stock volatility (VOLAT) variables, because contrary to other “distraction events” and crises that are associated with decreased trading volumes and volatility (Peress & Schmidt, Citation2020), the COVID-19 pandemic led to increasing volatility (Erdem, Citation2020; Heo et al., Citation2021; Okorie & Lin, Citation2021) and excessive trading volumes (Ortmann et al., Citation2020). In addition, Akbar et al. (Citation2019) found that stock trading volume is a better proxy variable for herd behavior compared to the conventional variable of stock return.
The VOL per stock for each period was computed as follows:
where p is each of the four periods, i.e., 2Q-3Q 2018, 2Q-3Q 2019, 2Q-3Q 2020, 2Q-3Q 2021;
is a stock of a public company from the sample;
is a trading day in each of the four periods;
is the trading volume, in terms of number of shares, per trading day per stock;
is the total trading days for each of the four periods;
is the day ended of the four periods, i.e. September 30, 30 September 2018, 30 September 2019, 30 September 2020, 2021;
is the total number of shares outstanding per day ended of the four periods per stock.
The VOLAT per stock for each period was calculated as follows:
where is each of the four periods, i.e., 2Q-3Q 2018, 2Q-3Q 2019, 2Q-3Q 2020, 2Q-3Q 2021;
is a stock of a public company from the sample;
is a trading day in each of the four periods;
is the total trading days for each of the four periods;
is the price return per trading day per stock;
is the mean value of price return per period per stock.
For the regression analyses, the average share price (PRICE) for each period, the free float (FLOAT), the insiders’ ownership (INSID), and the institutional ownership (INSTIT) per stock as of the end of each period, are all used as control variables.
4. Empirical results
Since LIQ, VOL and VOLAT variables deviate from normal distribution,Footnote9 this study employs Kruskal–Wallis non-parametric tests to explore the cross-sectional median differences of stock trading patterns between the first COVID-19 period and the other periods. The results of the median differences analyses are presented in Tables .
Table 1. Median differences of stock trading patterns in the US
Table 2. Median differences of stock trading patterns in EU
Table 3. Median differences of stock trading patterns in Asia
Table 4. Median differences of stock trading patterns in blended global stock exchanges
The results for large capitalization companies listed on US stock exchanges (see, Table : Panel A), indicate that there are statistically significant differences in the median values of LIQ, VOL, and VOLAT between the first COVID-19 period and the other periods, with the exception of the 2Q-3Q 2020 period versus the 2Q-3Q 2021 period for the LIQ variable. The median LIQ presented a statistically significant increase in 2Q-3Q 2020 period compared to 2Q-3Q 2018 and 2Q-3Q 2019 periods and remained at the same levels in 2Q-3Q 2021 period. Moreover, the median VOL increases in 2Q-3Q 2020 period, compared to the same periods in 2018 and 2019. In the 2Q-3Q 2021 period, VOL decreased to the 2019 levels. The median VOLAT in 2Q-3Q 2020 period increased to 28.9%, compared to 14.87% and 17.01% for 2Q-3Q 2018 and 2Q-3Q 2019, respectively. In the 2Q-3Q 2021 period the median VOLAT decreased to 15.93%.
Regarding the small capitalization companies listed on US stock exchanges, there are no statistically significant differences in median values of LIQ between the first COVID-19 period and pre-COVID-19 periods. Nevertheless, there is a statistically significant increase in the median LIQ in 2Q-3Q 2021 compared to the same period in 2020 (see, Table : Panel B). Furthermore, results of the median differences analyses of the large capitalization companies listed on US stock exchanges for VOL and VOLAT variables are comparable with the same analyses of the large capitalization companies listed on US stock exchanges. Both the median values of VOL and VOLAT increased significantly in 2Q-3Q 2020 compared to the same periods in 2018 and 2019. In the 2Q-3Q 2021 period the median of VOL and VOLAT declined at a statistically significant level from the 2Q-3Q 2020 period.
The results for the companies listed on EU stock exchanges indicate that median values of LIQ do not differ significantly between the first COVID-19 period and the two pre-COVID-19 periods as well as the same period in 2021 (see, Table ). Nevertheless, there are statistically significant differences in the median values of VOLAT for all periods and of VOL between 2Q-3Q 2020 and 2Q-3Q 2021. The median value of VOLAT increased to 27.22% in 2Q-3Q 2020 from 14.21% and 16.15% of the same periods in 2019 and 2018, respectively. Lastly, the median value of VOLAT decreased in the 2Q-3Q 2021 period from the same period in 2020.
Turning to the companies listed on Asian stock exchanges, there is a statistically significant increase in the median value of LIQ in 2Q-3Q 2020 compared to the same period in 2018 (see, Table ). Moreover, there are no statistically significant differences in median values of VOL between the 2Q-3Q 2020 period and the other periods. Alike the trading patterns in the US and EU, the results for the companies listed on Asian equity capital markets suggest that there are statistically significant differences in the median values of VOLAT. The median VOLAT increased to 25.47% in 2Q-3Q 2020 from 16.45% in 2Q-3Q 2018 and from 17.80% in 2Q-3Q 2019. In addition, the median VOLAT in 2Q-3Q 2021 reduced to 19.24% compared to the same period in 2020.
Lastly, for public companies throughout the world, i.e., US, Canada, Brazil, Chile, Colombia, Mexico, Peru, United Kingdom, Switzerland, Netherlands, Denmark, Finland, Sweden, France, Italy, Germany, Spain, Ireland, Japan, China, South Korea, Singapore, and Australia, there are statistically significant differences in the median values of LIQ between the first COVID-19 period and the two pre-COVID-19 periods. Particularly, the median values of LIQ increased in 2Q-3Q 2020 compared to 2Q-3Q 2018, 2Q-3Q 2019 and remained unchanged, from a statistical point of view, in 2Q-3Q 2021 (see, Table ). In addition, there are statistically significant differences in the median values of VOL and VOLAT between 2Q-3Q 2020 and all other periods. Specifically, the median values of VOL and VOLAT increased in 2Q-3Q 2020 compared to 2Q-3Q 2018 and 2Q-3Q 2019, as well as decreased in 2Q-3Q 2021 compared to 2Q-3Q 2020.
Summarizing the findings of median tests on stock trading patterns (see, Table ), LIQ demonstrated statistically significant increase in 2Q-3Q 2020 versus the previous two respective periods for companies listed on blended global equity capital markets as well as on US stock exchanges for large capitalization companies. Moreover, LIQ increased, at a statistically significant level, in 2Q-3Q 2020 versus 2Q-3Q 2018 for the public companies in Asia, whereas in EU equity capital markets there was not any statistically significant change between 2Q-3Q 2020 and the same periods in 2018 and 2019. Turning to VOL, there was a statistically significant increase in 2Q-3Q 2020 versus the previous two respective periods at all equity capital markets, expect for EU and Asian markets. In addition, VOL in 2Q-3Q 2021 period decreased from the respective 2020 levels at all stock exchanges, apart from Asian stock exchanges. For VOLAT, the findings are consistent in all equity capital markets. There was a statistically significant increase in 2Q-3Q 2020 versus 2Q-3Q 2018 and 2Q-3Q 2019 and a statistically significant decrease in 2Q-3Q 2021 compared to 2Q-3Q 2020.
Table 5. Statistically significant variations of stock trading patterns
The empirical results were supplemented with Generalized Method of Moments regressions using HAC Newey-West estimation weighting matrix, to investigate the factors that influenced LIQ during the first COVID-19 period and the three other periods.
The model specification used is the following:
where is each of the four periods, i.e., 2Q-3Q 2018, 2Q-3Q 2019, 2Q-3Q 2020, 2Q-3Q 2021;
is the region, i.e., US (for large capitalization companies: S&P 500), US (for small capitalization companies: Russell 2000), EU (CAC 40, DAX and FTSE 100), Asia (Nikkei 225 and Hang Seng), and blended global (S&P Global 1200).
The results of the regressions appear in Tables .
Table 6. LIQ factors in US
Table 7. LIQ factors in EU
Table 8. LIQ factors in Asia
Table 9. LIQ factors in blended global stock exchanges
The results for the US public companies with large capitalization indicate that during 2Q-3Q 2020, FLOAT became important determinant of LIQ and remained a statistically significant factor of LIQ in 2Q-3Q 2021 (see, Table : Panel A). On the contrary, INSTIT from a positive and statistically significant factor in all other periods ceased being determinant of LIQ in 2Q-3Q 2020. Furthermore, VOLAT, VOL and PRICE were negative, positive and negative, respectively, factors of LIQ throughout the periods. The results for the US public companies with small capitalization indicate that VOL and PRICE were negatively related to LIQ (see, Table : Panel B). VOL became a positive and statistically significant factor of LIQ in 2Q-3Q 2020 and turned to a negative and statistically significant factor of LIQ in 2Q-3Q 2021.
The results for EU public companies indicate that VOL and VOLAT were not significant factors of LIQ during 2Q-3Q 2020. Moreover, INSTIT became a significant and positive factor of LIQ, whereas INSID ceased being a significant and positive factor of LIQ during 2Q-3Q 2020 (see, Table ). In addition, the lower PRICE and the increased FLOAT were important factors of LIQ in all periods.
For the companies listed on the Asian stock exchanges, VOLAT and FLOAT became significant and positive factors of LIQ during 2Q-3Q 2020 (see, Table ). Furthermore, Alike US and EU equity capital markets, retail investors of Asian public companies seem to prefer stocks with lower PRICE in all periods. Lastly, INSID became significant and negative factors of LIQ in 2Q-3Q 2019 and remained negative and significant in all periods thereafter.
The results for companies listed on blended stock exchanges globally suggest that FLOAT became a significant and positive factor of LIQ, whereas INSTIT ceased being a significant factor of LIQ during 2Q-3Q 2020 (see, Table ). Moreover, the positive and negative impact of VOL and VOLAT, respectively, on LIQ discontinued in 2021. Lastly, the results on blended global stock exchanges corroborate the consistent finding that lower PRICE is a significant antecedent of LIQ in all periods.
Summarizing the findings of the empirical investigation of LIQ determinants (see, Table ), VOLAT became a factor positively affecting LIQ in 2Q-3Q 2020 for small capitalization companies in US and for public companies in Asia. Moreover, VOLAT ceased being a negative factor of LIQ in 2Q-3Q 2020 for public companies in EU. FLOAT became a positive determinant of LIQ in 2Q-3Q 2020 for all public companies globally, with the exception of EU and US small capitalization companies. For INSTIT there are mixed results, since it ceased being a positive factor of LIQ in 2Q-3Q 2020 for US large capitalization and blended global public companies, whereas became a positive factor of LIQ in 2Q-3Q 2020 for EU public companies. Moreover, INSID ceased being a positive factor of LIQ in 2Q-3Q 2020 at EU equity capital markets. Lastly, PRICE is consistently a negative factor of LIQ for all periods and at all equity capital markets.
Table 10. Variations of LIQ factors during the first COVID-19 period
5. Discussion
The results of the empirical research suggest that there is a statistically significant increase of stock volatility during the first wave of COVID-19 lockdowns in all stock exchanges globally. Although this finding contradicts the prevailing theoretical proposition that during crises, stock volatility is decreased (see, Peress & Schmidt, Citation2020), it concurs with recent literature focusing on the effects of the COVID-19 pandemic on stock markets (see, Erdem, Citation2020; Heo et al., Citation2021; Okorie & Lin, Citation2021). This finding provides evidence of herd behavior in stock trading by novice retail investors, since high volatility is associated with herd trading behavior (Padungsaksawasdi, Citation2020). Specifically, Padungsaksawasdi (Citation2020) who investigated herd behavior in a sample dominated by retail investors, found that retail investors tend to imitate the trading behavior of other investors more during times of high volatility. The main reason of such collective behavior is that during extreme market conditions characterized by information uncertainty, individual investors are more receptive to follow the market consensus rather than base their investment decisions on their own views about companies’ fundamentals.
Regarding the stock trading volume there are mixed findings among equity capital markets throughout the world. Particularly, there are no statistically significant differences of stock trading volume during the period of the first wave of COVID-19 lockdowns compared pre-COVID-19 periods, in the EU and Asian stock exchanges, whereas it increased significantly in the US and global equity capital markets. Moreover, stock trading volume can be used as a proxy variable for herd trading behavior (Akbar et al., Citation2019). Therefore, the presence of herd trading behavior is less intense in EU and Asian stock exchanges compared to US and global equity capital markets. These findings add to the body of existing literature that suggests that herd trading behavior is more likely to exist in emerging equity capital markets (Bikhchandani & Sharma, Citation2000).
This study provides evidence that retail stock trading, as being measured by stock trading liquidity, increased during the first wave of COVID-19 lockdowns for large capitalization publicly-traded companies in the US and for public companies in blended global stock exchanges compared to the pre-COVID-19 periods in 2018 and 2019. Stock trading by retail investors also increased at Asian equity capital markets during the first wave of COVID-19 lockdowns compared to the pre-COVID-19 period in 2018. These findings provide evidence of herd behavior by retail investors, since herd behavior is manifested through an increased stock trading (Padungsaksawasdi, Citation2020). Thus, this study provides evidence of herd trading behavior during COVID-19 pandemic for large capitalization public companies in the US, contrary to prior studies that found no herd behavior in the US equity capital markets or other developed markets (Chang et al., Citation2000; Chiang & Zheng, Citation2010; Christie & Huang, Citation1995).
The empirical findings also indicate that the factors affecting retail stock trading are not uniform among the various equity capital markets and not equally important during the various periods. Stock volatility became an important determinant of retail stock trading with positive effect during the first wave of COVID-19 lockdowns for the US small capitalization and Asian public companies. A plausible explanation of the positive relationship between stock volatility and retail stock trading is that news about causalities of the COVID-19 pandemic, which are perceived as negative information, attracted more attention by retail investors and therefore induced higher volatility in these stock markets (Chen et al., Citation2020).
Lower stock prices seem to consistently drive increased retail stock trading in all stock exchanges, regardless of the unprecedented shock caused by COVID-19 lockdowns. This finding is useful to stock market regulators to enhance the stock trading rules for micro-cap or “penny stock” companies to protect inexperienced retail investors.
Lastly, corporate governance variables, such as free float, institutional ownership and insiders’ ownership are not consistently significant determinants, either positive or negative, of retail stock trading during the first wave of COVID-19 lockdowns.
6. Conclusions
This study explores the impact of the first wave of COVID-19 lockdowns on retail stock trading patterns at a transnational level by employing cross-sectional empirical research design. The findings of the study provide evidence of herd behavior in stock trading by novice retail investors, since increased noise trading and highly volatile environment are associated with herd trading behavior (Padungsaksawasdi, Citation2020). The presence of herd trading behavior causes significant deviation between stock prices and their intrinsic value (Chiang & Zheng, Citation2010). Herd trading behavior not only renders the markets inefficient (Akbar et al., Citation2019) but also make novice investors susceptible to excessive and unjustifiable risk (Omane-Adjepong et al., Citation2021). Thus, this study provides empirical evidence of the increased retail stock trading during the first wave of the COVID-19 lockdowns and raises awareness of the risks to novice retail investors stemming from the increased stock trading because of herd behavior. The findings of the study are useful to stock market regulators to calibrate the stock trading rules to protect inexperienced retail investors and foster fair stock trading practices by arbitrageurs and experienced speculators. In addition, the findings of the study add to the body of existing literature that low stock prices lure retail investors to increase their stock trading, most probably because low-priced stocks are more affordable to retail investors.
Future researchers wishing to further investigate the impact of COVID-19 lockdowns on retail stock trading patterns, are encouraged to also employ qualitative research designs, such as in-depth interviews with novice retail investors. By doing so, literature will have more rigorous evidence of herd behavior in stock trading by retail investors as well as of the factors that drive retail investors’ trading patterns.
Acknowledgements
The author would like to gratefully thank Dr. Anna Merika for her valuable review and the anonymous reviewers for their helpful comments and insightful suggestions on former versions of this paper
Disclosure statement
No potential conflict of interest was reported by the author(s).
Additional information
Funding
Notes
1. Includes 505 large capitalization and leading US equities, as of 30 September 2020
2. Includes the 2,019 smallest US stocks, in terms of capitalization as of 30 September 2020, from the Russell 3000 index
3. Includes the 40 largest and most actively traded stocks listed on the Euronext Paris
4. Includes 30 selected German blue-chip stocks listed on the Frankfurt Stock Exchange
5. Includes the 101 most highly capitalized stocks listed on the London Stock Exchange, as of 30 September 2020
6. Includes 225 top-rated Japanese stock listed on the First Section of the Tokyo Stock Exchange
7. Includes 50 selected stocks listed on Hong Kong Exchange
8. Composite index comprised of seven regional and country indices, i.e., S&P 500, S&P Europe 350, S&P TOPIX 150 (Japan), S&P TSX 60 (Canada), S&P ASX 50 (Australia), S&P Asia 50, and S&P Latin America 40. Includes 1,222 stocks as of 30 September 2020
9. The results of Kolmogorov–Smirnov Test are not reported herein but are available upon request.
References
- Abudy, M. M. (2020). Retail investors’ trading and stock market liquidity. North American Journal of Economics and Finance, 54, 54, 101281. https://doi.org/10.1016/j.najef.2020.101281
- Akbar, U. S., Rajput, S. K. O., & Bhutto, N. A. (2019). Do investors herd with industries or markets? Evidence from Pakistan stock exchange. Cogent Economics & Finance, 7(1), 1698089. https://doi.org/10.1080/23322039.2019.1698089
- Al-Najjar, H., Al-Rousan, N., Al-Najjar, D., Assous, H. F., & Al-Najjar, D. (2021). Impact of COVID-19 pandemic virus on G8 countries’ financial indices based on artificial neural network. Journal of Chinese Economic and Foreign Trade Studies, 14(1), 89–21. https://doi.org/10.1108/JCEFTS-06-2020-0025
- Anh, D. L. T., & Gan, C. (2021). The impact of the COVID-19 lockdown on stock market performance: Evidence from Vietnam. Journal of Economic Studies, 48(4), 836–851. https://doi.org/10.1108/JES-06-2020-0312
- Bikhchandani, S., & Sharma, S. (2000). Herd behavior in financial markets. IMF Economic Review, 47(3), 279–310. https://www.imf.org/external/pubs/ft/staffp/2001/01/pdf/bikhchan.pdf
- Brandt, M. W., Brav, A., Graham, J. R., & Kumar, A. (2010). The idiosyncratic volatility puzzle: Time trend or speculative episodes? The Review of Financial Studies, 23(2), 863–899. https://doi.org/10.1093/rfs/hhp087
- Bushee, B., Cedergren, M., & Michels, J. (2020). Does the Media Help or Hurt Retail Investors during the IPO Quiet Period? Journal of Accounting and Economics, 69(1). https://doi.org/10.1016/j.jacceco.2019.101261
- Chang, E. C., Cheng, J. W., & Khorana, A. (2000). An examination of herd behavior in equity markets: An international perspective. Journal of Banking & Finance, 24(10), 1651–1679. https://doi.org/10.1016/S0378-4266(99)00096-5
- Chen, S., Zhang, W., Feng, X., & Xiong, X. (2020). Asymmetry of retail investors’ attention and asymmetric volatility: Evidence from China. Finance Research Letters, 36, 36, 101334. https://doi.org/10.1016/j.frl.2019.101334
- Chiang, T. C., & Zheng, D. (2010). An empirical analysis of herd behavior in global stock markets. Journal of Banking & Finance, 34(8), 1911–1921. https://doi.org/10.1016/j.jbankfin.2009.12.014
- Christie, W. G., & Huang, R. D. (1995). Following the pied piper: Do individual returns herd around the market? Financial Analysts Journal, 51(4), 31–37. https://doi.org/10.2469/faj.v51.n4.1918
- Cox, R., Kamolsareeratana, A., & Kouwenberg, R. (2020). Compulsive gambling in the financial markets: Evidence from two investor surveys. Journal of Banking and Finance, 111, 111, 105709. https://doi.org/10.1016/j.jbankfin.2019.105709
- Erdem, O. (2020). Freedom and stock market performance during Covid-19 outbreak. Finance Research Letters, 36, 36, 101671. https://doi.org/10.1016/j.frl.2020.101671
- Goodell, J. W. (2020). COVID-19 and finance: Agendas for future research. Finance Research Letters, 35, 35, 101512. https://doi.org/10.1016/j.frl.2020.101512
- Gutiérrez, M., Papiashvili, N., Tribó, J. A., & Vazquez, A. B. (2020). Managerial incentives for attracting attention. European Financial Management, 26(4), 896–937. https://doi.org/10.1111/eufm.12248
- Harjoto, M. A., & Rossi, F. (2021). Market reaction to the COVID-19 pandemic: Evidence from emerging markets. International Journal of Emerging Markets. https://doi.org/10.1108/IJOEM-05-2020-0545
- Heo, W., Grable, J. E., & Rabbani, A. G. (2021). A test of the association between the initial surge in COVID-19 cases and subsequent changes in financial risk tolerance. Review of Behavioral Finance, 13(1), 3–19. https://doi.org/10.1108/RBF-06-2020-0121
- Inagaki, K., Martin, K., Smith, R., & Wigglesworth, R. (2020). SoftBank unmasked as ‘Nasdaq whale’ that stoked tech rally. Financial Times, September 4, available at: https://www.ft.com/content/75587aa6-1f1f-4e9d-b334-3ff866753fa2 (accessed October 23, 2020).
- Karpoff, J. M. (2021). The future of financial fraud. Journal of Corporate Finance, 66, 66, 101694. https://doi.org/10.1016/j.jcorpfin.2020.101694
- Mdaghri, A. A., Raghibi, A., Thanh, C. N., & Oubdi, L. (2021). Stock market liquidity, the great lockdown and the COVID-19 global pandemic nexus in MENA countries. Review of Behavioral Finance, 13(1), 51–68. https://doi.org/10.1108/RBF-06-2020-0132
- Okorie, D. I., & Lin, B. (2021). Stock markets and the COVID-19 fractal contagion effects. Finance Research Letters, 38, 38, 101640. https://doi.org/10.1016/j.frl.2020.101640
- Omane-Adjepong, M., Alagidede, I. P., Lyimo, A. G., & Tweneboah, G. (2021). Herding behaviour in cryptocurrency and emerging financial markets. Cogent Economics & Finance, 9(1). https://doi.org/10.1080/23322039.2021.1933681
- Ortmann, R., Pelster, M., & Wengerek, S. T. (2020). COVID-19 and investor behavior. Finance Research Letters, 37, 37, 101717. https://doi.org/10.1016/j.frl.2020.101717
- Padungsaksawasdi, C. (2020). Herd behavior and firm-specific information. Cogent Economics & Finance, 8(1), 1844399. https://doi.org/10.1080/23322039.2020.1844399
- Peress, J., & Schmidt, D. (2020). Glued to the TV: Distracted Noise Traders and Stock Market Liquidity. Journal of Finance, 75(2), 1083–1133. https://doi.org/10.1111/jofi.12863
- Shrotryia, V. K., & Kalra, H. (2021). COVID-19 and overconfidence bias: The case of developed, emerging and frontier markets. International Journal of Emerging Markets. https://doi.org/10.1108/IJOEM-09-2020-1019
- Smales, L. A. (2021). Investor attention and the response of US stock market sectors to the COVID-19 crisis. Review of Behavioral Finance,13, (1), 20–39. https://doi.org/10.1108/RBF-06-2020-0138
- Subramaniam, S., & Chakraborty, M. (2021). COVID-19 fear index: Does it matter for stock market returns? Review of Behavioral Finance, 13(1), 40–50. https://doi.org/10.1108/RBF-08-2020-0215
- Tokic, D. (2020). Robinhoods and the Nasdaq whale: The makings of the 2020 big-tech bubble. Journal Corporate Accounting & Finance, 31(4), 9–14. https://doi.org/10.1002/jcaf.22473
- WHO. (2021). Considerations for implementing and adjusting public health and social measures in the context of COVID-19. June 14, available at: https://www.who.int/publications/i/item/considerations-in-adjusting-public-health-and-social-measures-in-the-context-of-covid-19-interim-guidance (accessed July 4, 2021)
- Zhang, T., Wei, D., Liu, Z., & Wu, X. (2021). Lottery preference and stock market participation: Evidence from China. China Finance Review International. https://doi.org/10.1108/CFRI-01-2021-0008
