
 ?Mathematical formulae have been encoded as MathML and are displayed in this HTML version using MathJax in order to improve their display. Uncheck the box to turn MathJax off. This feature requires Javascript. Click on a formula to zoom.
Abstract
Rural poverty is often discussed in combination with spatial inequality where rural poor face worse problems with diverse remedies in comparison to urban poor. The present study aims to find out area-level effects and possible determinants of rural poverty based on data from the Rural Household Panel Survey of Pakistan Round-1 (2012). The multilevel binary logistic model is used to integrate concurrent individual and district-level variables to explore area-level effects on poverty. A two-level multilevel model is used for the analysis of the poverty status of 4804 respondents nested in 19 districts. Individual-level variables included in the model are education, socioeconomic status, and spending behaviour. It is found that approximately 60% of individuals of the overall population were found poor, and district-level effect accounts for 7% variations in poverty. A particularly significant ratio of poor is found for people who attained deeni madrassa/religious education or no education at all. Poverty existence is significantly associated with spending behavior and socioeconomic status. The persons with relatively middle/high socioeconomic status and successful educational achievement but a lacking attitude toward spending money are considered poor.
1. Introduction
Poverty is a complex phenomenon that is not only related to income and consumption (monetary dimension) but also to the non-monetary dimensions such as no shelter, malnutrition, poor education and health facilities, the uncertainty of the future, gender inequality, and infected water supply (Alkire & Foster, Citation2011; Bhuiya et al., Citation2007). Poverty is caused by many factors, which are not only economic but also social, political, cultural, and geographical, which ultimately influences the lives of people to be called poor. The incidence of poverty is more severe in developing countries than in developed countries. In a typical developing country, more than 30% of the people earn less than $ 2 a day, and almost 0% are in developed (industrialized) countries (Alvaredo & Gasparini, Citation2015). The alleviation of poverty in all forms and dimensions by the end of 2030 is the first and foremost goal of the United Nations Sustainable Development Goals (SDGs). Thus, measuring the extent of poverty and identifying the factors that affect poverty is crucial for developing countries like Pakistan to devise policies to combat poverty and achieve growth.
Pakistan, a poor, low-income country, ranks 154th among 189 countries. In Pakistan, poverty has declined from 61.6% in 1998–1999 to 21.5% in 2018–2019 over the last two decades. Meanwhile, poverty has declined in urban areas from 47.4% to 10.7%, whereas in rural areas, it has declined from 67.5% to 27.6% during the same period (“The State of POVERTY in Pakistan PIDE Report, Citation2021,” 2021). The pace at which poverty is declining is inconsistent, and we can easily infer that poverty in urban areas decreases significantly more than in rural poverty. Rural poverty was twice as high as urban poverty in 2015 (Afzal et al., Citation2019). So, now the question arises of what causes this persistent prevalence of poverty in rural areas. This study also aims to answer this question.
The present study identifies the determinants of rural poverty using a multilevel analysis that considers hierarchical structure in this scenario, as observed in the past literature (Ahmad & Faridi, Citation2020). It incorporates the socioeconomic status (SES) of the individuals used as a sample in the model to identify the relationship between personal traits and poverty prevalence. SES does include not only income spending but also educational attainment, occupational standing, and personal insights into social status.
The present study identifies that although the individual or household-level factors are important for poverty determination, but geographical or area-specific factors are also crucial. For instance, suppose that we can show that having less education does, in fact, increase the likelihood of being poor. This is intriguing, but it raises the issue of why some individuals lack a college degree in the first place: Were the school fees too high? Was there no school nearby? Was the quality of the education abysmal? Were their parents unsupportive, or even hostile to education? Was there a concern that an educated woman could not find a husband? The weakest part of poverty analysis—what White and Booth (Citation2003) calls the “missing middle”—is developing a clear understanding of the fundamental causes of poverty. Such an understanding is needed if one is to develop an effective strategy to combat poverty. Since there is no reason to believe that the root causes of poverty are the same everywhere, country-specific analysis is essential.
Therefore, to design suitable anti-poverty measures, the recognition of geographical location where these cluster of individuals locate is worthy (Kim et al., Citation2016). For this, the study also examines the district-level variation in poverty prevalence by incorporating 19 districts from 3 provinces of Punjab, Sindh, and KPK. Poverty is being measured as a binary variable as either it exists or it's not. Multilevel logistic model has been used to investigate the relationship between socioeconomic status of individuals and rural poverty in different districts of Pakistan.
The present study’s findings illustrate that education attainment is the crucial factor determining poverty prevalence. Very low level of educational attainment aggravates household-level poverty. The people who attained no education or went to deeni Madaras only are found to be poor. At the same time, there is less tendency to be poor for people who attained high technical education. Socioeconomic status and spending behavior are also essential factors impacting poverty negatively. Middle and high socioeconomic status indicates a reduction in poverty prevalence and shows an inverse relationship with education. District-level variation accounts for only 7% and thus exhibits no important role of geographical location. This study is novel as hardly any study, to the best of our knowledge, exists that captures the direct relationship between socioeconomic status and poverty. Meanwhile, including district-level variation is beneficial for developing future poverty alleviation policies.
2. Literature review
Poverty, according to the Bank (Citation2000), is defined as “pronounced deprivation in well-being” (Haughton & Khandker, Citation2009). In simple words, poverty means being poor, and being poor means lacking something-which may be something that individuals need or that others have. There is, however, little consensus in past literature regarding what they lack. Thus, poverty is a complex concept. To date, three major concepts based on ideas of subsistence (Rowntree, Citation1902), basic needs (Stewart, Citation1985), and relative deprivations of resources, capabilities, and rights (Wolff & De Shalit, Citation2013) have dominated the debates on poverty concepts.
Traditionally, poverty has been defined by a single criterion, such as income or consumption (which can be used interchangeably). In this analysis, a basket of goods and services believed to be the bare minimum to live a non-impoverished life is valued at current prices. People not earning enough money to cover such a basket are considered poor.
Although income level macro-economic indicators persisted as a dominant paradigm during the 1970s, 1980s, and even 1990s, much literature had been published during this time that posed challenges to it. In the UK, Runciman (Citation1961) and Townsend (Citation1979) introduced the concept of relative poverty in opposition to notions of absolute poverty and defined poverty as not just a failure to meet minimum nutrition or subsistence levels but rather as a failure to keep up with the standards prevalent in a given society.
According to the past literature, poor people’s perceptions of poverty are significantly broader; poverty includes a lack of education, health, housing, employment, personal security, and much more. In such a case, no indicator, such as income, can only capture the multiple aspects contributing to poverty (Sen, Citation1982). In the mid-1970s, the International Labour Organisation (ILO) shaped the concept of “basic need”: poverty could not be defined as a lack of income but as a lack of access to health, education, and other resources. Hence, we now have “subjective” definitions of poverty as well as ideas of physiological and sociological deprivations, in addition to “objective” definitions of poverty.
Since poverty is multidimensional, there are numerous factors that give rise to deprivations amongst individuals. Past literature identifies numerous determinants of poverty. The studies point out that poverty may be due to national, sector-specific, community, household, or individual characteristics. Considering individual-level characteristics, researchers increasingly link poverty with the age structure of the household members, the education and gender of the household head, domestic violence prevention, and the extent of participation in the labor force. Recently, there has been more emphasis in the literature on proving a link between poverty and human capital by demonstrating the relationship between income distribution and education (Shirazi, Citation1995). Education has been acknowledged as an expedient and efficient transformation agent. It not only broadens people’s horizons intellectually but also inspires them to actively contribute to the social and economic development of their families and the nation. Education contributes to poverty reduction and increases the welfare of the poor (Group, Citation2016).
It is generally believed that the best investment of all is made in people. According to Becker (Citation1975) and Schultz (Citation1961), education and training are a sort of investment that will pay off in the future by increasing income for both the educated person and society. Therefore, education contributes to poverty alleviation. (Citation2020) concluded that education by enhancing an individual’s skills increases a person’s earning capacity and the possibility of getting a job. Van der Berg (Citation2008) pointed out that all over the world, we can find evidence that the probability of finding employment rises with higher levels of education, and people with higher levels of education are also likely to earn more.
Literacy and schooling are essential indicators of the quality of life in their own right. The studies show that literate household heads are less likely to be poor than households with illiterate heads (Eyasu & Yildiz, Citation2020). In this regard, Maitra (Citation2000) studied the differential in the earnings of the households in South Africa based on the differential in the educational status of the household heads. The results showed that a household whose head has attained more than secondary school-level education performs significantly better than all other households. Some other studies suggest that education might increase earning potential and improve labor’s occupational and geographic mobility (Deressa & Sharma, Citation2014; Khandker & Haughton, Citation2005; Teka et al., Citation2019).
Psacharopoulos and Patrinos (Citation1994) conducted a cost–benefit analysis of education in 32 countries. The results showed that not only is education profitable but that in many cases, mainly, return to education exceeds the rate of return to physical capital, the private rate of return is consistently higher than the social rate of return, and the rate of return to primary education is generally higher than the rate of return to secondary or higher education.
Explicitly considering the rural areas, Fafchamps and Quisumbing (Citation1999) determine whether human capital affects the productivity and labor allocation of rural households in four districts of Pakistan. The study shows that education raises off-farm productivity and induces rural Pakistani households to shift labor resources from farms to off-farm activities. Moreover, Orazem et al. (Citation2007) suggest that the impact of education on earnings and, thus, on poverty works mainly through the labor market. The authors also suggest that education helps increase productivity in various areas, including peasant farming.
Apart from education, the household’s socioeconomic status also plays a vital role in accomplishing stable poverty interventions in developing countries. Akerele et al. (Citation2012) examined the poverty situation in urban Nigerian households, explicitly focusing on socioeconomic determinants of poverty. The study declared dependency ratio, household assets, and the educational status of the household head as influential determinants of poverty. The authors proposed that minimum wage schemes and programs for promoting education can benefit poverty reduction.
Based on Fijian households, Xing (Citation2010) evaluated the characteristics of the poor that help to tackle poverty. The study highlighted that rural households are more prone to poverty than urban households, but urban households report more significant inequalities between people. Also, the study found that households headed by females and ones with disabled household members are more likely to be poor. The author also points out that being employed and having a high level of education are the fundamental factors that help in poverty alleviation.
Eyasu (Citation2020) studied the determinants of poverty at different expenditure quintile levels in Ethiopia’s rural households. The study concluded that total family size and the bad health status of the household head are the factors responsible for increasing household poverty. Moreover, it was also found that the non-off-farm income decreases the poverty of the rural households and encourages them to participate in off-farm and non-farm sources of revenue, other than agricultural activities, to diversify their employment. Shirazi (Citation1995) examined the impact of various factors on household poverty. The study found that an increase in the number of family earners and the household head’s educational level decreases the likelihood of a household being poor.
Sheikh et al. (Citation2020) also explored the demographic and economic determinants of poverty in the Multan District of Pakistan. The study’s results pointed out that the incidence, depth, and severity of poverty are higher in rural areas than in the Multan district’s urban areas. It was also found that household size, physical disability, mental illness, migration, household head’s occupation, own house, remittances, and education significantly impact poverty. By using Pakistan Rural Household Survey (2013), Padda and Hameed (Citation2018) also estimated poverty levels and multidimensional deprivation in rural areas of Pakistan. Deprivations in housing, education, energy, agricultural and non-agricultural assets, sanitation, and access to clean drinking water were considered to estimate multidimensional poverty levels. The study’s results suggested that around 44% of rural households of Pakistan live in poverty, with an ongoing lack of pure drinking water, insufficient sanitation facilities, compromised housing conditions, alloyed energy sources, and scarcity of economic resources.
Another important determinant of household poverty is the household’s spending (or saving) behavior. Irrational saving or spending behavior of households can push them toward deeper poverty. In this regard, Shefrin and Thaler (Citation1988) presented a behavioral life-cycle hypothesis stating that people tend to do irrational spending due to a lack of self-control and impatience. Moreover, Jayanthi and Rau (Citation2017) investigated the relationship between financial literacy levels and rural households’ spending behaviors. The findings of the study suggested that low levels of financial literacy lead to poor spending behavior. The authors suggested that people living in rural areas and those with low incomes usually spend unnecessary money. The study concluded that spending habits are vital for managing money, which helps to maintain a better quality of life.
Numerous past studies have identified variations in determinants of poverty across different geographical areas. Barbier and Hochard (Citation2014) tested whether spatial distributions of the rural population affected poverty directly or indirectly, through income growth, in 83 developing countries from 2000 to 2012. The study found no evidence of the spatial distribution of rural population on the direct impact on poverty. However, a substantial indirect impact was found, which pointed out towards reduction in poverty due to growth. The authors also suggested that rural populations in the least ideal lands and inaccessible areas are more likely to be vulnerable and should be targeted to reduce poverty.
Kim et al. (Citation2016) also conducted a comprehensive study to evaluate the role of multiple geography levels in describing poverty distribution in India. The study’s findings showed that most of the disparities in poverty levels were due to state and village-specific factors. Based on the study’s results, the author suggested that multilevel modeling is necessary to find specific contextual determinants of poverty at the state and village levels so that region-specific poverty can be alleviated and a balanced regional development can be achieved.Medeiros et al. (Citation2021) also evaluated the regional and income spatial heterogeneities in household poverty in Brazil.
Regional differences in poverty indicate that the level of development of any area or some area-specific factors does play a role in poverty alleviation. In this regard, Knight (Citation2017) pointed out that across states, on average, high-poverty districts experienced an inequitable share of funding and staffing cuts and increased local tax rates following the Great Recession. Many factors like a high dependency rate, lower level of education, adoption of the profession, lower per capita income, spending habits, and dissaving cause rural poverty. Tran et al. (Citation2022) also studied the effect of ambient and household factors on multidimensional poverty in rural Vietnam. The results of the study revealed that province, district, and commune-level unobservable characteristics attributed to about 28% and 25% variation of the total variation in multidimensional poverty and income poverty risk, respectively. The results further showed that poverty is enhanced for households in remote communes and decreased for communes with easy access to transportation. It was further observed that residing in provinces with higher economic development, increased population density, and enhanced international integration alleviates the chances of households escaping both multidimensional and income poverty.
Moving toward concluding this review, certain gaps can be seen in the literature. Firstly, multiple past studies separately determine various factors that determine poverty. However, there are rarely any studies (to the best of the researcher’s knowledge) that collectively consider individual and household factors that affect poverty. Moreover, no studies on these factors directly examine the relationship between household spending behavior and poverty levels. Lastly, specifically in the case of Pakistan, there are rarely any studies that determine various determinants of poverty and also conduct this analysis at district or regional levels. The present study is an effort to fill these gaps.
3. Materials and methods
3.1. Data description
The present study utilizes data from Pakistan Rural Household Panel Survey 2012-Round 1. This survey was carried out by the Pakistan Strategy Support Program (PSSP) within three provinces of Pakistan named Sindh, Punjab, and Khyber-Pakhtunkhwa (KPK), from March to April (2012), and no panel survey has been conducted in Pakistan afterwards. This data provides information on various topics like economic, sociological, demographic issues, employment, education, and household aspirations. The sample universe of round 1 with a hierarchical structure comprised households from rural areas in 19 districts from three provinces; 5 districts are taken from Sindh, 12 districts are taken from Punjab, and 2 are selected from Khyber-Pakhtunkhwa. This multistage stratified sample 2012 (PRHPS) follows 4804 male household head (the head of the household is considered to provide all the necessary information to fill up the questionnaires with the help and guidance of enumerators) individuals selected from the age group of 18–35 years working age (target population) at level-1 nested within 19 districts (level-2).
The outcome variable “poverty” is computed on basis of the annual income of individuals in the form of yes or no; poor vs. non-poor. For measuring poverty, this study has used the poverty line as a threshold, recommended by the World Bank (2015).Footnote1 It is declared worldwide that a person with daily earnings of less than US$ 1.9 per day would be considered poor. For comparison with the poverty threshold, the annual income of individuals is converted into daily income in dollars and further compared with the poverty line (US$1.9). The response variable poverty is coded as “1” (poverty exists/poor) and “0” indicates (poverty does not exist/non-poor). The basic choice of independent variables for this study was supported by prior studies conducted on the factors influencing poverty (Psacharopoulos & Patrinos, Citation1994; Slesnick, Citation1993; Tilak, Citation2002). A person’s education, socioeconomic status, and the way how he spends money (based on the indicators mentioned in the survey) are taken as the main determinants of poverty to be analyzed. The variable names and codes are shown in Table .
Table 1. Variable names, descriptions, and codes in the sample (PRHPS)
This survey data has an inherent hierarchical structure because multistage sampling is performed. The correlation between observations occurs due to multiple stages of hierarchy, which could be tackled finely by adopting the recent technique of multilevel modelling. In most cases, multilevel modelling requires heavy computations, but several software packages nowadays carry out computations efficiently (Khan & Shaw, Citation2011).
3.2. Model description
3.2.1. Random intercept multilevel linear model
Several observational studies are often comprised of hierarchical data generating cluster-correlated error terms in the model. The multilevel model is a special case of mixed-effect model suitable to incorporate cluster-correlated errors. Observations measured at level 1 are nested in observations in a cluster level-2, and cluster level can then be further nested in higher-level clusters. The observations between clusters are independent and within each cluster dependent. A random intercept multilevel linear model is given by eq. 1
Where yij is the response variable by considering a two-level structure with a total of nj observations nested in j districts, xij is a single explanatory variable observed at the first level, eij is a level-1 residual term and is a level-2 residual term, both follow the normal distribution
an overall intercept is a fixed effect, invariant, and common component across the clusters. To express the model in terms of expected value or mean of response variable yij in district j with a particular value
on x can write as mentioned in eq. 2
3.2.2. Random intercept multilevel binary logistic model
In the random intercept multilevel logistic model, for the binary response variable, the expected value of response variable yij is as follows:
E(yij|) =
= Pr (yij = 1) = Probability of being in the success category.
In random intercept models, intercepts are varied across districts in this particular dataset, presented in eq. 3.
Where and
Random intercept consists of an overall intercept shared by all districts, a district-specific component, and a random effect.
correspond to fixed effect and
represent the random effect of district-level. It is a random variable following a normal distribution with a mean “0” and
is the estimate of variance across all districts. If the variance comes out to be a large estimate, which depicts the true involvement of district-level effect in describing poverty. If the variance turns out to be small, then the variation in poverty could be explained well by individual characteristics only. The outcomes on response variables within the same district are mutually independent, that is, the individuals inside each district are independent. Level-2 variance
is the degree of heterogeneity in the probability of being poor that has not been explained by two categories: poor vs non-poor. This kind of dependence in data can be described precisely by using a measure called the “Intra-Class” Correlation (ICC) coefficient. ICC explains the dependency between observations nested within the same cluster/group observations. The individuals in the same district are usually more similar than individuals in a different district. This statistic measures the degree of similarity that exists within the same district in comparison to different districts (Castro, Citation2002). In other words, ICC estimates the proportion of total variance in response variables ascribed to interregional variance and hence ascertains the need for multilevel modeling (Raudenbush & Bryk, Citation2002). S. Lin et al. (Citation2020) conducted a study to analyze multidimensional poverty profiles in four districts of Taiwan by applying a multilevel modelling technique. They also calculated ICC to estimate interregional variance.
In the multilevel logistic model, intra-class correlation is calculated as:
Where = estimated level-2 variance and
= 3.142
R package “lme4”:
According to Team (Citation2012), the package “lme4” is a class of mixed-effect models using “Eigen” and S4. This package consists of functions for fitting and analyzing mixed models by using “glmer” function. This function uses the maximum likelihood estimation method (Laplace approximation) for estimation.
4. Results and discussion
4.1. Bivariate exploration of sample characteristics
Frequency and percentages for all three categorical explanatory variables are computed and summarised in Table . Among all variables, 60% are poor, and the remaining 30% are above the poverty line and declared as non-poor. Almost all of the individuals belong to low and middle socioeconomic status and only 59 individuals out of 4804 have high socioeconomic status. The rest of the population is approximately divided in half for low and middle socioeconomic status. Approximately 50% persons spend money often and regret it later. From the selected sample, slightly over half of the individuals have attended deeni madrassa/religious or have not attained school ever. The rest of the population is categorized into different educational levels.
Table 2. Descriptive summary of explanatory variables
The Chi-square test of independence is used to discover the association between the outcome variable and independent variables. All p-values show strong dependence. Data is structured in two levels: individuals nested within districts. A multilevel logistic model is employed to explore between-group and within-group variability and the effect of higher-level variables in explaining the total variation. The model is analyzed by using the software R package “lme4”.
From bivariate analysis (Table ), the relationship of poverty with all the sampled covariates is significant. All of the explanatory variables significantly affect poverty and the majority of the sampled individuals had not attained any education or attained only deeni madrassa (p-value = 0.000). Only 0.05% of people were poor and educated up to grade 5, 15.8% were educated up to 10th grade, and 1.9% had completed graduation. Very few only 0.2% of individuals had technical higher education. Of 4804 persons, 31.1% belong to low socioeconomic status, 29.4% fit into the middle socioeconomic status and the least percentage of 0.3 had high socioeconomic status (p-value = 0.000). Out of 4790 observations, 32.2% of people often spend their money and regret later that they spent it. Only 28.6% denied this statement (p-value = 0.000) with 14 missing values.
4.2. Random intercept two-level logit model
Multivariate analysis is executed using Equationeq 3(3)
(3) , with random intercept and fixed slope for variables. It makes fitting separate parallel lines possible with different intercepts for the predicted response of poverty in different districts (Khan & Shaw, Citation2011). By using R commands of generalized linear modelling, the estimates are presented in Table , and all the variables predict poverty significantly.
Table 3. Parameter estimates, odds ratio and P-value obtained from the multilevel logistic model
It can be concluded from Table that people having education up to 10th grade are less likely to be poor than those with education less than grade 5. The odds of being poor for a person with education between 6 and 10 grades are 0.65 times the odds of a person educated less than grade 5 assuming all the other variables are equal. There is the least chance of being poor the persons attaining higher technical education as seen from negative coefficients. The most likely proportion of being poor is the individuals attending deeni madrassa or not completing any education level. Low educational attainment has no significant effect on poverty, and the proportion of individuals who go in middle and high socioeconomic status is less likely to be poor as compared to persons who belong to low socioeconomic status. Belonging to middle and high socioeconomic status reduces the log odd of being poor by 0.77 and 1.78, respectively. The odds of being poor for a person with middle socioeconomic status are 0.46 times the odds of a person of low socioeconomic status assuming all the other variables are equal. People who do not often spend money and regret it later are less likely to be poor than those who often spend money and regret it later. They reduce the log odds of being poor by 0.32. In education, the persons having technical education have the most significant effect in reducing poverty. Socioeconomic status and spending are highly significant predictors. District-level variation is measured = 0.2552. The intra-class correlation coefficient (ICC) for districts is measured as from Equationeq 4
(4)
(4) ,
= 0.072. This indicates districts are responsible for a 7.2% variation in poverty. The overall goodness of fit of this model is calculated by the likelihood ratio method. In this method, the multilevel model is compared with a single-level model, whereas the Chi-square test is used to compare likelihoods with 1 degree of freedom at a 5% level of significance. The Chi-square test statistic is 768.6269, and the tail area is
= 3.84. This large value of statistics indicates that there is significant variation in poverty within districts.
People’s attitude towards spending money has shown a negative correlation with education. The magnitude of negative correlation increases with increasing levels of education, whereas literate people have a positive but small correlation with the persons not spending money too often. Socioeconomic status has a small positive correlation with not spending money often and regrets it later. The middle level of socioeconomic status has little positive correlation with low levels of education. However, education at low levels is negatively associated with high socioeconomic status.
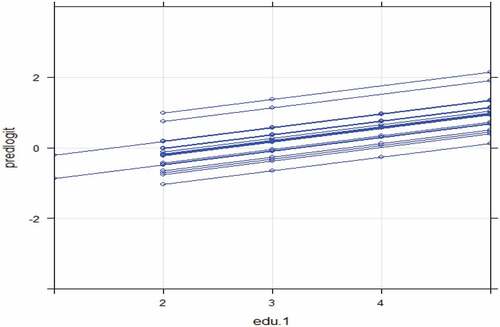
The fitted line of any particular district is different from the average line by the amount of for district j which is the effect of being in district j. All lines in Figure have different intercepts originating from the random intercept model.
Figure 1. Predicted district lines.
The examination of the level-2 error term is undertaken with the help of a caterpillar plot in Figure .
Figure 2. Caterpillar plot: Estimated residuals with 95% confidence interval.
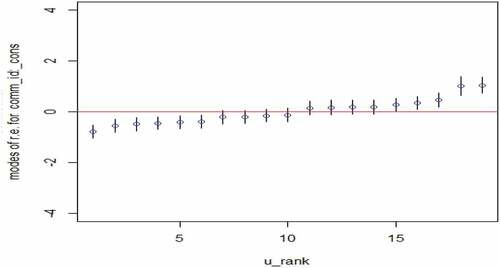
All 19 districts are ranked through their 95% confidence intervals, whereas 11 districts contain zero value. Considered districts contain a significant effect on poverty and the last two districts Nowshera and Mansehra have the highest probability of being poor and district Kasur with the lowest probability of being poor.
5. Discussion
The main purpose of this research article was to find out the factors affecting poverty in Pakistan. High levels of education, socioeconomic status, and spending behaviour were recognized as substantial determinants of household poverty. Furthermore, the prevalence of poverty is affected by area-level effects.
H. Lin et al. (Citation2022) identified relative poverty levels in pastoral areas in China based on spatial layout. The results revealed that the quality of rural life in pastoral areas was deranged and highly polarized. Eleven (61.11%) of the counties/banners had a quality of rural life less than the mean score of 0.2598. Iqbal et al. (Citation2018) explored the extremity, and degree of rural poverty among farm households in different districts of Punjab province, Pakistan by using the Foster-Greer-Thorbecke (FGT) approach and applied the logistic regression method to identify the determinants of rural poverty. It is interestingly noted that more than half of the farm households are living under the poverty line. Moreover, an inverse effect of education, off-farm income, annual unearned income, farming area, number of animals, access to credit, and adaptation is observed to several risks of poverty status. The results from literature correspond to the study findings that rural poverty level observed is 60%.
This study concluded that the chance of being poor is the least for higher educational attainment with the smallest odds. Likewise, no education at all leads to the highest probability of being poor. This result was supported by many of the studies (Awan et al., Citation2011; Delaney & Devereux, Citation2019; Eyasu & Yildiz, Citation2020; Group, Citation2016; Rizvanovic & Efendic, Citation2021; Tilak, Citation2002; Xing, Citation2010; Yakum & Kifem, Citation2018). Van Le et al. (Citation2022) observed the role of private sector development (PSD) in multidimensional poverty diminishment in Vietnam, utilizing the provincial panel data for the period 2010–2019. The study findings have shown that economic growth and educational achievement turned up as major factors allaying multidimensional and unidimensional poverty.
The outcome of the research shows that education is not the only determinant of poverty but socioeconomic status and spending behaviour are also important factors having a negative impact on poverty. Middle and high socioeconomic status indicates the reduced prevalence of poverty and shows a strong inverse relationship with education. This result is consistent with other past research (Padda & Hameed, Citation2018; Psacharopoulos & Patrinos, Citation1994; Rai et al., Citation2019; Taylor et al., Citation2013). Individual’s attitude toward spending money plays a vital role in determining household poverty. The results show that individuals or households who spend money rationally are less likely to be poor than those who spend money irrationally. Also, it shows a negative correlation with education. The literature confirms the presented analysis of a small correlation between educational levels and spending attitude.
6. Conclusion and policy implications
The results suggested that poverty is highly influenced by low education with the largest odds ratio. Socioeconomic status and spending behaviour are also significant determinants of poverty. Among all the variations in poverty, 7% variation is found due to different districts. This study identifies the key measures of poverty that can help to devise policies to reduce the poverty level in Pakistan. The district-level effects are not dominant so it can be said that uniform education policy intervention can be done in all districts. Technical education is very important for the youth. In Pakistan, technical institutions are available but with the lowest attendance, although the state provides a monthly stipend to the students. There is a need to increase the number of incentives for children to attend vocational institutions. The allocation of the budget towards education is very minimum in Pakistan. Poverty cannot be eradicated from Pakistan unless the education system is revamped. Poverty control strategies and interventions should be designed to encourage higher education, which can lead to a high socioeconomic status that in turn decreases poverty.
6.1. Limitations and future recommendations
Multilevel modelling approach is unable to address time-invariant unobservable factors. One main limitation of this study is that the recent survey was not available. Moreover, further research on a three-level multilevel model can be done for three levels of hierarchy in the data, because it can split the total variation caused by each level. Random intercept and random slope models could also be applied.
Correction
This article has been corrected with minor changes. These changes do not impact the academic content of the article.
Disclosure statement
No potential conflict of interest was reported by the authors.
Additional information
Funding
Notes on contributors
Sehar Saleem
Sehar Saleem is working as Lecturer in Department of Statistics, Lahore College for Women University, Pakistan. Her areas of interest include Econometrics.
Maria Aslam
Maria Aslam is working as Lecturer in Department of Statistics, Lahore College for Women University, Pakistan.
Rehan Ahmad Khan Sherwani
Rehan Ahmad Khan Sherwani is working as Professor in College of Statistical and Actuarial Sciences, University of the Punjab, Pakistan. His area of interest is inferential statistics and applied statistics.

Atif Khan Jadoon
Atif Khan Jadoon is working as Assistant Professor at the School of Economics, University of the Punjab, Pakistan. His areas of interest include Development Economics, International trade and Resource Economics.
Ambreen Sarwar
Ambreen Sarwar is working as Assistant Professor at the School of Economics, University of the Punjab, Pakistan. Her areas of interest include Labor Economics.
Ijaz Butt
Ijaz Butt is working as lecturer in Department ofManagement Sciences virtual university of Pakistan.
Notes
References
- Afzal, A., Nawazish, M., & Arshad, F. (2019). Conditional vs unconditional cash transfers: A study of poverty demographics in Pakistan. Economic Research-Ekonomska Istraživanja, 32(1), 3360–14. https://doi.org/10.1080/1331677X.2019.1661006
- Ahmad, R., & Faridi, M. Z. (2020). Socio-economic and demographic factors of poverty alleviation in Pakistan: A case study of Southern Punjab. Review of Economics and Development Studies, 6(2), 425–438. https://doi.org/10.47067/reads.v6i2.220
- Akerele, D., Momoh, S., Adewuyi, S. A., Phillip, B. B., & Ashaolu, O. F. (2012). Socioeconomic determinants of poverty among urban households in South-West Nigeria. International Journal of Social Economics, 39(3), 168–181. https://doi.org/10.1108/03068291211199341
- Alkire, S., & Foster, J. (2011). Understandings and misunderstandings of multidimensional poverty measurement. Journal of Economic Inequality, 9(2), 289–314. https://doi.org/10.1007/s10888-011-9181-4
- Alvaredo, F., & Gasparini, L. (2015). Recent trends in inequality and poverty in developing countries. Handbook of Income Distribution, 2, 697–805.
- Awan, M. S., Malik, N., Sarwar, H., & Waqas, M. (2011). Impact of education on poverty reduction. University Library of Munich.
- Bank, W. (2000). World development report 2000/2001: Attacking poverty: The World Bank.
- Barbier, E. B., & Hochard, J. P. (2014). Poverty and the spatial distribution of rural population. World Bank Policy Research Working Paper(7101).
- Becker, G. S. (Ed.), (1975). Front matter, human capital: A theoretical and empirical analysis, with special reference to education. In Human capital: A theoretical and empirical analysis, with special reference to education (2nd ed.) (pp. 22). NBER.
- Bhuiya, A., Mahmood, S. S., Rana, A. M., Wahed, T., Ahmed, S. M., & Chowdhury, A. M. R. (2007). A multidimensional approach to measure poverty in rural Bangladesh. Journal of Health, Population, and Nutrition, 25(2), 134.
- Castro, S. L. (2002). Data analytic methods for the analysis of multilevel questions: A comparison of intraclass correlation coefficients, rwg (j), hierarchical linear modeling, within-and between-analysis, and random group resampling. The Leadership Quarterly, 13(1), 69–93. https://doi.org/10.1016/S1048-9843(01)00105-9
- Delaney, J. M., & Devereux, P. J. (2019). More education, less volatility? The effect of education on earnings volatility over the life cycle. Journal of Labor Economics, 37(1), 101–137. https://doi.org/10.1086/698897
- Deressa, T. K., & Sharma, M. (2014). Determinant of poverty in Ethiopia. Ethiopian Journal of Economics, 23(1), 113–130.
- Eyasu, A. M., & Yildiz, F. (2020). Determinants of poverty in rural households: Evidence from North-Western Ethiopia. Cogent Food & Agriculture, 6(1), 1823652. https://doi.org/10.1080/23311932.2020.1823652
- Fafchamps, M., & Quisumbing, A. R. (1999). Human capital, productivity, and labor allocation in rural Pakistan. The Journal of Human Resources, 34(2), 369–406. https://doi.org/10.2307/146350
- Group, W. B. (2016). Ethiopia: Priorities for ending extreme poverty and promoting shared prosperity. World Bank.
- Haughton, J., & Khandker, S. R. (2009). Handbook on poverty+ inequality. World Bank Publications.
- Iqbal, M., Ping, Q., Abid, M., Abbas, A., Bashir, M., & Raza, U. (2018). Extent and determinants of rural poverty in Pakistan: Role of adopting risk management strategies. JAPS: Journal of Animal & Plant Sciences, 28(6), 1835–1845.
- Jayanthi, M., & Rau, S. (2017). An empirical study on financial literacy and spending behavior of rural household in India. Asian Journal of Management, 8(4), 1115–1119. https://doi.org/10.5958/2321-5763.2017.00170.6
- Khandker, S., & Haughton, J. (2005). Introduction to poverty analysis. World Bank Institute.
- Khan, H. R., & Shaw, E. (2011). Multilevel logistic regression analysis applied to binary contraceptive prevalence data. Journal of Data Science, 9(1), 93–110.
- Kim, R., Mohanty, S. K., & Subramanian, S. (2016). Multilevel geographies of poverty in India. World Development, 87, 349–359. https://doi.org/10.1016/j.worlddev.2016.07.001
- Knight, D. S. (2017). Are high-poverty school districts disproportionately impacted by state funding cuts? School finance equity following the great recession. Journal of Education Finance, 43(2), 169–194.
- Lin, H., Gao, Y., Zhu, T., Wu, H., Hou, P., Li, W., Hou, S., & Arshad, M. U. (2022). Measurement and identification of relative poverty level of pastoral areas: An analysis based on spatial layout. Environmental Science and Pollution Research, 29(58), 87157–87169. https://doi.org/10.1007/s11356-022-21717-6
- Lin, S., Winkler, C., Wang, S., & Chen, H. (2020). Regional determinants of poverty alleviation through entrepreneurship in China. Entrepreneurship & Regional Development, 32(1–2), 41–62. https://doi.org/10.1080/08985626.2019.1640477
- Maitra, P. (2000). The effect of household characteristics on poverty and living standards in South Africa. Available at SSRN 241109.
- Medeiros, V., Ribeiro, R. S. M., & Do Amaral, P. V. M. (2021). Infrastructure and household poverty in Brazil: A regional approach using multilevel models. World Development, 137, 105118. https://doi.org/10.1016/j.worlddev.2020.105118
- Orazem, P., Glewwe, P., & Patrinos, H. (2007). The benefits and costs of alternative strategies to improve educational outcomes. Iowa State University. Department of Economics Working Paper(07028).
- Padda, I. U. H., & Hameed, A. (2018). Estimating multidimensional poverty levels in rural Pakistan: A contribution to sustainable development policies. Journal of Cleaner Production, 197, 435–442. https://doi.org/10.1016/j.jclepro.2018.05.224
- Psacharopoulos, G., & Patrinos, H. A. (1994). Indigenous people and poverty in Latin America: An empirical analysis. The World Bank.
- Rai, K., Dua, S., & Yadav, M. (2019). Association of financial attitude, financial behaviour and financial knowledge towards financial literacy: A structural equation modeling approach. FIIB Business Review, 8(1), 51–60. https://doi.org/10.1177/2319714519826651
- Raudenbush, S. W., & Bryk, A. S. (2002). Hierarchical linear models: Applications and data analysis methods (Vol. 1). sage.
- Rizvanovic, A., & Efendic, A. (2021). The effect of education on earnings in a post-conflict economy: Evidence from Bosnia and Herzegovina. Financial Internet Quarterly (Formerly E-Finanse), 17(2), 1–15. https://doi.org/10.2478/fiqf-2021-0008
- Rowntree, B. S. (1902). Poverty: A study of town life. Macmillan.
- Runciman, W. G. (1961). Problems of research on relative deprivation. European Journal of Sociology/Archives Européennes de Sociologie, 2(2), 315–323. https://doi.org/10.1017/S0003975600000461
- Schultz, T. W. (1961). Investment in human capital. The American Economic Review, 51(1), 1–17.
- Sen, A. (1982). Poverty and famines: An essay on entitlement and deprivation. Oxford university press.
- Shefrin, H. M., & Thaler, R. H. (1988). The behavioral life‐cycle hypothesis. Economic Inquiry, 26(4), 609–643. https://doi.org/10.1111/j.1465-7295.1988.tb01520.x
- Sheikh, M. R., Akhtar, M. H., ASGHAR, M. M., & Abbas, A. (2020). Demographic and economic aspects of poverty: A case study of Multan District, Pakistan. Pakistan Economic and Social Review, 58(1), 131.
- Shirazi, N. S. (1995). Determinants of poverty in Pakistan. Pakistan Economic and Social Review, 33(1–2) , 91–101.
- Slesnick, D. T. (1993). Gaining ground: Poverty in the postwar United States. The Journal of Political Economy, 101(1), 1–38. https://doi.org/10.1086/261864
- The State of POVERTY in Pakistan PIDE Report 2021. (2021).
- Stewart, F. (1985). Basic needs in developing countries. Basic needs in developing countries.
- Taylor, R. D., Wang, M. C., & Wang, M. C. (2013). Social and emotional adjustment and family relations in ethnic minority families. Routledge.
- Team, R. C. (2012). R: A language and environment for statistical computing. http://www.R-project.org
- Teka, A. M., Woldu, G. T., & Fre, Z. (2019). Status and determinants of poverty and income inequality in pastoral and agro-pastoral communities: Household-based evidence from Afar Regional State, Ethiopia. World Development Perspectives, 15, 100123. https://doi.org/10.1016/j.wdp.2019.100123
- Tilak, J. B. (2002). Education and poverty. Journal of Human Development, 3(2), 191–207. https://doi.org/10.1080/14649880220147301
- Townsend, P. (1979). Poverty in the United Kingdom: A survey of household resources and standards of living. Univ of California Press.
- Tran, T. Q., Nguyen, H. T. T., Hoang, Q. N., & Van Nguyen, D. (2022). The influence of contextual and household factors on multidimensional poverty in rural Vietnam: A multilevel regression analysis. International Review of Economics & Finance, 78, 390–403. https://doi.org/10.1016/j.iref.2021.12.012
- Van der Berg, S. (2008). Poverty and education. Education Policy Series, 10(28), 1–28.
- Van Le, D., Tran, T. Q., & Doan, T. (2022). The private sector and multidimensional poverty reduction in Vietnam: A cross‐province panel data analysis. International Journal of Social Welfare, 31(3), 275–384. https://doi.org/10.1111/ijsw.12524
- White, H., & Booth, D. (2003). Using development goals to design country strategies 1. In Targeting development (pp. 101–119). Routledge. https://www.taylorfrancis.com/chapters/edit/10.4324/9780203403235-12/using-development-goals-design-country-strategies-1-howard-white-david-booth
- Wolff, J., & De Shalit, A. (2013). On fertile functionings: A response to Martha Nussbaum. Journal of Human Development & Capabilities, 14(1), 161–165. https://doi.org/10.1080/19452829.2013.762177
- Xing, Z. (2010). Socio-economic determinants for poverty reduction: the case of Fiji: a thesis presented in partial fulfilment of the requirements for the degree of Master of Philosophy in Economics at Massey University. Massey University.
- Yakum, I. M., & Kifem, F. L. (2018). Education and earnings inequality in cameroon. American Journal of Humanities and Social Sciences Researchs, 2(12), 01–11.