
 ?Mathematical formulae have been encoded as MathML and are displayed in this HTML version using MathJax in order to improve their display. Uncheck the box to turn MathJax off. This feature requires Javascript. Click on a formula to zoom.
Abstract
The primary purpose of this paper is to explore the herding behavior in the Chinese stock market during COVID-19 and the asymmetry of that behavior using the daily returns of A- and B-shares from 2 January 2019, to 15 October 2021. The study uses the cross-sectional absolute deviation model to analyze stock market herding behavior by non-linear polynomial regression. We show that the herding behavior in the Chinese stock market is more prominent during the COVID-19 pandemic. Herding behavior has a negative effect on stock market volatility. Moreover, such a suppressing effect weakened during the COVID-19 pandemic. There is an asymmetry in herding behavior during the bull and bear markets, which is helpful in our investigation of the market’s volatility during the COVID-19 pandemic. The pronounced asymmetry in the herding behavior of the Chinese stock market during COVID-19 is assessed using the E-GARCH (p, q) model. The empirical results of the present study contribute to the literature about herding asymmetry by showing the herding behavior during the health crisis and bull and bear markets. It also helps reconcile the debate about the impact of herding on market stability and provides insightful guidance for investors wishing to invest in the Chinese stock market.
1. Introduction
Herding behavior is defined as an investor’s imitation of the actions of others (Merli & Roger, Citation2013). This behavior is considered reasonable for investors who want to follow successful investors because of the higher cost of information acquisition. Banerjee (Citation1992) mentions that when people face information uncertainty, they are likely to be affected by the behavior of other investors and may imitate their decisions. As an emerging market in the process of economic transformation, the Chinese stock market is characterized by frequent policy interventions, profound information asymmetry, and an investor structure dominated by retail investors. Therefore, order imitations are commonly observed in the Chinese stock market, providing a suitable platform for assessing herding behavior.
Since its outbreak in 2019, COVID-19 has spread worldwide, posing a massive threat to life, health, international trade, and economic and social development. COVID-19 has caused significant volatility in financial markets and has significantly impacted investment behavior in stock markets (Wu et al., Citation2020). The panic around the COVID-19 pandemic emerged in February 2020 and was seen in the global market indices. In February 2020, the US stock market plummeted, the European stock market fell, and the Asia-pacific stock market slumped. Zach (Citation2003) notes that significant events like this might dramatically affect stock market returns. The bandwagon effect saw investors engaged in herding behavior due to bias in the face of economic and social uncertainty and the significant threat posed by COVID-19. Espinosa-Mendez and Arias (Citation2021) argue that COVID-19 might affect herding behavior in two directions. First, investors faced with medical and social uncertainty consider other informed agents and follow their behavior. Second, the informed agents might carry out strategies to arbitrage the market for their benefit and to the detriment of uninformed investors.
Raafat et al. (Citation2009) summarize the history of herding theory, where the herding model is classified into pattern-based and transmission-based approaches. Bikhchandani and Sharma (Citation2000) classify herds into information-, reputation-, and compensation-based herdings. Sias (Citation2004) further distinguishes herding into self and other herdings. N. Choi and Sias (Citation2009) noted the industry component of herding. Although there is widespread evidence of herding behavior, the impact of herding on stock market stability is still under debate. For example, Wermers (Citation1999) and Nofsinger and Sias (Citation1999) have opposite views about whether herding stabilizes or destabilizes the financial market.
The debate regarding herding behavior asymmetry presents conflicting viewpoints. For instance, Papadamou et al. (Citation2021) and Vidal-Tomás et al. (Citation2019) disagree on whether herding is more intense during bull or bear markets. C. C. Lee et al. (Citation2013) analyzed recent daily data from 17 May 2001, to 16 May 2011, and found strong evidence of industry herding in Chinese A-share markets, with herding more pronounced in specific sectors during bull markets. Conversely, Yao et al. (Citation2014) demonstrated that herding behavior is more evident in declining markets and diminishes over their sample period. Chong et al. (Citation2017) detected robust herding evidence in both up and down markets, attributing analyst recommendations, short-term investor horizons, and risk as primary herding causes in China. Regarding the COVID-19 impact, Wu et al. (Citation2020) discovered lower-than-usual herding behavior in Chinese stock markets during the COVID-19 pandemic. They observed more pronounced herding for upside market movements, lower trading volumes, and reduced volatility induced by COVID-19. In contrast, Mandaci and Cagli (Citation2022) indicated that the COVID-19 outbreak intensified herding behavior, while Ferreruela and Mallor (Citation2021) detected herding on high volatility days during the pandemic. Bharti and Kumar (Citation2022) examined the herding in the Indian market during the COVID-19 pandemic and found significant herding exacerbated by market volatility.
Moreover, there are conflicting results in existing empirical studies on herding behavior in the Chinese stock market. Yao et al. (Citation2014) found a herding effect in the daily and weekly returns of B-share stocks listed on the Shanghai Stock Exchange (SHSE) and the Shenzhen Stock Exchange (SZSE) between 1999 and 2008. Likewise, Mahmud and Tinic (Citation2018) examine the daily returns of A-Shares in the Shanghai 300 Index and B-shares on the SHSE and SZSE from 2003 to 2014. They find that the herding behavior in the Chinese A-share market is much more prominent than in the B-share market. The models underlying the contradictory empirical findings may reflect only the different herding behaviors over different sample periods. In addition, most studies focus on describing the herding behavior in the Chinese stock market during the COVID-19 pandemic. Very few studies have been devoted to the impact of herding on subsequent stock returns. Moreover, there are rare studies on asymmetric herding behavior in the Chinese stock market during COVID-19.
This paper aims to explore herding behavior in the Chinese stock market amid the COVID-19 pandemic. We utilize daily data from 2 January 2019, to 15 October 2021, to facilitate our analysis. To rigorously investigate herding behavior, we employ a variety of methodologies, including the cross-sectional absolute deviation (CSAD) model, volatility measures, and the E-GARCH model. Our findings reveal that herding in Chinese stocks, encompassing both CSI-indexed and B-share stocks is more pronounced during the COVID-19 pandemic compared to the pre-pandemic period. Moreover, we discover that herding exerts a suppressing effect on stock market volatility. However, this suppressing influence weakens during the COVID-19 pandemic, possibly due to increased market uncertainty and heightened investor concerns. Furthermore, our analysis unveils an asymmetric pattern in herding behavior. We observe that herding is more potent during bull markets than bear markets. Moreover, negative news and events are more strongly influenced by herding than positive ones. This asymmetric pattern highlights the sensitivity of herding behavior to adverse market conditions, which might be exacerbated during periods of crisis like the COVID-19 pandemic.
The main contributions of this paper are as follows. First, unlike some existing research on herding behavior in the Chinese stock market in the past, this study examines herding behavior during the recent COVID-19 pandemic. Second, this study examines the Chinese stock market volatility responses to herding behavior during the pandemic, providing additional investment criteria to guide those wishing to invest in that market. Third, the research also offers evidence of asymmetric herding in the Chinese stock market.
This paper is organized as follows: Section 2 provides a literature review. Section 3 describes the data and model. Section 4 presents the results and analysis, and Section 5 concludes.
2. Literature review and hypotheses development
In their assessment of herding behavior in the Chinese stock market, Hilliard and Zhang (Citation2015) argue that herding will gradually decrease as the market matures. Mahmud and Tinic (Citation2018) and Yao et al. (Citation2014) reach an opposite conclusion regarding herding behavior in the Chinese A-share and B-share markets. However, the presence and impact of herding behavior in the Chinese stock market in the wake of the COVID-19 pandemic are more ambiguous. In the following chapters, we review herding behaviors and the impact of COVID-19 on stock markets.
2.1. Herding behavior
Keynes (Citation1936) first discussed the motivations for following the crowd in a world of uncertainty, which gave rise to the herding theory. In Keynes’ view, individuals do not process new information efficiently as they do not know which information is relevant. Conventional behavior quickly turns into herd behavior. In psychology, herding is a form of convergent social behavior broadly defined as the alignment of the thoughts or behaviors of individuals in a group (herd) through local interaction and without centralized coordination (Raafat et al., Citation2009). Lakonishok et al. (Citation1992) and Nofsinger and Sias (Citation1999) also noted the herding behavior. They find that institutional trading has an impact on stock prices in two ways: (1) herding, which refers to buying (selling) simultaneously the same stocks as other managers buy (sell), and (2) positive-feedback trading, which refers to buying past winners and selling past losers. These two aspects of trading are commonly a part of the argument that institutions destabilize stock prices. Bikhchandani and Sharma (Citation2000) provide an overview of the recent theoretical and empirical research on herd behavior in financial markets. They classify herds into information-, reputation-, and compensation-based herdings. Sias (Citation2004) further distinguishes the herding by following their lag trades or following each other into and out of the same securities. He found that momentum trading can not explain herding behavior. N. Choi and Sias (Citation2009) reveal strong evidence of institutional herding within the same industry. Chong et al. (Citation2017) point out that herding can be of two types, spurious or intentional. The former refers to clusters of investment decisions due to similar underlying information, while the latter refers to situations where investors follow each other’s trading decisions regardless of their beliefs. Theoretical contributions emphasize that in financial markets, the fact that prices adjust to order flow makes herding behavior more difficult to emerge than in other settings, such as those studied in the social learning literature, without price-setting mechanisms.
The empirical results about the impact of herding on market stability are mixed. Wermers (Citation1999) shows that herding is rational and speeds the price-adjustment process. Dasgupta et al. (Citation2011a, Citation2011b) find that institutional herding positively predicts short-term returns but negatively predicts long-term returns and offer a theoretical resolution to this dichotomy. In the long run, persistent institutional herding stabilizes the financial market. Chen et al. (Citation2012) reveal that foreign institutional investors demonstrated contrarian trading strategies to stabilize future industrial returns during the financial crisis; they bought past losers to support the prices and sold past winners to suppress the price volatility. In contrast, Nofsinger and Sias (Citation1999) document a strong positive correlation between changes in institutional ownership and returns measured over the same period. Based on Japanese data from 1975 to 2003, E. C. Chang and Dong (Citation2006) show that institutional herding is positively related to idiosyncratic volatility.
Alfarano et al. (Citation2005) proposed an asymmetric herding model. The asymmetry of the transitions between the two groups, fundamentalists and noise traders, is not always rejected by the data in favor of a symmetric framework. Chan and Lakonishok (Citation1993) examine the price effect of institutional stock trading and find that the price pressure is slight. There is also a marked asymmetry between the price impact of buys versus sells. Wermers (Citation1999) classifies herding into buy and sell herdings. He finds that stocks that mutual fund managers herd buy outperform stocks they sell by four percent during the following six months. Kallinterakis and Wang (Citation2019) investigate herding and its possible determinants in the cryptocurrency market. Herding is significant and strongly asymmetric (appearing more decisive during up-markets, low volatility, and high volume days). Papadamou et al. (Citation2021) also find that herding intensifies during the bull market. On the contrary, Vidal-Tomás et al. (Citation2019) indicate that herding behavior is more evident during bear than bull markets.
2.2. The impact of COVID-19 on the stock market
Baldwin and Mauro (Citation2020) estimate that COVID-19 will cause the GDPs of China and the rest of the world to drop by 6.2% and 5.9%, respectively. Although China’s real GDP growth rate turned out to be 2.2% in 2020, it has been the lowest growth rate since 1976.Footnote1 Many researchers, including Khanthavit (Citation2020) and Luu and Luong (Citation2020), suggest that investors in the stock market are strongly negatively affected by COVID-19. This view is confirmed by the studies about the impact of the pandemic on other stock markets, such as South Korea (C. Choi & Jung, Citation2022), Vietnam (Luu & Luong, Citation2020), Russia and Poland (Fang et al., Citation2021), and Malaysia (K. Y. M. Lee et al., Citation2020). Based on US energy sector data, C. L. Chang et al. (Citation2020) find that herding behavior was more evident during COVID-19 and had substantial cross-sector spillover effects. Using stock data for France, Germany, Italy, and the United Kingdom, Espinosa-Mendez and Arias (Citation2021) show that COVID-19 increased herding behavior in capital markets; investors were driven by fear of extremes and market uncertainty to follow winners. Endri et al. (Citation2021) examined the response of Indonesian stock markets to the COVID-19 pandemic using an event study approach. Their empirical results document negative abnormal returns during COVID-19 and show that the COVID-19 event caused stock price volatility. Nurhayati et al. (Citation2021) used the Sharpe ratio, Treynor ratio, and Jensen’s alpha to evaluate the risk-adjusted performance of the Indonesian stock market during the COVID-19 pandemic. Their empirical results show that large-market-capitalization stocks underperformed during the COVID-19 pandemic, and the risk of investing in stocks is very high. Based on the above literature, we propose hypothesis 1.
H1:
The herding behavior in the Chinese stock market is strengthened during COVID-19 than before.
2.3. Herding’s effects on the Chinese stock market
Zhang et al. (Citation2021) point out that herding impacts the Chinese stock market’s stability and reduces the investment market’s efficiency. C. C. Lee et al. (Citation2013) hold the same view, finding that the herding caused a lack of stability in the Chinese stock market and may be responsible for stock prices deviating from their fundamental values. However, they also point out that asymmetric herding in a bull market is helpful for investors’ portfolio decisions and profitable trading strategies. Yao et al. (Citation2014) emphasize that an investment diversification strategy is less efficient in a stock market with herding behavior than one without herding. In general, herding behavior has a negative effect on stock markets. Analyzing the herding behavior of US stock markets during COVID-19, Yasir and Önder (Citation2021) find that investors may benefit less from asset diversification, leading to inefficient markets. Therefore, we propose hypothesis 2.
H2:
Herding has a negative impact on the volatility of the Chinese stock market.
2.4. Asymmetrical herding behavior in the Chinese stock market
Li et al. (Citation2018) argue that herding behavior has significant asymmetry. There are two opposing views on this point in the literature. Chiang and Zheng (Citation2010) believe that for Asian stock markets, herding behavior is more likely to occur in rising markets. This view is supported by Chong et al. (Citation2017), who emphasizes that investors suppress their opinions in growing markets, reinforcing herding behavior. By contrast, Yao et al. (Citation2014) argue that investors follow the winners more often due to their lower confidence and increased risk aversion when markets fall. C. Li et al. (Citation2019) support this view, and their results show more herding behaviors in bear than in bull markets.
As suggested in the above discussion, there is significant asymmetry in herding behavior, but it is unclear whether this occurs more in rising or falling markets. On this basis, we propose hypothesis 3.
H3:
Herding behavior in the Chinese stock market is asymmetrical during COVID-19.
3. Data and methodology
3.1. Data
The data used in this study are retrieved from the China Stock Market & Accounting Research Database (CSMAR) and the Wind Economic Database (WIND). The sample period is from 2 January 2019, to 15 October 2021.
We obtained the daily return, daily closing price, realized index volatility, and market value of tradable A- and B-shares from 2 January 2019, to 15 October 2021. For A-shares, we select the CSI-300 index, which includes stocks listed on the SHSE and SZSE. For B-shares, we make adjustments to account for the exchange rate impact. From WIND, we obtained the daily market return, highest price, lowest price, and closing price of the CSI-300 and B-share indices from 2 January 2019, to 15 October 2021.
The most extensive outbreak of COVID-19 occurred in China in January 2020. In order to ensure the typicality of the samples, stocks issued after February 2020 and stocks with Special-Treatment (ST) were excluded. ST stocks represent companies that suffer financial distress and have the potential to delist. The final sample includes 276 A-shares (component stocks of the CSI-300 index) and 91 B-shares. Since stocks are traded five days a week, the number of observations is 675 days, covering from 2 January 2019, to 15 October 2021.
3.2. Methodology
We use the CSAD model proposed by E. C. Chang et al. (Citation2000) to analyze the herding effect in the Chinese stock market during COVID-19. This model is based on the cross-sectional standard deviation (CSSD) model proposed by Christie and Huang (Citation1995). Compared with the CSSD model, the CSAD model adopts the absolute deviation as variables and is more sensitive to detecting herding behaviors than the CSSD model. In addition, the CSAD model is based on the rational capital asset pricing model (CAPM). Therefore, when the empirical results reject the reasonable hypothesis, it indicates certain irrational factors in the market.
First, we follow Chang et al.’s (Citation2000) definition of CSAD and assume that there are N stocks in the market, the stock return on a trading day is expressed as Ri,t, and Rm,t is the rate of return of the average market portfolio at time t. The stock return is calculated in logarithmic form. The cross-sectional absolute deviation of returns on trading day t is
According to EquationEquation (1)(1)
(1) , if the market has a pronounced herding effect, the rate of returns on stocks and market portfolio will converge. If there is no noticeable herding effect, the difference is inconsistent, and the dispersion is significant.
Table shows the descriptive statistics for the sample stocks from 2 January 2019, to 15 October 2021. Our sample includes 276 CSI-300 stocks and 91 B-shares. The average cross-sectional absolute return deviation of the CSI-300 is 1.62%, and of B-shares is 1.01%, close to the average cross-sectional absolute return deviation for the CSI-300 index of 1.60% and B-shares of 2.25% reported in Mahmud and Tinic (Citation2018). The kurtosis of the absolute value deviation of the B-strand cross-section is higher, indicating that more data is distributed away from the mean.
Table 1. Descriptive statistics
The CSAD model is established under the theoretical framework of the CAPM (Black, Citation1972). The CAPM assumes that 0 is the return rate of risk-free assets,
is the risk premium of asset i, βi is the risk coefficient of stock i, and βm is the systematic risk coefficient of a market portfolio. The CAPM is based on rational assumptions and is expressed as follows.
Assuming that , we can derive the absolute value of the deviation of returns:
Then the expected cross-sectional absolute deviation of return is:
The right-hand side of EquationEquation (4)(4)
(4) is taken partial derivative to obtain the linear relationship between the CSAD and the market rate of return:
According to EquationEquations (5(5)
(5) ) and (Equation6
(6)
(6) ), the second derivative equals zero, and the first derivative is positive, so CSAD is linearly related to the market rate of return
.
However, when investors in the market show irrational behaviors, the premise of the CAPM fails, and a single linear regression equation cannot describe the relationship between CSAD and Rm,t. The correlation between CSAD and market return changes from an increasing linear to a non-linear function and even decreases when the herding effect is profound. For simplicity, we used Yao et al.’s (Citation2014) improved CSAD model and adopted a polynomial non-linear regression equation:
and
are regression coefficients. A significantly negative coefficient β2 in EquationEquation (7)
(7)
(7) indicates the existence of herding behavior in general. CSAD is not a herding measure; instead, the non-linear relationship between CSAD and Rm,t is used to detect herd behavior.
To examine the impact of herding behavior on stock market volatility, we downloaded realized volatility from CSMAR. According to the CSMAR manual, the realized volatility is measured as follows.
Rt,d is five-minute stock return in logarithm form at five-minute interval d in day t. The market is open for four hours each trading day, corresponding to 48 intervals of five minutes. The realized volatility is essentially a daily variance measure of five-minute stock returns.
The impact of herding behavior on the volatility of the index during COVID-19 is determined using the following model:
Since volatility is affected by the return rate of the previous period Rm,t-1, the measure of herding behavior, CSAD is also lagged for one period. Vm,t is the daily circulation market value. When 1 is significantly positive, it indicates that the increase in herding behavior (i.e., a decrease in CSAD) leads to a decrease in stock volatility; if it is significantly negative, the result is the opposite.
In general, volatility is higher when the stock market falls than rises. Therefore, we must first distinguish herding behaviors in bull and bear markets. We introduce a dummy variable D to analyze bear and bull days. The sample period was separated into two parts, the first period includes all bull days on which Rm increases, and the other period includes all bear days on which Rm decreases. When the market return Rm<0, then D = 1; when Rm≥0, then D = 0. Therefore, the improved formula is:
In addition, we investigate the asymmetry of herding behavior in the stock market; that is, we investigate whether herding behavior is affected more by good or bad news. Given that the CSAD model may have heteroscedasticity and non-linear characteristics, and the study aims to test the asymmetry of herding behavior on market-return fluctuations, this paper adopts the E-GARCH model:
4. Results
This study explores the impact of COVID-19 on herding behavior in the Chinese stock market. The first case of COVID-19 in China appeared on 12 December 2019, so we divided the sample time into two periods. One is before the outbreak of COVID-19 from 2 January 2019, to 11 December 2019. The second period is after the outbreak, from 12 December 2019, to 15 October 2021. We compare and analyze these two sample periods using MATLAB and Stata.
4.1. Stationarity tests
Time series data are used in this study, and pseudo-regression may exist. Therefore, a stationarity test is conducted before regression analysis. The Augmented Dickey-Fuller (ADF) test is conducted using Stata, and the results are shown in Table .
Table 2. Stationarity tests
The ADF values of CSAD, Rm, and Rm2 of the CSI-300 and B-shares are all less than the critical value at the 1% significance levels, indicating that the data are stationary. Consequently, regression analysis can be performed directly without differential data processes.
4.2. Scatter plots
The data are stationary. We conducted a correlation analysis. Note that the relationship between CSAD and Rm may be non-linear. Consequently, it is necessary to check whether there is herding behavior by fitting the raw data in the scatter plot with an optimal curve.
The four panels in Figure show the scatter diagrams between CSAD and Rm before and after the COVID-19 outbreak and the best-fitting curve. The appropriate angle indicates no noticeable rising trend for the CSI-300 and B-share indices before and during COVID-19. Hence, there is no apparent linear relationship. Additionally, there is a decline in the latter part of the fitting curve. Therefore, a preliminary conclusion can be made that the CSI-300 and B-share indices exhibit herding behavior before and during COVID-19.
Figure 1. Scatter plot and fitting curve.
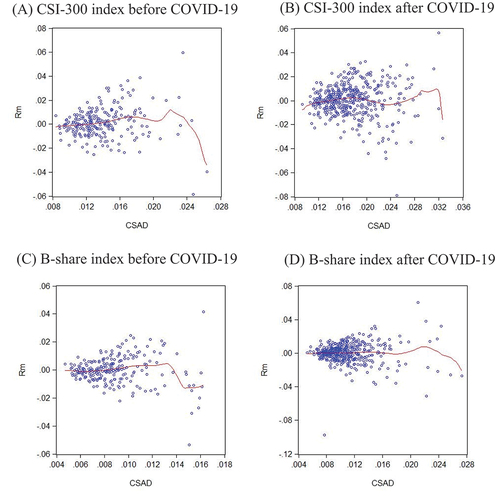
The figure reports the scatter plots between CSAD and market return Rm. We use MATLAB to generate a scatter diagram and obtain the best-fitting curve. Panels A and B illustrate the CSI-300 index before and after COVID-19. Panels C and D illustrate the B-shares index before and after COVID-19.
4.3. Testing COVID-19 herding behavior
The impact of COVID-19 on the market’s herding behavior is tested based on the quadratic regression in EquationEquation (7)(7)
(7) using the CSI-300 and B-share indices in sample periods before and after the pandemic, and Table shows the regression results.
Table 3. Regression results of herding behavior before and during COVID-19
The regression results show that β2 for the CSI-indexed stocks is positive and significantly different from zero before the outbreak of COVID-19. It indicates no significant herding behavior in the CSI-indexed stocks prior to COVID-19. However, after the outbreak, β2 is significantly negative, showing a marginal decreasing trend between CSAD and market return, and the relationship is non-linear. Thus, herding behavior appears in the CSI-indexed stocks after the outbreak of COVID-19.
According to the B-share regression results, the β2 for B-share stocks is significantly negative before and after the outbreak of COVID-19, indicating a marginal decreasing trend between CSAD and market return, which is non-linear. Therefore, the B-share stocks exhibit herding behavior before and after the outbreak of COVID-19. The absolute value of β2 after the outbreak was more prominent than before the pandemic; consequently, the herding effect after the outbreak of COVID-19 was more evident than in the preceding period.
4.4. Effect of herding behavior on market volatility
For Hypothesis 2, the volatility change of the Chinese stock market as a result of herding behavior before and after COVID-19 is tested using EquationEquation (10)(10)
(10) ; we thus focus on
1.
Table shows the regression results. Panel A shows the entire sample period for the CSI-300 and B-share indices. The value of 1 is significantly positive, suggesting that high CSAD values (low herding behavior) lead to high market volatility. Therefore herding behavior significantly suppresses market volatility. Additionally, the coefficient for the CSI-300 index is more prominent in magnitude than that for the B-share index. Therefore, the negative impact of herding on market volatility is more evident in the CSI-300 index than in the B-share index.
Table 4. Impact of herding behavior on market volatility
Panels B and C show regression results before and during COVID-19. The 1 value of the CSI-300 and B-share indices dropped following the COVID-19 outbreak. Therefore, the sensitivity of market volatility to herding behavior weakened during COVID-19.
4.5. Herding behavior in bull and bear markets
The asymmetry of herding behavior in the stock market is considered by dividing the sample into bull and bear markets. However, since it is not easy to define these markets over a short period from 2019 to 2021, the rising dates are positioned as bull days, and the falling dates are arranged as bear days to determine if there is asymmetry.
Table shows the empirical results using EquationEquation (11)(11)
(11) for bull and bear days. The sample is from 12 December 2019, to 15 October 2021, after the outbreak of COVID-19. The CSI-300 index includes 243 bull days and 202 bear days. The B-share index includes 242 bull days and 203 bear days. We construct the dummy variable
, which is assigned the value of one on bear days and zero on bull days. The coefficient is negative for the bull-market days of the CSI-300 index, so herding behavior is influential. In a bear market, by contrast, the coefficient is positive. In the B-shares index market, there is a non-linear decreasing correlation between the absolute deviation of the cross-section and the market return rate. This result means that investors show more marked herding behavior in bull markets.
Table 5. Regression results in bear and bull markets
The bear market sample has a positive coefficient for the B-share index, while a bull market has a negative coefficient. Therefore, there is significant herding behavior for the B-share index in a bull market. CSI-300 and B-shares show more significant herding behavior in bull markets during the pandemic, exhibiting asymmetry in both rising and falling stock market environments.
4.6. Testing asymmetry of herding behavior in COVID-19 with E-GARCH
In previous sections, we have found the herding behavior in the stock market during COVID-19. We test the herding asymmetry in Hypothesis 3 by performing a heteroscedasticity test using Stata’s White trial, the result of which is a p-value of the CSI-300 index of less than 0.1. Hence, we can consider the possibility of heteroscedasticity in the index. The p-value for B-shares equals 0.0000; the null hypothesis of homoscedasticity is thus rejected, and heteroscedasticity is assumed. Since fluctuation aggregation exists, an autoregressive model is considered by comparison with the E-GARCH model, and information criteria are used to determine the order of the autoregressive model. Table shows the results. It is clear from the tenth-order lag of the CSI-300 index that most benchmarks indicate the AR (10) model should be selected. For B-shares, the fifth- or fourth-order lag should be selected.
Table 6. Order of autoregressive model—information criterion
The heteroscedasticity and asymmetry of the sequence are further tested by adopting the E-GARCH model. Nelson (Citation1991) proposes the E-GARCH model to overcome the problems of the GARCH model in dealing with financial time series. It can measure the asymmetry in positive and negative effects.
Cokcan (Citation2000) compares the linear GARCH and non-linear E-GARCH models using the monthly stock returns of seven emerging countries. The E-GARCH model allows good news (positive return shocks) and bad news (adverse return shocks) to impact volatility differently. Lanne and Saikkonen (Citation2005) proposed a new class of non-linear GARCH model using a lagged value of conditional variance as the transition variable. Such a model is motivated by the desire to model time series with highly persistent volatility. Sharma et al. (Citation2021) also compare the linear and non-linear GARCH models and find that GARCH(1,1) model is superior to non-linear GARCH models for forecasting volatility because the effect of leverage is insignificant. Nonetheless, Lin (Citation2018) found that the E-GARCH model outperformed the GARCH(1,1) model in the Chinese stock market. In order to test the leverage effect (bad news causes greater volatility than good news), we employ the E-GARCH model to predict the herding of Chinese stock markets.
Comparing the least-squares method and the E-GARCH model provides an intuitive sense of asymmetry. Figure shows the time trends of CSAD for the CSI-300 and B-share indices. The fluctuations in volatility are apparent. Both panels A and B show that the two stock indexes have evidence of volatility aggregation.
Figure 2. Time trends of CSAD.
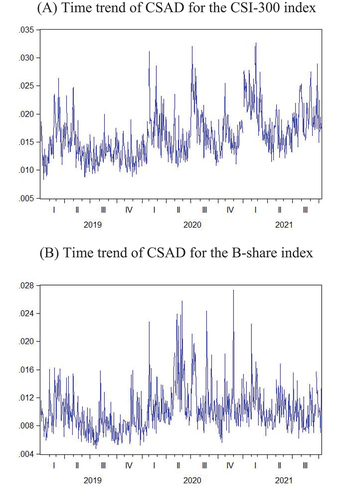
Time trend charts of cross-sectional absolute deviation of returns.
The coefficient 2 in EquationEquation (14)
(14)
(14) is negative. Therefore, it is possible to consider the presence of asymmetry in the herding behavior of the CSI-300 index during COVID-19; in other words, the impact of bad news is more profound than good news. The coefficient
2 for B-shares is also negative. Therefore, B-shares and the CSI-300 index exhibit asymmetrical herding behavior during COVID-19. A comparison of the magnitudes of
2 for the two stock indexes shows
2 of B-shares is greater, which means that the herding behavior of B-shares is more pronounced in response to bad news.
4.7. Robust check of herding asymmetry with threshold GARCH
As a robustness check on herding asymmetry, we employ the threshold GARCH model for treating positive and negative news asymmetrically. The results are presented in Table . For the CSI-300 index, when the shock is positive (i.e., good news), the effect on volatility is 0.264, but when the shock is negative (i.e., bad news), the effect on volatility is 0.479 ( = 0.264 + 0.215). Hence, the coefficient on Tarch L1 is significant and positive. Adverse shocks have a larger effect on volatility than positive shocks. Likewise, for the B-share index, we observe a positive coefficient, 0.296, which is significant at the 1% level, confirming that negative news has a more significant impact on volatility than good news. Overall, the robustness checks in Table confirm the E-GARCH results in Table .
Table 8. Threshold GARCH model
Table 7. OLS vs. E-GARCH models
5. Discussions and implications
Figure shows that the relationship between CSAD and the market return is not linear. Note that CSAD is not a measure of herding. Instead, the relationship between CSAD and Rm is used to detect herd behavior. If no herd exists and the CAPM model is valid, EquationEquations (5(5)
(5) ) and (Equation6
(6)
(6) ) suggest that we expect a linear relationship between CSAD and Rm. During significant price swings in the health crisis, market participants may face higher information asymmetry and herd with other investors, resulting in lower CSAD values at large Rm values. Therefore, a non-linear and concave relation between CSAD and Rm would result. A significantly negative coefficient would capture the nonlinearity of the squared market return in EquationEquation (7)
(7)
(7) . The β2 for the CSI-indexed stocks is positive before COVID-19 and negative during COVID, indicating that herding in CSI-indexed stocks appears only after the outbreak of COVID-19. Likewise, the magnitude of β2 for the B-share stocks increases during COVID-19. Both observations offer support to Hypothesis 1. Namely, the herding behavior in the Chinese stock market is strengthened during COVID-19 than before.
Our findings reveal that herding behavior in the Chinese stock market intensified during the COVID-19 pandemic compared to before, which aligns with Keynes’ (Citation1936) original herding theory. This theory suggests that individuals do not process new information efficiently during increased uncertainty, such as during the COVID-19 pandemic. While some studies, like C. L. Chang et al. (Citation2020) and Espinosa-Mendez and Arias (Citation2021), support the notion of increased herding behavior during the pandemic, others, such as Wu et al. (Citation2020), report lower-than-usual herding in the Chinese market. This contrast in findings highlights the complexity of herding behavior and its responsiveness to different factors during times of crisis.
The value of 1 in Panel A of Table is significantly positive, suggesting that herding negatively impacts market volatility. This result helps reconcile the debate whether herding could exacerbate price volatility (E. C. Chang & Dong, Citation2006; Nofsinger & Sias, Citation1999) or suppress price volatility (Chen et al., Citation2012; Dasgupta et al., Citation2011a, Citation2011b; Wermers, Citation1999). Our finding that herding negatively impacts market volatility aligns with some previous research, such as Wermers (Citation1999), who suggests that herding accelerates the price-adjustment process, and Dasgupta et al. (Citation2011a, Citation2011b), who indicate that persistent institutional herding stabilizes the financial market in the long run. However, there are contrasting views in the literature, with Nofsinger and Sias (Citation1999) and E. C. Chang and Dong (Citation2006) reporting a positive relationship between herding and market volatility. Furthermore, Wu et al. (Citation2020) and Ferreruela and Mallor (Citation2021) reveal mixed findings on herding and volatility during the COVID-19 pandemic. These mixed results highlight the complex nature of herding behavior and its impact on market volatility.
We also find that the negative impact of herding on market volatility diminishes during COVID-19 than before. This counter-intuitive observation is presumably because of the diminishing marginal impact of herding in volatile markets. When the market volatility is already very high during COVID-19, the marginal contribution of herding to price volatility might be small.
When no herds exist, we expect a positive linear relationship between CSAD and Rm. The β2 in Table is significantly positive, while β1 is significantly negative and deviates from the prediction of EquationEquation (5)(5)
(5) . Therefore, CSI-300 and B-shares show more herding behavior in a bull market than in a bear market. In the bull market, investors are optimistic and have more incentive to exchange information with others and herd more. In the bear market, investors tend to hold on to losing shares for psychological reasons and exchange less information with other investors. Our finding that herding is more pronounced in bull markets than bear markets is supported by studies like Papadamou et al. (Citation2021) and C. C. Lee et al. (Citation2013), who observed stronger herding during bullish periods. However, other researchers, such as Vidal-Tomás et al. (Citation2019) and Yao et al. (Citation2014), have found the opposite, with herding more evident in bear markets. Chong et al. (Citation2017) detected strong herding in both up and down markets, indicating herding in various market conditions. This divergence in research findings underscores the complexity of herding behavior and its influence on market dynamics, with no consensus on whether it is more prevalent during bull or bear markets.
GARCH processes differ from homoskedastic models, which assume constant volatility and are used in fundamental OLS analysis. An advantage of the E-GARCH model over the GARCH model is that it incorporates the asymmetries in stock return volatilities. The 2 in EquationEquation (14)
(14)
(14) captures such an asymmetry. The negative
2 value implies that negative innovations (unanticipated price decreases) are more destabilizing than positive innovations. The effect appears strong (−0.084) and is comparable to the symmetric effect (0.137) for B-shares. Nevertheless, the effect appears weak (−0.006) and is less than the symmetric effect (0.153) for the CSI-300 index. Therefore the market volatility of B-shares is more sensitive to bad news than that of the CSI-300 index. The investors in the CSI-300 market appear more rational than those in the B-share market.
6. Conclusions
Our paper reveals the impact of herding behavior on Chinese stock market volatility and its asymmetry during COVID-19. The results show that herding behavior is more prevalent during COVID-19 than in the preceding period. The results also illustrate that herding behavior in the CSI-300 sample is not as significant as for B-shares before and after the COVID-19 outbreak; this outcome is the same as in Yao et al. (Citation2014).
We also find that market volatility is negatively affected by herding behavior. We can, therefore, conclude that herding behavior suppresses market volatility. The regression results show that the sensitivity of market volatility to herding behavior weakened during COVID-19.
In addition, we examine the asymmetry of herding behavior in bull and bear markets. The regression results show that herding behavior in the Chinese stock market is more significant in a bull market. In addition, the CSI-300 stock index exhibits asymmetry; bad news affects the herding behavior fluctuations of A-shares more than good news. In brief, we argue that since the market was depressed when COVID-19 occurred, the increase in herding behavior led to lower market volatility than before the outbreak.
The paper’s main contribution is its focus on the Chinese stock market during the COVID-19 pandemic and assessing the relationship between the sensitivity of market volatility and herding behavior. Second, this study provides evidence of the performance of the Chinese stock market during significant health events. It also guides investors wishing to invest in the Chinese stock market. Third, the research sets out the characteristics of Chinese stock market volatility.
Several areas require further study. First, our sample period is relatively short and confined to COVID-19. Due to the short sample period, we can only divide the sample into bull and bear days to test asymmetry in bull and bear markets. Second, since many retail investors are in the Chinese stock market, our research mainly considers the general herding behavior and does not distinguish institutional herding from retail investor herding. We leave the distinction for future research.
Disclosure statement
No potential conflict of interest was reported by the authors.
Additional information
Funding
Notes
References
- Alfarano, S., Lux, T., & Wagner, F. (2005). Estimation of agent-based models: The case of an asymmetric herding model. Computational Economics, 26(1), 19–19. https://doi.org/10.1007/s10614-005-6415-1
- Baldwin, R., & diMauro, B. W. Eds., (2020) Economics in the time of COVID-19. Centre for Economic Policy Research (CEPR), VoxEU.Org eBook. CEPR Press. https://cepr.org/system/files/publication-files/60120-economics_in_the_time_of_covid_19.pdf
- Banerjee, A. V. (1992). A simple model of herd behavior. The Quarterly Journal of Economics, 107(3), 7797–7817. https://doi.org/10.2307/2118364
- Bharti, B., & Kumar, A. (2022). Exploring herding behaviour in Indian equity market during COVID-19 pandemic: Impact of volatility and government response. Millennial Asia, 13(3), 513–531. https://doi.org/10.1177/09763996211020687
- Bikhchandani, S., & Sharma, S. (2000). Herd behavior in financial markets. IMF Staff Papers, 47(3), 279–310. https://doi.org/10.2139/ssrn.228343
- Black, F. (1972). Capital market equilibrium with restricted borrowing. The Journal of Business, 45(3), 444–455. https://doi.org/10.1086/295472
- Chang, E. C., Cheng, J. W., & Khorana, A. (2000). An examination of herd behavior in equity markets: An international perspective. Journal of Banking and Finance, 24(10), 1651. https://doi.org/10.1016/S0378-4266(99)00096-5
- Chang, E. C., & Dong, S. (2006). Idiosyncratic volatility, fundamentals, and institutional herding: Evidence from the Japanese stock market. Pacific-Basin Finance Journal, 14(2), 135–154. https://doi.org/10.1016/j.pacfin.2005.09.001
- Chang, C. L., McAleer, M., & Wang, Y. A. (2020). Herding behaviour in energy stock markets during the global financial crisis, SARS, and ongoing COVID-19. Renewable and Sustainable Energy Reviews, 134, 15. https://doi.org/10.1016/j.rser.2020.110349
- Chan, L. K., & Lakonishok, J. (1993). Institutional trades and intraday stock price behavior. Journal of Financial Economics, 33(2), 173–199. https://doi.org/10.1016/0304-405X(93)90003-T
- Chen, Y. F., Yang, S. Y., Lin, F. L., Yu, S., & Yu, S. (2012). Foreign institutional industrial herding in Taiwan stock market. Managerial Finance, 38(3), 325–340. https://doi.org/10.1108/03074351211201442
- Chiang, T. C., & Zheng, D. Z. (2010). An empirical analysis of herd behavior in global stock markets. Journal of Banking & Finance, 34(8), 1911–1921. https://doi.org/10.1016/j.jbankfin.2009.12.014
- Choi, C., & Jung, H. (2022). COVID-19’s impacts on the Korean stock market. Applied Economics Letters, 29(11), 974–978. https://doi.org/10.1080/13504851.2021.1904099
- Choi, N., & Sias, R. W. (2009). Institutional industry herding. Journal of Financial Economics, 94(3), 469–491. https://doi.org/10.1016/j.jfineco.2008.12.009
- Chong, T. T. L., Liu, X. J., & Zhu, C. Q. (2017). What explains herd behavior in the Chinese stock market? Journal of Behavioral Finance, 18(4), 448–456. https://doi.org/10.1080/15427560.2017.1365365
- Christie, W. G., & Huang, R. D. (1995). Following the pied piper: Do individual returns herd around the market? Financial Analysts Journal, 51(4), 31–37. https://doi.org/10.2469/faj.v51.n4.1918
- Dasgupta, A., Prat, A., & Verardo, M. (2011a). Institutional trade persistence and long‐term equity returns. The Journal of Finance, 66(2), 635–653. https://doi.org/10.1111/j.1540-6261.2010.01644.x
- Dasgupta, A., Prat, A., & Verardo, M. (2011b). The price impact of institutional herding. The Review of Financial Studies, 24(3), 892–925. https://doi.org/10.1093/rfs/hhq137
- Endri, E., Aipama, W., Septiano, R., (2021). Stock price volatility during the COVID-19 pandemic: The GARCH model. Investment Management & Financial Innovations, 18(4), 12. https://doi.org/10.21511/imfi.18(4).2021.02
- Espinosa-Mendez, C., & Arias, J. (2021). COVID-19 effect on herding behaviour in European capital markets. Finance Research Letters, 38, 1–6. https://doi.org/10.1016/j.frl.2020.101787
- Fang, H., Chung, C. P., Lee, Y. H., & Yang, X. H. (2021). The effect of COVID-19 on herding behavior in Eastern European stock markets. Frontiers in Public Health, 9, 31–40. https://doi.org/10.3389/fpubh.2021.695931
- Ferreruela, S., & Mallor, T. (2021). Herding in the bad times: The 2008 and COVID-19 crises. The North American Journal of Economics and Finance, 58, 101531. https://doi.org/10.1016/j.najef.2021.101531
- Gokcan, S. (2000). Forecasting volatility of emerging stock markets: Linear versus non-linear GARCH models. Journal of Forecasting, 19(6), 499–504. https://doi.org/10.1002/1099-131X(200011)19:6<499:AID-FOR745>3.0.CO;2-P
- Hilliard, J., & Zhang, H. R. (2015). Size and price-to-book effects: Evidence from the Chinese stock markets. Pacific-Basin Finance Journal, 32, 40–55. https://doi.org/10.1016/j.pacfin.2015.02.003
- Kallinterakis, V., & Wang, Y. (2019). Do investors herd in cryptocurrencies–and why? Research in International Business and Finance, 50, 240–245. https://doi.org/10.1016/j.ribaf.2019.05.005
- Keynes, J. M. (1936). The general theory of employment, interest and money. Macmillan Cambridge University Press.
- Khanthavit, A. (2020). World and national stock market reactions to COVID-19. ABAC Journal, 40(2), 1–20.
- Lakonishok, J., Shleifer, A., & Vishny, R. W. (1992). The impact of institutional trading on stock prices. Journal of Financial Economics, 32(1), 23–43. https://doi.org/10.1016/0304-405X(92)90023-Q
- Lanne, M., & Saikkonen, P. (2005). Non‐linear GARCH models for highly persistent volatility. The Econometrics Journal, 8(2), 251–276. https://doi.org/10.1111/j.1368-423X.2005.00163.x
- Lee, C. C., Chen, M. P., & Hsieh, K. M. (2013). Industry herding and market states: Evidence from Chinese stock markets. Quantitative Finance, 13(7), 1091–1113. https://doi.org/10.1080/14697688.2012.740571
- Lee, K. Y. M., Jais, M., & Chan, C. W. (2020). Impact of covid-19: Evidence from Malaysian stock market. International Journal of Business and Society, 21(2), 607–628. https://doi.org/10.33736/ijbs.3274.2020
- Li, C., Hu, Z. Y., & Tang, L. W. (2019). Re-examining the Chinese A-share herding behaviour with a Fama-French augmented seven-factor model. Applied Economics, 51(5), 488–508. https://doi.org/10.1080/00036846.2018.1494809
- Li, H. Q., Liu, Y., & Park, S. Y. (2018). Time-varying investor herding in Chinese stock markets. International Review of Finance, 18(4), 717–726. https://doi.org/10.1111/irfi.12158
- Lin, Z. (2018). Modelling and forecasting the stock market volatility of SSE Composite Index using GARCH models. Future Generation Computer Systems, 79, 960–972. https://doi.org/10.1016/j.future.2017.08.033
- Luu, Q. T., & Luong, H. T. T. (2020). Herding behavior in emerging and frontier stock markets during pandemic influenza panics. The Journal of Asian Finance, Economics and Business, 7(9), 147–158. https://doi.org/10.13106/jafeb.2020.vol7.no9.147
- Mahmud, S. F., & Tinic, M. (2018). Herding in Chinese stock markets: A nonparametric approach. Empirical Economics, 55(2), 679–711. https://doi.org/10.1007/s00181-017-1281-y
- Mandaci, P. E., & Cagli, E. C. (2022). Herding intensity and volatility in cryptocurrency markets during the COVID-19. Finance Research Letters, 46, 102382. https://doi.org/10.1016/j.frl.2021.102382
- Merli, M., & Roger, T. (2013). What drives the herding behavior of individual investors? Finance, 34(3), 67–104. https://doi.org/10.3917/fina.343.0067
- Nelson, D. B. (1991). Conditional heteroskedasticity in asset returns: A new approach. Econometrica, 59(2), 347–370. https://doi.org/10.2307/2938260
- Nofsinger, J. R., & Sias, R. W. (1999). Herding and feedback trading by institutional and individual investors. The Journal of Finance, 54(6), 2263–2295. https://doi.org/10.1111/0022-1082.00188
- Nurhayati, I., Endri, E., Aminda, R. S., & Muniroh, L. (2021). Impact of COVID-19 on performance evaluation large market capitalization stocks and open innovation. Journal of Open Innovation, Technology, Market, and Complexity, 7(1), 56. https://doi.org/10.3390/joitmc7010056
- Papadamou, S., Kyriazis, N. A., Tzeremes, P., & Corbet, S. (2021). Herding behaviour and price convergence clubs in cryptocurrencies during bull and bear markets. Journal of Behavioral and Experimental Finance, 30, 100469. https://doi.org/10.1016/j.jbef.2021.100469
- Raafat, R. M., Chater, N., & Frith, C. (2009). Herding in humans. Trends in Cognitive Sciences, 13(10), 420–428. https://doi.org/10.1016/j.tics.2009.08.002
- Sharma, S., Aggarwal, V., & Yadav, M. P. (2021). Comparison of linear and non-linear GARCH models for forecasting volatility of select emerging countries. Journal of Advances in Management Research, 18(4), 526–547. https://doi.org/10.1108/JAMR-07-2020-0152
- Sias, R. W. (2004). Institutional herding. The Review of Financial Studies, 17(1), 165–206. https://doi.org/10.1093/rfs/hhg035
- Vidal-Tomás, D., Ibáñez, A. M., & Farinós, J. E. (2019). Herding in the cryptocurrency market: CSSD and CSAD approaches. Finance Research Letters, 30, 181–186. https://doi.org/10.1016/j.frl.2018.09.008
- Wermers, R. (1999). Mutual fund herding and the impact on stock prices. The Journal of Finance, 54(2), 581–622. https://doi.org/10.1111/0022-1082.00118
- Wu, G. S., Yang, B. X., & Zhao, N. R. (2020). Herding behavior in Chinese stock markets during COVID-19. Emerging Markets Finance and Trade, 56(15), 3578–3587. https://doi.org/10.1080/1540496X.2020.1855138
- Yao, J., Ma, C. C., & He, W. P. (2014). Investor herding behaviour of Chinese stock market. International Review of Economics and Finance, 29, 12–29. https://doi.org/10.1016/j.iref.2013.03.002
- Yasir, M., & Önder, A. (2021). Dynamic herding behaviour in the US stock market. Prague Economic Papers, 30(1), 115–130. https://doi.org/10.18267/j.pep.760
- Zach, T. (2003). Political events and the stock market: Evidence from Israel. International Journal of Business, 8, 244–266. https://doi.org/10.2139/ssrn.420242
- Zhang, R. J., Yang, X. T., Li, N., & Khan, M. A. (2021). Herd behavior in venture capital market: Evidence from China. Mathematics, 9(13), 1509–1526. https://doi.org/10.3390/math9131509
