
 ?Mathematical formulae have been encoded as MathML and are displayed in this HTML version using MathJax in order to improve their display. Uncheck the box to turn MathJax off. This feature requires Javascript. Click on a formula to zoom.
Abstract
Government policy strategies, particularly in sub-Saharan Africa (SSA), are aimed at increasing agricultural productivity, which could contribute to improve household welfare. Hence, understanding smallholder farmers’ low and variable crop yields has been a central research and policy priority in addressing food security. Likewise, the purpose of this study was to assess the impact of adopting improved maize varieties on productivity and food insecurity in Amuru district of Horo Guduru Wollega, Ethiopia. The study utilized cross-sectional household data collected in 2020/2021 from 263 randomly selected sample households. The probit model’s findings indicate that factors that positively influenced households’ adoption of the improved maize varieties included the household head’s education level, the amount of livestock owned, access to credit, access to training, farm size, access to extension agents, and access to information from farmers associations, while factors that negatively influenced adoption included family size and market distance. The endogenous treatment effect model’s findings also showed that IMV adoptions considerably improve smallholder farmers’ welfare by lowering food insecurity and raising their average calorie intake and net crop values. Thus, it is advised that governments and other interested institutions should promote the adoption of improved maize varieties on a larger scale in order to boost maize yield and lower rural household food insecurity.
1. Introduction
Growth in agricultural production is a critical component of the economic success of many African countries. In fact, with rapidly rising populations and often modest development in agricultural productivity, most sub-Saharan African (SSA) countries are facing persistent and protracted food insecurity and poverty, leaving a significant social and economic problem (Manda et al., Citation2018). Hence, government policy efforts aimed at increasing agricultural production and productivity become the main concern for reducing rural poverty and ensuring household food security (Kalinda et al., 2017, Geffersa et al., Citation2021). A growing body of empirical evidence additionally suggests that adoption of technology has a significant impact on enhancing agricultural output and productivity, system resilience, reducing poverty and food insecurity (Ariga et al., Citation2019; Otieno et al., Citation2017; Sultana et al., Citation2021). Ogundari and Bolarinwa (Citation2018) and Takam (Citation2017), however, stated that the associations between agricultural technology adoption and production and welfare measures have been mixed within the context of SSA.
In Ethiopia, agriculture is the backbone of the economy which employs the vast majority of the country’s inhabitants, contributes 32.5% percent of the Nation’s Gross Domestic Product (GDP) and 81.5% of export earnings of the country (National Bank of Ethiopia NBE, Citation2020). Despite Ethiopia’s long history of resilience, the agricultural sector is currently under decline (Yigezu Wendimu & Tejada Moral, Citation2021). The sector’s productivity and output are hampered by a number of constraints. Drought, depletion of natural resources, inadequate technology, a dearth of institutional support, pests, disease, and market development restrictions are a few of the main obstacles to the agricultural sector’s development (Merga and Haji, Citation2019; Yigezu Wendimu & Tejada Moral, Citation2021).
The government of Ethiopia has set ambitious agricultural productivity improvement goals in recent years to help millions of smallholder households with their food security (Dorosh and Rashid, Citation2013). The major focus of the policy was emphasizing on research and extension activities targeted at the major staple crops widely grown by resource poor smallholder farmers (Jaleta et al., Citation2018). The Ethiopian Institute of Agricultural Research (EIAR), in collaboration with the international organizations, has introduced a range of improved varieties to achieve the governments’ objective of enhancing the agricultural sector (MoA, Citation2011). As a result, Ethiopia’s small-scale farming sector has experienced a success story (Abate et al., Citation2015). Specifically, the adoption of IMV has led to a significant increase in coverage, with approximately 54.9% of the national maize field in 2018 (Central Statistical Agency CSA, Citation2018). Moreover, maize productivity has increased from 1.52 t/ha in 1995 to 3.42 t/ha in 2015 (CSA, Citation2015).
Despite impressive improvement in maize production, adoption of IMV in Ethiopia is still very low relative to what it could be (Jaleta et al., Citation2018). Also, there is difference in maize productivity between Ethiopia and the rest of the globe. For instance, the average yield in Ethiopia during the years 2015–2018 (3.6 t/ha) was lower than the world’s average (5.87t/ha) for the same period (WFP, Citation2020). A significant portion of this yield gap could be attributable to farming technology, farmers’ adoption behavior and other socioeconomic factors that impede production and productivity (Danso-Abbeam et al., Citation2017).
Maize is among the primary food crops cultivated in the Amuru district, where farming is characterized by traditional, rain-fed, low-input-low-output production activities. During the 2018–19 cropping season, the average maize yield attained by farmers in the district was 2.47 t/ha. Of the total corn acreage, 58% was planted with local varieties, resulting in a productivity of 1.8 t/ha, which was significantly inferior to the average output of 3.4 t/ha achieved with improved varieties (AWAO, Citation2019). The yield gap mainly linked to the adoption of IMV. Similar to the situation in many households in Ethiopia, the problem of food insecurity is also a major issue in the study district. According to Tegegne (Citation2018), about 42% of households in Amuru district live in absolute food poverty. The average consumption gap necessary to get food insecure households up to the food poverty line was found to be 31.52% of the food poverty line. Given the aforementioned rationale, it is essential to undertake studies to improve the productivity and food security of households in the district.
Adoption of IMVs in Ethiopia has been examined by a few studies. While some studies examined determinants of farmers’ adoption decision, others considered the impact of IMVs adoption on farm production and/or welfare. For instance, Feleke and Zegeye (Citation2006), Abate (Citation2015), Nigatu et al. (Citation2018) and Ketema et al. (Citation2021) examines factors determining farmers’ adoption decision for IMVs in Ethiopia. M. H. Ahmed et al. (Citation2017), Jaleta et al. (Citation2018), Geffersa et al. (Citation2021) assessed the welfare impact of adoption of IMVs on smallholders’ wellbeing, measured as consumption per adult equivalent or food consumption expenditure. Despite the empirical evidences, they did not accounting for the pass way of how IMVs improve food insecurity status through enhancing productivity. They also did not consider calories consumed by a household in measuring food security. Moreover, since, technology adoption is a dynamic process and farmers’ adoption behavior expected to be unpredictable, the determinants of technology adoption and their impact on farmer’s welfare may vary over time and locations (Danso-Abbeam et al., Citation2017; Tesfay, Citation2023). Updating information based on the current technologies being used by the farmers at different locations of the country is necessary.
There has also been limited effort in quantifying the impact of technology adoption on farm household productivity and food security by considering the effects of self-selection bias in Ethiopia. Further, to the best of the authors’ knowledge, no empirical research in western Ethiopia had considered the impact of IMV adoption on farmers’ welfare. This study, therefore, examined the impact of IMVs adoption on productivity which ultimately translated into the food security of households by increasing their net crop value and calorie take using an endogenous treatment effect model. It provides additional insight into the development efforts on the adoption of IMVs to enhance food security status in the food insecure areas, Amaru district, of western Ethiopia.
2. Methodology
2.1. Description of the study area
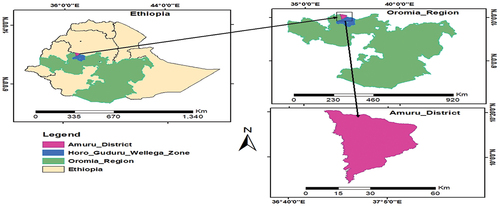
The study area, Amuru district is located North West of Horo-Guduru Wollega Zone, Oromia region, Ethiopia. Capital of the Amuru district, Obora, is located at nearly 392 km to Ambo road, North West of Addis Ababa, the federal capital city of Ethiopia. The district is geographically located between 60 35“N and 70 52” W latitude, and 420 90“E and 480 95” E longitude (Figure ). The district is characterized by three agro-ecological zones classified as semi-arid (kola), the semi-temperate (woinadega), and the temperate tropical highlands (dega) areas. The main rainy season (July to September), which accounts for 90% of the entire harvest, follows the short and erratic rains that take place from February to April. Between 11.10°C and 23.60°C, and 1167 mm to 1737.9 mm, respectively, are the average annual temperatures and rainfall. The main source of income is agriculture, which is dominated by small-scale farmers. Since the agricultural activity in the districts relies on rain feed, it is susceptible to climate change and variability, which affects the households’ food security status. The land used for wheat, teff, and barley, respectively, make up 14,959,10830 and 8759 hectares of the total cultivated land. While field peas, lentils, beans, maize, and chickpeas take up 4850, 4419, 4209, and 3554 hectares, respectively (Tegegne, Citation2018).
Figure 1. Physical map of Ethiopia, Oromia Region and Amuru District.
2.2. Sampling technique and data collection
A multi-stage sampling technique was employed to select the sample households for the study. In the first step, Amuru District was selected purposively due to the potential high production of maize (both improved and local maize varieties) in the area. In the second stage, kebeles in the district were classified into dega, woinadega and kola based on their agro-ecology. Then, one kebele from each agro-ecology zone and total of three kebeles were randomly selected to get representative sample from each agro-ecology zone. Then, working with the district agricultural office, maize producer farmers in 2020 were stratified into two groups: those who adopted improved maize varieties (IMVs) (the treated group) and those who did not (control group). Finally, 134 households from the control group who did not adopt IMVs and 129 households from the treated group who did adopt IMVs were selected using simple random sample technique based on proportionate probability sampling depending on the size of each kebele (Table ).
Table 1. Sample district, Kebeles and number of sample households
2.3. Data types, sources and methods of data collection
The study is based on cross-sectional data collected from 263 sample respondents through individual interviews using structured questionnaires. Furthermore, focus group discussion and a key informant interview were also used to get additional supporting qualitative evidence on current situation of household food insecurity and challenges that farmers have been faced in adoption of improved maize variety. The survey was used to gather data on household socioeconomic, demographic, and institutional traits, which were essential for determining factors that influenced the adoption of IMVs and its impact on maize productivity and food insecurity in the study area.
2.4. Method of data analysis
Descriptive statistics such as means, percentages and standard deviation was used to describe demographic, socio-economic and institutional characteristics among adopters and non-adopters of IMVs, while chi square for discrete variables and t test for continuous variables was applied to test the statistical significance association and difference among adopters and non-adopters, respectively. Endogenous Switching Regression (ESR) was applied to evaluate the impact of adoption of improved maize variety on maize productivity and food insecurity status of farming households while controlling observable and unobservable variables which affect adoption as well as outcome variables. The study analyzed using Stata 13.
2.5. Determining food insecurity status
To determine the food insecurity status of households, the study was used kilocalorie per adult equivalent. Total household kilocalories consumption was obtained by adding kilocalories of all the food items consumed by a household over the last 7 days preceding the survey. Finally, per capita kilocalories intake was obtained by dividing the total household kilocalories consumed by 7 days, and then by family size measured in Adult Equivalent (AE). According to FDRE (Citation2010), 2200 kilocalories per adult per day is the minimum recommended energy intake at the national level and is the threshold used to determine whether a household is food secure or not. Hence, households with per AE food energy below the minimum subsistence requirement were considered as food insecure, whereas those with per AE food energy above or equal to the minimum subsistence requirement were considered as food secure.
2.6. Determining maize productivity level
We measured the productivity of maize using the net crop value analysis technique, following Gedefa (Citation2016), Sileshi et al. (Citation2019), and Dabessa et al. (Citation2021) who assessed the profitability of technology adoption in cereal production (Sesame, Rice, and Maize). Hence, to get the net crop value, the cost of all inputs and expenses required to produce maize are subtracted from the value of maize production per hectare using market prices.
2.7. Empirical model specification
For determining the accurate impact of the improved maize variety on food insecurity and productivity, it is important to take into account both observable and unobservable characteristics of adopters (treatment group) and non-adopters (control group).
Due to endogeneity imposed on by self-selection bias, it may be challenging from an econometric viewpoint to evaluate the impacts of technology adoption. So, farmers may not be randomly allocated to adopt technology due to unobservable circumstances. This is because adoption of technology is either voluntary or targeted at a particular category of farmers. Farmers who adopt new technologies, for instance, could be more productive; in this case, endogenity is caused by self-selectivity in technology adoption (Amare et al., Citation2012). In order to resolve this issue, we employed an Endogenous Switching Regression (ESR).
Endogenous Switching Regression method consists of two stages. A probit model was used in the first stage of the ESR to estimated farmers’ choice of improved varieties. In the second stage, both ordinary least squares and binary probit models with selectivity correction were used to analyze the relationship between the outcome variables (net crop value, calorie consumption, and food insecurity status) and the adoption of IMVs as well as the set of explanatory variables.
The expected utility maximization theory was used for the farmers’ adoption of IMVs. A farmer (i) adopts improved maize varieties if the expected utility from adoption is higher than the comparable value from non-adoption
.
Let be the latent variable capturing the benefit of the
farmer’s adoption of improved maize varieties and given as:
where: Z is vector of household demographic, socio-economic and institutional characteristics, that affect the decision to adopt or non-adopt IMVs and ɛ is an error term.
The adoption decision of an improved maize variety might be endogenous in the outcome equation (calorie intake, net crop value and food insecurity), and analyzing the outcome variable without adjusting for potential endogeneity could lead to biased estimates. As a result, employing an instrumental variables technique to identify the outcome equation from the selection equation is crucial. Hence, the instrumental variable should not change outcome variables like calorie intake, net crop value, or food insecurity, but it affect the adoption of IMVs. We employed sources of information (government extension (yes = 1) and farmers cooperatives (yes = 1)) as a selection instrument. These variables were employed as an instrument by Sileshi et al. (Citation2019), Di Falco et al. (Citation2011), Shiferaw et al. (Citation2014), and Khonje et al. (Citation2015) because they are essential for the adoption of new technology since they allow the dissemination of information but not outcome variables (household food security status, food consumption expenditure and vulnerability). The instrument variables were further validated using a falsification test. The falsification test on the selected instrumental variables reveals that jointly they were statistically significantly influence IMVs adoption decisions (Chi2 = 95.73; P-value = 0.000), but not net crop value (F-value = 0.67; P-value = 0.511 for adopters and F-value = 1.06; P-value = 0.350 for non–adopters), calorie intake (F-value = 0.71; P-value = 0.49 for adopters and F-value = 0.84; P-value = 0.32 for non-adopters) and household food insecurity status (Chi2 = 3.64; P-value = 0.170 for adopters and Chi2 = 4.52; P-value = 0.104 for non-adopters). This implies that variables influence the selection equation (in our case, the adoption of IMVs) but not the outcome variables. Hence, they are true instruments.
As an endogenous switching regime model, the outcome regression equations for both adopters (regime 1) and non-adopters (regime 2) can be written:
Where represents outcome variables (Calorie intake, net crop value and a binary food insecurity, status) of smallholder farmer i for each regime (1 = adopter of IMVs and 0 = non-adopter of IMVs),
is a vector of demographic, socio-economic and institution characteristics of household that affects outcome variables, and
is a vector of parameters to be estimated.
Assume that the error terms,
, and
have a trivariate normal distribution, with mean vector 0 and covariance matrix (Lee et al., Citation1982),
Where in the continuous equations
and
are variances of the error terms.
and
are covariance of
and
and
respectively. Since Y1i and Y2i are not observed simultaneously a covariance of the corresponding error terms is not defined (Maddala, Citation1983). This error terms structure shows that the error terms of the outcome equation and the error terms of the selection equation are correlated, resulting in an expected non-zero value of
and
given
- the error terms of the selection equation (Abdulai and Huffman, Citation2014). The expected values of the truncated error terms
and
are, therefore, given below:
and
The probability density and cumulative distribution function of the standard normal distribution are and
, respectively. The ratio of φ and Φ evaluated at
is referred to as the inverse Mills ratio
and
(selectivity terms). If the estimated covariance
and
are significantly different from 0 the decision to adopt and the outcome variable are correlated. This means endogenous switching and the emergence of a selectivity bias sample (Maddala, 1986; Maddala & Nelson, Citation1975). Where
and
are coefficients of correlation between ui, the selection equation error term, and the outcome equations
and
, error terms. In addition, there were estimates of treatment effects. In real and counterfactual cases, the Average Treatment Effect on Treated and Untreated (ATT and ATU) was estimated using the effects of predicted values of the dependent variable for adopters and non-adopters:
Adopters with adoption of IMV
Non-adopters without-adoption
Adopters had they decided not to adopt IMV
Non-adopters had they decided to adopt IMV
Hence, ATT of adopter is computed as
Likewise, ATU of non-adopters is computed as
3. Results and discussion
3.1. Descriptive statistics of continuous explanatory variables
It is essential to describe the socioeconomic, institutional, and farm characteristics of the sample households by adoption status before moving on to the econometrics result. Table shows descriptive statistics of continues explanatory variables considered in adoption analyses.
Table 2. Descriptive statistics of continues explanatory variables
These observations imply that, the household head had an average age of 38.9 years. Adopters’ average age was higher (40.5 years) than non-adopters (37.2 years). The test statistics showed that there is significant mean difference in average age between adopters and non-adopters at 1% probability level. Concerning education, the average level of education in years of schooling of household head was 5.8 years, which is equivalent to elementary education. The results further showed that the mean year of schooling for the adopters was 7.2 years, while it was 4.5 years for the non-adopters. The t-test indicated that there was significant difference (p < 0.01) between adopters and non-adopters. This implies that adopters had relatively higher education level than the non-adopters.
Moreover, the average size of landholding of the sampled household was 3.9 ha. IMV adopters had on average of 4.72 ha farm land, which is more than non-adopters (3.17 ha) with statistical difference (p < 0.01) between adopters and non-adopters. The average family size in adult equivalent in the surveyed households was 4.8. Adopters’ average household size was smaller (4.6) than non-adopters’ (5.05). The test statistics showed that there is significant mean difference in average family size in adult equivalent between adopters and non-adopters at 1% probability level.
The livestock holding measured by TLU depicts that, IMV adopters on average had 9.24 TLUs, while non-adopters have 6.64 TLUs. The results showed that there is significant difference in average livestock holding between adopters and non-adopters at 1% probability level showing that adopters had large holdings as compared to non-adopters of IMVs.
The study area’s farm households rely mostly on agricultural production, with non-agricultural activities supplementing their income. A closer look at the average off farm income of sampled households (Table ) showed that from off farm activities, farmers in the study area obtain on average ETB 2035.81 per year. In this regard, IMVs adopter generated on average of ETB 1956.97 per year, compared to ETB 2111.71 per year for non-adopters. However, the t-test show that there was no statistical significant difference in the off farm income between adopters and non-adopters.
Regarding the average distance to the market, farmers in the study area have to travel 5.4 km to the nearest market. The average distance from the nearest market for the adopters of IMVs was 4.29 km and for the non-adopters was 6.5 km. The results were significant (p < 0.01), implying that the non-adopters were far from the nearest market as compared to adopters.
3.2. Descriptive statistics of discrete explanatory variables
The result in Table shows that from the total sample households, 88.6% were male headed and only 11.4% were female headed. Meanwhile, about 93.8% and 83.6% of IMV adopters and non-adopters, respectively, were male headed. The chi-square result indicated that there was significant association between adoption and sex of the household head. Focused Group Discussions (FGDs) performed with female headed households were revealed that there is an implicit bias toward targeted group, in which female farmers confirmed the presence of gender-based inequalities among technology users. FGD participants in Agamsa reported that “most extension agents are males, and due to cultural and religious expectations, they do not properly interact with female headed households”. This could also create a barrier for female farmers in accessing and using essential information on IMVs.”
Table 3. Descriptive statistics of discrete explanatory variables
The results also revealed that, about 83.7% (108 out of 129) of IMV adopters and 50.7% (68 out of 134) of non-adopters acquired information from government agents. Therefore, 66.9% (176 out of 263) of households got information from government extension agents and 33.1% (87 out of 263) of households did not. On the other hand, 59.7% (77 out of 129) of the IMV adopters and 11.2% (15 out of 134) of non-adopters obtained information from farmers association. In total, 35% (92 out of 263) of households received information from farmers associations, while 65% (171 out of 263) did not. This figure showed higher proportion of IMV adopters have got information from both sources than that of the non-adopters. The chi-square test also indicated that there was significant (P < 0.01) association between adoption and source of information.
In terms of institutional characteristics, there were also considerable discrepancies between the two groups of households. In the study area, providing credit in the form of cash or in kind to aid rural farming families is uncommon. As a result, few (24.3%) of the respondents (64 out of 263) were got credit from formal institution. The result also revealed that 31.8% of adopters and only 17.2% of non-adopters earned credit in the previous year (2020). The chi-square test indicated that there was significant association between adoption and access to credit.
As far as access to training, only 18.3% (48 out of 263) of the households reported received training about IMVs in previous year (2020), with a significantly higher proportion of adopters, which were 31.8% (41 out of 129) acknowledging receipt of such training than non-adopters 5.2% (7 out of 134). It was statistically significant association between adoption and access to training at 1% probability level.
3.3. Descriptive statistics of outcome variables
The outcome variables, such as calorie intake, net crop value, and binary food insecurity status of both adopters and non-adopters are presented in Tables . According to the findings, the average calorie intakes of the sampled households were 2367.1 kcal per adult equivalent per day. The average daily calorie consumption of farm households in the adopters’ category was 2470.71 kilocalories, compared to 2267.28 kilocalories for non-adopters. This means that on average adopters consumed a larger amount of kilocalories than non-adopters and the difference was statistically significant at 1% probability level.
Table 4. Descriptive statistics of continues outcome variables
Table 5. Food security status among adopters and non-adopters
The net crop value of maize was one of outcome variable. The sampled respondents had generated an average net crop value of ETB 10,620.42 per ha. Similarly, IMV adopters generated an average net crop value of ETB 12,375.35 per ha, compared to ETB 8930.97 per ha for non-adopters. The t-test indicated that net crop value among adopters and non-adopters was significantly different at 1% level.
The other outcome variable is binary food insecurity status. Accordingly, the study used 2200 kcal/AE/day as cut-off point to classify households as food secure or food insecure. As a result, food security was defined as a household’s physical food intake in kcal being greater than or equal to 2200 kcal/AE/day, while food insecurity was considered as a household’s physical food consumption in kcal less than 2200 kcal/AE/day. Adopters and non-adopters’ food security status is presented in Table indicated that 65% (171 out of 263) of the sampled households were food secure, whereas 35 (92 out of 263) were food insecure. Regarding the food insecurity status among adopters and non-adopters of IMVs, study found that 83.7% (108 out of 129) and 47% (63 out of 134) of adopter and non-adopter households, respectively, were food secure.
Table 6. Probit model: adoption decision
3.4. Determinants of improved maize varieties adoption
The first stage ESR, binary probit was used to identify determinants of improved maize variety adoption by smallholder farmers in study area. The Wald test of the model (Wald Chi-squared = 120.25 and P = 0.000) is significant at the 1% level, suggests that the whole model is fit and that all of the explanatory variables were explain farmers’ decision to use IMVs in the study area.
According to the estimation results in Table , nine of the 12 hypothesized factors were associated to the decision to adopt IMVs. Among the variables education level of the household head, total livestock owned, access to credit, access to training, farm size, access to information from extension agent and access to information from farmers cooperatives were significantly increased the probability of adoption. Moreover, two variables (family size and market distance) had a negative association with the likelihood of adopting IMVs.
At a 1% level, education is revealed to have a statistically positive and significant association with adoption of IMVs. The results showed that increasing in years of formal schooling of the household head by 1 year would result in a 1.8% increase in the likelihood of adopting IMVs in maize production. Education is believed to enhance farmer understanding and information absorption of new agricultural technologies. Farmers with more years of education find it easy to collect and analyze data, and they are more equipped to evaluate new agricultural technology than farmers with less education. The findings are in line with study by Danso-Abbeam et al. (Citation2017) conducted in Ghana northern region, which found that farmers with higher levels of education are more likely to adopt IMVs than farmers with lower levels of education.
Family size measured by adult equivalent had a negative and significant associated with the household’s adoption decision at less than 1% probability level. Based on the marginal effect results, there is a 3.5% reduction in the likelihood of adopting IMVs for every additional adult equivalent of family size. The majority of farmers in a country like Ethiopia are resource poor and spend their money on basics need for survival. Farmers with large family sizes make the situation worse. Hence, budget constraints limited farmers’ access to alternative technologies, innovation, and crop choice (Feder et al. Citation1985). A negative correlation between family size and the adoption of new agricultural technology was also found by Challa and Tilahun (Citation2014) and Sanchez-Toledano et al. (Citation2018).
The probability of adopting IMVs was found to be significantly and positively affected by livestock ownership at 5% probability level. The study indicates that as a farmer’s livestock holding increases by a TLU, the probability of adopting IMVs rises by 1.8%. Possession of livestock consequently has the potential to increase the likelihood of adoption by increasing household income and purchasing power. Livestock ownership is seen as a way to diversify income, a source of additional income, and may also be an insurance against risk and uncertainty. This result was consistent with earlier empirical research by Muluken et al. (Citation2021), who highlighted that farm households with more livestock were better off accepting risks related to new practices and technology.
The model results showed that farmers’ adoption of IMVs was significantly (p < 0.05) and positively influenced by their access to credit. When all other factors were held constant, the marginal effect result showed that households with access to credit had a 7.9% higher likelihood of adopting IMVs than households without access to credit. This may be related to the fact that having access to financing helps farmers to purchase IMVs and other necessary agricultural inputs in accordance with recommendations. The outcome supports earlier research by Ullah et al. (Citation2018) and Melese (Citation2018), which revealed that access to credit allows farmers to buy useful agriculture inputs and invest in technology.
At the 1% level of significance, the distance from the nearest market was negative and significant. The marginal effect finding shows that the likelihood of adoption decreases by 4.3% for every additional kilometer that farmers are far from the nearest market. Households that are nearer to the market have greater access to market information and can more easily and cheaply access agricultural inputs and products. According to Feleke and Zegeye (Citation2006), Abate et al. (Citation2015), and Nigatu et al. (Citation2018), agricultural households are more likely to use IMVs when they are close to the market.
At the 1% level of probability, it was discovered that access to training had a significant and positive association with the likelihood of adopting IMVs. According to the marginal effect result, access to training increases the probability of IMVs adoption by 21.1%. This is because training increases the degree of knowledge of the farmers, allowing them to seek out more productive information and be more dedicated to farming. Mahoussi et al. (Citation2021) also found that farmers who had access to training were more likely to adopt improved maize varieties than those who did not.
The adoption of IMVS also increased with farm size (P < 0.01). The marginal effects result reveals that increasing farm size by one hectare increases the probability of adopting IMVs by about 3.9%. Farmers with larger farms may be more likely to adopt new technology because they can afford to set aside a piece of their land for testing it; if the testing is successful, they will likely adopt the technology entirely, as opposed to those with smaller farms. This relationship is also reported by Ketema and Kebede (Citation2017) who found the adoption of IMVs increasing with farm size.
The likelihood of adopting IMVs was positively and significantly influenced by information from extension agents and farmer cooperatives (P < 0.01). The marginal impact value showed that access to information from extension agents and farmers cooperatives increases adoption of IMVs by 14.5% and 16.6%, respectively. Access to information from farmer cooperatives and extension agents was a crucial source of knowledge in the study area and was able to influence decisions to adopt new technologies. The result agrees with studies by Sileshi et al. (Citation2019), who noted that providing information enables farmers to be more aware of the problem of technology adoption and its consequences, as well as keep up with the latest technological solutions.
3.5. Impacts of improved maize variety adoption on productivity and food insecurity
One of the main objectives of the study was to assess the effect of improved maize variety adoption on productivity and food security. This section reports the findings arising from the endogenous treatment effect model. Table presents the expected calorie intake, binary food insecurity and net crop value under actual and counterfactual conditions.
Table 7. Endogenous switching regression model result (average treatment effects)
Adopters’ predicted calorie consumptions are 2470.71 kilocalories per day, and would have been 2241.91 kilocalories per day had they not adopted improved maize varieties. The ATT which equals 228.80 kilocalories is significant at 1% probability level. This implies that if adopters had decided not to adopt, their average calorie intake would have decreased by 228.80 kilocalories. Furthermore, the ATU results show that the actual kilocalories per day consumption of non-adopters was 2267.38, however, if non adopters’ households had decided to adopt IMVs, their calorie intake would have been 2383.87 kilocalories per day. Meaning if non-adopter households would have to adopt IMVs, their calorie intake would have increased by 116.48 kilocalories.
Looking into the binary food insecurity variable, had IMVs adopters not adopted, their probability of being food insecure would have increased by 34.8%. Likewise, had non-adopters adopted IMVs, their probability of being food insecure would have decreased by 30.5%. Therefore, the study demonstrated that adopting IMVs significantly reduced farmers’ food insecurity by increasing their calorie intake. This result was consistent with past empirical studies such as Jaleta et al. (Citation2018) who noted that IMVs adoption has a significant and positive impact on per capita food consumption, as well as a significant increase in the likelihood of a smallholder being in food surplus.
The study also assessed the impact of IMVs adoption on net crop value in addition to food insecurity and calorie intake to see the pass way of how IMVs adoption reduce food insecurity status of farming households and enhance kilocalorie intake. Households who adopted IMVs earned less net crop value per ha (ETB 3485.46) if they decided to non-adopt. This means, for an average farm size is 3.9 ha per household, the ATT of net crop value at household level would decrease by 13,593.3 ETB per year if the decided to non-adopt. Similarly, if non-adopters would have adopted IMVs, then their average net crop value would have significantly increased by 3652.01 per ha of maize net crop ETB.
In general, adoption of IMVs not only increase net crop value but also enhance calorie intake and reduced food insecurity. This study’s finding is in line with the theoretical expectation because the purpose of improved varieties and certified seeds were to boost smallholder productivity as well as reduce food insecurity. The outcomes of this study agreed with the findings of Gebre et al. (Citation2021), Sinyolo (Citation2020), H. Ahmed and Anang (Citation2019), Takam‐fongang et al. (Citation2019), Abdoulaye et al. (Citation2018), Gebre et al. (Citation2021), Manda et al. (Citation2018) who claimed that IMV adoption improved the food security of farming households by increasing maize output and income.
4. Conclusion
This study analyzes the impact of IMVs on food insecurity and productivity using primary data collected in Amuru district, of Horo Guduru Wollega, Ethiopia. The study employs parametric (ESR) methods to reduce the effect of self-selection bias due to both observable and unobservable farm demographic, socio-economic and institutional characteristics.
The results of the first stage ESR (probit model) show that adoption of the improved maize varieties was positively influenced by education level of the household head, total livestock owned, access to credit, access to training, farm size, access to information from extension agent and access to information from farmers association. On the other hand, family size and market distance influenced adoption of IMVs negatively. The results obtained from the second stage ESR models were indicated that adoption of IMVs not only had a significant positive impact on household calorie intake and net crop value, but also decreased food insecurity. In fact, the probability of food insecurity decreases by 34.8% compared to their counterfactuals. Further, calorie intake and net crop value increased by Birr 228.80 and 3485.46 per ha due to IMVs adoption, respectively. It can be concluded that by increasing average calorie consumption, net crop values, and reducing food insecurity, IMVs adoptions greatly contribute to the economic and social development of smallholder farmers.
The study’s findings highlight the importance of governments and development organizations putting more effort into enhancing institutional and human capacity through improved education and ongoing training. Also, the government must actively promote other adoption-related variables that will raise the likelihood of adoption and thereby improve maize productivity, caloric intake, and food security in the study area.
4.1. Limitations of the study and areas for further research
The research is based on cross-sectional data from just one season and one food security indicator (calorie intake). However, households’ calorie intake may vary from season to season, which may affect the outcomes. Therefore, more investigation is needed to generate tangible evidence of the study area’s uses longitudinal and panel data, as well as a number of food security indicators. Additionally, this study focuses on factors that affect adoption of improved maize varieties in the study area. Therefore, more research is required to provide empirical evidence regarding the intensity of adoption of improved maize varieties in the studied region.
Acknowledgments
We would like to express our special thanks to the Africa Economic Research Consortium (AERC), and Haramaya University for funding the study and production of this paper.
Disclosure statement
No potential conflict of interest was reported by the authors.
Additional information
Funding
Notes on contributors

Gemechis Merga
Gemechis Merga is a Lecturer at Mattu University, School of Natural Resource and Agricultural Economics, Department of Agribusiness and Value Chain Management. He holds a M.Sc. in Agricultural and Applied Economics from Haramaya University in collaboration with Pretoria University, as well as a B.Sc. in Agribusiness and Value Chain Management from Haramaya University Ethiopia. He teaches undergraduate courses including business mathematics, micro economics, macro economics, business communications, agricultural marketing and price analysis. His research areas include technology adoption, impact evaluations, productivity and food security.
References
- Abate, T., Shiferaw, B., Menkir, A., Wegary, D., Kebede, Y., Tesfaye, K., Kassie, M., Bogale, G., Tadesse, B., & Keno, T. (2015). Factors that transformed maize productivity in Ethiopia. Food Security, 7(5), 965–17. https://doi.org/10.1007/s12571-015-0488-z
- Abate, T., Shiferaw, B., Menkir, A., Wegary, D., Kebede, Y., Tesfaye, K., & Keno, T. (2015). Factors that transformed maize productivity in Ethiopia. Food Security, 7, 965–981.
- Abdoulaye, T., Wossen, T., & Awotide, B. (2018). Impacts of improved maize varieties in Nigeria: Ex-post assessment of productivity and welfare outcomes. Food Security, 10(2), 369–379. https://doi.org/10.1007/s12571-018-0772-9
- Abdulai, A., & Huffman, W. (2014). The adoption and impact of soil and water conservation technology: An endogenous switching regression application. Land Economics, 90(1), 26–43.
- Ahmed, H., & Anang, B. T. (2019). Impact of improved variety adoption on farm income in Tolon district of Ghana. Agricultural Social Economic Journal, 19(2), 105–115. https://doi.org/10.21776/ub.agrise.2019.019.2.5
- Ahmed, M. H., Geleta, K. M., Tazeze, A., & Andualem, E. (2017). The impact of improved maize varieties on farm productivity and wellbeing: Evidence from the East Hararghe Zone of Ethiopia. Development Studies Research, 4(1), 9–21. https://doi.org/10.1080/21665095.2017.1400393
- Amare, M., Asfaw, S., & Shiferaw, B. (2012). Welfare impacts of maize–pigeonpea intensification in Tanzania. Agricultural Economics, 43(1), 27–43.
- Ariga, J., Mabaya, E., Waithaka, M., & Wanzala-Mlobela, M. (2019). Can improved agricultural technologies spur a green revolution in Africa? A multicountry analysis of seed and fertilizer delivery systems. Agricultural Economics, 50(S1), 63–74. https://doi.org/10.1111/agec.12533
- AWAO. (2019) . Crop production status in 2018/19 Meher Season. Amuru woreda Agricultural office.
- Central Statistical Agency (CSA). (2015). Agricultural sample survey: Time series data for national and regional level. 96.
- Central Statistical Agency (CSA). (2018). Agricultural Sample Survey 2016/17: Report on farm management practices (private peasant holdings, meher season) (Vol. III). Addis Ababa.
- Challa, M., & Tilahun, U. (2014). Determinants and impacts of modern agricultural technology adoption in west Wollega: The case of Gulliso district. Journal of Biology, Agriculture and Healthcare, 4(20), 63–77.
- Dabessa Iticha, M., Jaleta, M., & Mitiku, F. (2021). Determinants and profitability of inorganic fertilizer use in smallholder maize production in Ethiopia. Cogent Food & Agriculture, 7(1), 1911046.
- Danso-Abbeam, G., Bosiako, J. A., Ehiakpor, D. S., & Mabe, F. N. 2017. Adoption of improved maize variety among farm households in the northern region of Ghana. Cogent Economics & Finance, 5: 1416896–426. https://doi.org/10.1080/23322039.2017.1416896endogenous switching. Proceedings of the American Statistical Association, 5: 423–426.
- DiFalco, S., Veronesi, M., & Yesuf, M. (2011). Does adaptation to climate change provide food security? A micro‐perspective from Ethiopia. American Journal of Agricultural Economics, 93(3), 829–846.
- Dorosh, P., & Rashid, S. (Eds.). (2013). Food and agriculture in Ethiopia: Progress and policy challenges. University of Pennsylvania Press.
- FDRE. (2010). Federal Democratic Republic of Ethiopia, Growth and Transformation Plan 20, 10(1515), 11–20.
- Feder, G., Just, R. E., & Zilberman, D. (1985). Adoption of agricultural innovations in developing countries: A survey. Economic Development & Cultural Change, 33(2), 255–298.
- Feleke, S., & Zegeye, T. (2006). Adoption of improved maize varieties in southern Ethiopia: Factors and strategy options. Food Policy, 31(5), 442–457. https://doi.org/10.1016/j.foodpol.2005.12.003
- Gebre, G. G., Isoda, H., Rahut, D. B., Amekawad, Y., & Nomura, H. (2021). Gender differences in the adoption of agricultural technology: The case of improved maize varieties in southern Ethiopia. GeoJournal, 86(2), 843–864. https://doi.org/10.1007/s10708-019-10098-y
- Gebre, G. G., Mawia, H., Makumbi, D., & Rahut, D. B. (2021). The impact of adopting stress‐tolerant maize on maize yield, maize income, and food security in Tanzania. Food and Energy Security, 10(4), 313. https://doi.org/10.1002/fes3.313
- Gedefa, B. (2016). Adoption and cost benefit analysis of sesame technology in drought prone areas of Ethiopia: Implication for sustainable commercialization. International Journal of African and Asian Studies, 23, 11–35.
- Geffersa, A. G., Agbola, F. W., & Mahmood, A. (2021). Improved maize adoption and impacts on farm household welfare: Evidence from rural Ethiopia. The Australian Journal of Agricultural and Resource Economics, 66(4), 860–886. https://doi.org/10.1111/1467-8489.12489
- Jaleta, M., Kassie, M., Marenya, P., Yirga, C., & Erenstein, O. (2018). Impact of improved maize adoption on household food security of maize producing smallholder farmers in Ethiopia. Food Security, 10(1), 81–93. https://doi.org/10.1007/s12571-017-0759-y
- Jaleta, M., Kassie, M., Marenya, P., Yirga, C., & Erenstein, O. (2018). Impact of improved maize adoption on household food security of maize producing smallholder farmers in Ethiopia. Food Security, 10, 81–93.
- Ketema, M., & Kebede, D. (2017). Adoption intensity of inorganic fertilizers in maize production: Empirical evidence from smallholder farmers in Eastern Ethiopia. The Journal of Agricultural Science, 9(5), 124–132. https://doi.org/10.5539/jas.v9n5p124
- Ketema, M., Kibret, K., Hundessa, F., & Bezu, T. (2021). Adoption of improved maize varieties as a sustainable agricultural intensification in Eastern Ethiopia: Implications for food and nutrition security. Turkish Journal of Agriculture - Food Science and Technology, 9(6), 998–1007. https://doi.org/10.24925/turjaf.v9i6.998-1007.3937
- Khonje, M., Mkandawire, P., Manda, J., & Alene, A. (2015). Analysis of adoption and impacts of improved cassava varieties. Proceedings of the 2015 Conference, Milan, Italy. International Association of Agricultural Economists.
- Lee, L. F., Maddala, G. S., & Trost, R. P. 1982. Testing for structural change by d-methods in switching simultaneous equations models.Center for naval analyses. Professional Paper 342.
- Maddala, G. S. (1983). Limited-dependent and qualitative variables in econometrics. 3 Cambridge University Press.
- Maddala, G. S., & Nelson, F. D. (1975). Switching regression models with exogenous and endogenous switching. Proceedings of the American Statistical Association (Vol. 5, pp. 423–426). Washington, DC: Business and Economics Section.
- Mahoussi, F. E., Adegbola, P. Y., Aoudji, A. N., Kouton-Bognon, B., & Biaou, G. (2021). Modeling the adoption and use intensity of improved maize seeds in Benin West-Africa: Double-hurdle approach. African Journal of Food Agriculture Nutrition and Development, 21(4), 17931–17951. https://doi.org/10.18697/ajfand.99.20520
- Manda, J., Gardebroek, C., Kuntashula, E., & Alene, A. D. (2018). Impact of improved maize varieties on food security in Eastern Zambia: A doubly robust analysis. Review of Development Economics, 22(4), 1709–1728. https://doi.org/10.1111/rode.12516
- Melesse, B. (2018). A review on factors affecting adoption of agricultural new technologies in Ethiopia. Journal of Agricultural Science and Food Research, 9(3), 1–4.
- Merga, B., & Haji, J. (2019). Factors impeding effective crop production in Ethiopia. The Journal of Agricultural Science, 11(10), 1–14.
- MoA. (2011). Crop variety register animal and plant health regulatory directorate. ministry of agriculture. Addis Ababa.
- National Bank of Ethiopia (NBE). 2020. Annual report of the national bank of Ethiopia for the year 2018/19. Addis Ababa,
- Nigatu, G., Mare, Y., & Abebe, A. (2018). Determinants of adoption of improved (bh-140) maize variety and management practice, in the case of South Ari, Woreda, South Omo Zone, Snnprs, Ethiopia. International Journal of Research Studies in Biosciences (IJRSB), 6(9), 35–43.
- Ogundari, K., & Bolarinwa, O. D. (2018). Does adoption of agricultural innovations impact farm production and house-hold welfare in sub-Saharan Africa? A meta-analysis. Agricultural and Resource Economics Review, 48(1), 1–28. https://doi.org/10.1017/age.2018.10
- Otieno, G. A., Reynolds, T. W., Karasapan, A., & Noriega, I. L. (2017). Implications of seed policies for on-farm agro-biodiversity in Ethiopia and Uganda. Sustainable Agriculture Research, 6(4), 663–706. https://doi.org/10.5539/sar.v6n4p12
- Sánchez-Toledano, B. I., Kallas, Z., Palmeros Rojas, O., & Gil, J. M. (2018). Determinant factors of the adoption of improved maize seeds in Southern Mexico: A survival analysis approach. Sustainability, 10(10), 3543.
- Shiferaw, B., Kassie, M., Jaleta, M., & Yirga, C. (2014). Adoption of improved wheat varieties and impacts on household food security in Ethiopia. Food Policy, 44, 272–284.
- Sileshi, M., Kadigi, R., Mutabazi, K., & Sieber, S. (2019). Impact of soil and water conservation practices on household vulnerability to food insecurity in eastern Ethiopia: Endogenous switching regression and propensity score matching approach. Food Security, 11, 797–815.
- Sinyolo, S. (2020). Technology adoption and household food security among rural households in South Africa: The role of improved maize varieties. Technology in Society, 60, 101214. https://doi.org/10.1016/j.techsoc.2019.101214
- Sultana, R., Rahman, M. H., Haque, M. R., Sarkar, M. A., & Islam, S. (2021). Determinants of drought tolerant rice variety adoption: Evidence from rural farm household in Northern part of Bangladesh. Path of Science, 7(10), 7001–7010.
- Takam, G. M. (2017). Adoption and impact of improved maize varieties on maize yield in Cameroon: A macro‐impact evaluation. Economics Bulletin, 37(4), 2496–2504.
- Takam‐fongang, G. M., Kamdem, C. B., & Kane, G. Q. (2019). Adoption and impact of improved maize varieties on maize yields: Evidence from central Cameroon. Review of Development Economics, 23(1), 172–188. https://doi.org/10.1111/rode.12561
- Tegegne, B.(2018). Poverty situations in the case of Amuru Woreda, Horro Guduru Wolegga Zone, Oromia Regional State. Journal of Economics and Sustainable Development 9(7) ISSN 2222–2855
- Tesfay, M. G. (2023). Welfare effect of improved wheat adoption in Tigrai, Ethiopia: A panel data evidence. Cogent Food & Agriculture, 9(1), 2184121. https://doi.org/10.1080/23311932.2023.2184121
- Ullah, A., Khan, D., Zheng, S., & Ali, U. (2018). Factors influencing the adoption of improved cultivars: A case of peach farmers in Pakistan. Ciência Rural, 48.
- Wordofa, M. G., Hassen, J. Y., Endris, G. S., Aweke, C. S., Moges, D. K., & Rorisa, D. T. (2021). Adoption of improved agricultural technology and its impact on household income: A propensity score matching estimation in eastern Ethiopia. Agriculture & Food Security, 10, 1–12.
- World Health Organization. (2020) . The state of food security and nutrition in the world 2020: Transforming food systems for affordable healthy diets (Vol. 2020). Food & Agriculture Org.
- Yigezu Wendimu, G., & Tejada Moral, M. (2021). The challenges and prospects of Ethiopian agriculture. Cogent Food & Agriculture, 7(1), 1923619. https://doi.org/10.1080/23311932.2021.1923619
