
 ?Mathematical formulae have been encoded as MathML and are displayed in this HTML version using MathJax in order to improve their display. Uncheck the box to turn MathJax off. This feature requires Javascript. Click on a formula to zoom.
Abstract
We built an early warning model for financial risk using a back propagation neural network. To this end, the financial data of 136 listed Internet financial companies in the People’s Republic of China were selected, spanning from 2010–2019, as the sample for the empirical test. We categorized the financial status of enterprises as either “healthy” or “early warning” by the K-means clustering algorithm. Furthermore, factor analysis was performed to obtain seven common factors for building the early warning model. Overall, we confirmed the model’s excellent comprehensive accuracy and prediction efficiency, with accuracy, precision, recall, and specificity rates of 99.51%, 99.71%, 99.71%, and 98.30%, respectively. Thus, the model obtained by training and simulation using the back propagation neural network algorithm can effectively screen enterprises with hidden financial conditions and will not misclassify enterprises with good financial conditions. Notably, the misjudgment and omission rates are considerably low. The model is highly capable of identifying the financial status of Internet financial companies and has good predictive power.
PUBLIC INTEREST STATEMENT
BP neural network is a kind of multi-layer feedforward neural network trained according to error backward propagation algorithm. Its outstanding advantages are that it has strong nonlinear mapping ability and flexible network structure. Early warning models can warn of financial risks and help improve the risk management framework. The model obtained by using BP neural network algorithm for training and simulation can effectively screen out the enterprises with hidden financial conditions, while avoiding misclassification of enterprises with good financial conditions. The misjudgment rate and missing judgment rates are very low, and the prediction effect of financial crisis is good.
1. Introduction
Internet finance goes beyond simply using the Internet to operate a traditional financial business; it encompasses a new business model and operating structure based on digital technology and Internet thinking. Thus, it represents a new era of financial business.
It has been 20 years since the inception of China’s Internet finance industry. While its benefits and advantages have been obvious through its development, we are now beginning to see the hidden risks rising to the surface as the industry continues to operate and mature. First, Internet finance poses the risk of information asymmetry. The remarkable characteristic of the Internet industry is virtualization. When the financial industry was introduced to the Internet, its virtualization characteristics led to intensified information risk of all business activities. Second, Internet finance presents the risk of capital liquidity. Since its liquidity is far less than that of the traditional financial industry and the investment period is not equal, it is very easy to break the capital chain, and the adverse impact is difficult to predict. Lastly, imperfect laws and policies of the Internet finance industry also pose risks that cannot be ignored. Due to the rapid development of the Internet finance industry, the improvement of corresponding laws and policies also must occur quickly. Therefore, attention should be paid to this risk before the promulgation of relevant laws and policies. Indeed, many Internet financial companies have permanently shut down, owing to poor management, and recent history is replete with peer-to-peer lending crises, illegal deposit absorption, and fraudulent fundraising. In 2020 alone, according to the data from the National Enterprise Credit Information Publicity System, the state forcibly suspended 166 financial enterprises owing to non-compliance in business management.
Two types of Internet financial companies are listed on the Main Board Market of the Shanghai and Shenzhen Stock Exchanges: (i) comprehensive Internet financial companies that started from a peer-to-peer platform and developed over the years; (ii) Internet financial companies formed by traditional-industry companies through more recent industrial transformation. Internet financial enterprises are highly inclusive and absorb extensive social capital. Once operational problems cause the enterprise to fall into financial difficulties, the funds of the average investor are negatively affected, even endangering the smooth operation of the economy in severe cases. Therefore, it is essential to evaluate the financial risk of Internet financial enterprises and establish an early warning model of financial risk (from here on, “early warning model”) that conforms to national conditions.
An early warning model, which is a monitoring, reporting, and alerting system, quantitatively forecasts success levels, probable anomalies, issues, risks, potential bankruptcies, and transaction affairs (Koyuncugil & Ozgulbas, Citation2011). Hence, avoiding or mitigating potential issues could be possible through early warning models. Financial statements such as balance sheets and income tables providing financial information are utilized in early warning models that are, in essence, analysis techniques for identifying current states of financial institutions. Since the 1930s, researchers have produced early warning models based on traditional methods and, in more recent years, machine learning (G. Li & Farouk, Citation2021). The outbreak of the US subprime mortgage crisis in 2007 aroused the interest of policy makers and scholars in the risk warning model. Risk warning models are constructed to warn against financial crisis, thus providing the authorities with sufficient time to implement adequate rescue policies to avoid or at least mitigate the adverse effects of turbulence. Davis and Karim (Citation2008) use the Logit model, the binary tree model, and the checklist approach. The method of expanding macroprudential analysis is proven to be appropriate from multiple perspectives. Candelon et al. (Citation2014) proposed building a dynamic risk warning model. The new model demonstrates good out-of-sample forecasting ability and is suitable for longer forecasting periods, an important advantage from the perspective of policy makers. Some scholars have proposed that it is necessary to build an early warning indicator system for real estate investment, and pointed out that real estate sentiment data, as a leading indicator of housing activity and housing price index, is closely related (Breden, Citation2018). After the subprime Davis and Karim (Citation2008), Jorion (Citation2009), and other scholars deemed it necessary to build a forward-looking risk management framework for financial risk management. The reason for this was that modern risk management methods should be guided by the idea that responsible people in an organization do not simply wait for bad things to happen. Samitas et al. (Citation2020) combined network analysis and machine learning algorithms to construct an accurate prediction of the contagion vulnerability of the stock exchange market during shock events and crises. Basse et al. (Citation2022) validated the US National Association of Home Builders Index using machine learning that differs from traditional financial research methods, providing information that helps financial risk managers develop a forward-looking early warning system for U.S. house prices and complementing the concept of establishing a forward-looking risk management framework.
One of the earliest models is the univariate model, first proposed by Fitzpatrick (Citation1932), a pioneer of research and analysis of early warning of financial risk among enterprises. Later, Beaver (Citation1966) refined the univariate model using financial data from an equal number of well-run and financially distressed US firms over a 10-year period, from 1954 to 1964. Generally, the univariate model only uses one variable to predict the financial status of the enterprise; this method reflects limited financial information of the enterprise and does not consider the interaction among different financial ratios. Hence, its prediction effect is not significant. Some of the most representative studies using the univariate model include Altman’s (Citation1968) famous five-variable Z-score model. Altman et al. (Citation1977) optimally designed the ZETA model. A decade later, Aziz et al. (Citation1988) constructed a cash flow forecasting model. Based on Altman’s original Z-score model, S. Zhou et al. (Citation1996) introduced the concept of cash flow and added flow-related financial indicators to establish an F-score model. Zhang et al. (Citation2001) and S. Yang and Xu (Citation2003) combined the Z-score model with principal component analysis to construct a principal component prediction model and a Y-score model, respectively. The multivariate judgment model incorporates more financial information and has a better prediction effect. However, using the least squares method to estimate the parameters requires making strict assumptions.
Conversely, in the logistic regression model, multiple linear regression does not require many assumptions; it has a wider scope of application across disciplines, making it a popular choice for analysis. The two most common logistic regression models are the logit and probit models. Martin (Citation1977) first introduced the logistic regression model into the early warning analysis of corporate financial risks and found that the prediction accuracy of this model was higher than that of the univariate Z-score model. Zmijewski (Citation1984) empirically confirmed the probit model’s high recognition accuracy for financial crisis, showing that the model could effectively evaluate the financial status of enterprises.
In China, scholars have combined the logistic regression method with other methods for the analysis of early warning across different industries and fields. Generally, logistic regression is paired with principal component analysis or factor analysis (Chen & Guo, Citation2022; Han & Li, Citation2010; Z. Zhou & Li, Citation2019). More recently, scholars have combined traditional logistic regression methods and algorithms (Fang et al., Citation2016; G. Yang et al., Citation2019), which yields a better model discrimination rate than when only using logistic regression.
In the next stage of development, we are seeing the application of machine learning to the research on building early warning models to predict and assess enterprise financial risk. In particular, neural network algorithms stand out for their impressive power. In a novel approach, Odom and Sharda (Citation1990) combined the neural network algorithm with the early warning model. Compared with other types of early warning models, neural network algorithms have obvious advantages in the analysis and prediction of corporate financial status (Blanco Oliver et al., Citation2015; Geng et al., Citation2015). In particular, the back propagation (BP) neural network shows excellent performance in early warning research (Lee et al., Citation2005; S. Wu, Citation2015).
Neural network algorithms are shown to improve model predictions. Tsai (Citation2014) combined multiple clustering methods with classification methods for model building. Further, López Iturriaga and Sanz’s (Citation2015) neural network model combines multilayer perceptrons and self-organizing maps, with a discrimination rate for bankrupt banks reaching up to 96.15%.
Given their results, scholars have continued to innovate early warning models based on neural networks. For example, Hosaka (Citation2019) used a convolutional neural network suitable for applying to images for financial forecasting, wherein grayscale images represented financial ratios. Hosaka used these images to train and test convolutional neural networks and confirmed higher performance in bankruptcy predictions.
In Chinese literature, we find a similar trend of applying neural networks to financial forecasting for enterprises. Liu and He (Citation2004) confirmed the superior discriminant performance of a BP neural network against both logistic regression and the Fisher discriminant method, two traditional early warning models. Several studies confirm satisfactory and good prediction results through the use of BP neural network algorithms in early warning model experiments across industries and fields (G. Yang et al., Citation2022; H. Zhou et al., Citation2010; S. Yang & Huang, Citation2005). We also find a growing preponderance of genetic algorithms and particle swarm algorithms in the use of neural network models to improve and optimize the model (C. Wu et al., Citation2018; Song & Chen, Citation2016).
Over years of development, early warning models have evolved from simple univariate to multivariate models, and from applying traditional regression to artificial intelligence. However, the neural network is a singularly useful construction because it allows powerful nonlinear processing and superior mapping. The BP neural network, particularly, is the most widely used neural network in the literature. Indeed, in research based on practical problems, BP neural networks and algorithms derived thereof have become commonplace in the application of neural network models. After optimizations and upgrades, the utilization rate of BP neural networks and the various algorithms derived from them reached 80% of all neural network models.
There is a vast corpus of literature on early warning models—they have been improved, optimized, and upgraded through myriad techniques by scholars. Despite the maturity of early warning models, there exist few studies that focus on their use in the emerging and rapidly growing Internet finance industry. Most current research in this field is concerned with legal supervision, and rarely do we see the use of experimental methods to analyze an enterprise’s financial status quantitatively and build early warning models for financial risk. We bridge this gap in the literature and hope to make a significant theoretical contribution to improving research on the assessment and prevention of risk in the Internet financial industry.
This study is structured as follows. The algorithm principle of the BP neural network is discussed in Section 1. The early warning indicator, which can comprehensively reflect financial risk constructed from the three dimensions of operating risk, cash flow risk, and financing risk is presented in Section 2. Section 3 uses the annual financial data of Internet finance companies listed on the Chinese stock exchange, spanning a period from 2010–2019. These data will help us construct a BP neural network for experimental modeling, simulation prediction, and ultimately building an early warning model. Based on the above analysis results, Section 4 draws conclusions and presents the research methods that can be further improved in the future to improve current research on the Internet finance industry and financial risk early warning field and influence risk prevention of China’s Internet finance industry.
This study is the work of an independent research institute and does not include any published or written work by any other individual or group, except for what is specifically cited in the article. We outline the novelty of our objective below. Since 2013, dubbed “The First Year of Internet Finance,” the Internet finance industry has undergone ten years of development. Despite these strides, theoretical research on the industry has slowed down, with most scholars narrowing their focus to a qualitative analysis of the causes of risk and regulatory models. Quantitative research on risk assessment remains scarce. In our study, we build a more applicable indicator system aligned with the financial characteristics of the Internet finance industry. To this effect, we employ public financial data disclosed in the annual reports of listed companies for modeling experiments and thus build an optimal model for the Internet finance industry. We hope that our findings will energize interest in assessing and analyzing quantitative risks in this emerging industry. Thus, our perspective is innovative.
Most studies on early warning models focus on standards—such as to define whether an enterprise in crisis is a Special Treatment (ST) enterprise, an enterprise with an ST mark is identified as having problems with its financial status, or that the remaining enterprises are identified as having a good financial status. However, there are few listed companies in Internet finance, making it impossible to define accurately whether a company is in financial distress only by an ST mark. To overcome this challenge, we use K-means clustering to perform unsupervised training division on the financial status reflected in the sample data. We accomplish this by relying on the characteristics of the data, identifying the data’s internal logic, and classifying the data according to the size of the similarity. This method is more scientific and reasonable. Subsequently, we statistically analyze these data by combining the K-means clustering and factor analysis with the machine learning method of the BP neural network to build a more reasonable model. Thus, our method is innovative.
2. Principle of the BP neural network: standard data envelope analysis
Rumelhart et al. (Citation1986) pointed out that the BP neural network structure comprises three parts: input, hidden, and output layers. The algorithm process can be roughly summarized into two steps. The first step is the forward propagation of the signal—the sample signal is transmitted unidirectionally along the forward sequence of the network structure, enters the network from the input layer, and ends the training from the output layer after processing in the middle, hidden layer. This process is irreversible; neurons located at the rear cannot conduct backward to those located at the front. The second step is the BP of errors, where the error signal is passed unidirectionally along the reverse order of the network structure when the result from the output layer differs from the expected result after the previous stage of forward propagation training. In this process, the error information enters the network from the output layer, and the weights of the previous layer are corrected, in turn, in the middle, hidden layer. After repeated experiments, the optimal weights between each neuron are found. Figure shows the BP neural network structure in a schematic form.
Figure 1. Schematic diagram of the structure of BP neural network.
Assume that the number of nodes in the input layer is , the number of nodes in the hidden layer is l, and the number of nodes in the output layer is
. The weight of the input layer to the hidden layer is
, and that of the hidden layer to the output layer is
. The offset from the input layer to the hidden layer is
, and that from the hidden layer to the output layer is
. Furthermore, the learning rate is
, and the activation function is
. The activation function uses the Sigmoid function, which is expressed as
. For a single hidden layer BP neural network, the output of the hidden layer is
The output of the output layer is:
The expected output is . Subsequently, the error function is:
Let be
. Subsequently, the error function is:
The ultimate goal of the BP neural network is to minimize the error between the output result and the expected result to achieve the network’s optimal performance. The gradient descent method is used to minimize , obtain the partial derivative, and calculate the weight adjustment formula from the hidden layer to the output layer:
The weight correction formula from the input layer to the hidden layer is:
The bias correction formula from the hidden layer to the output layer is:
The bias correction formula from the input layer to the hidden layer is:
When the error is smaller than the pre-designed value before the experiment, or the number of iterations has reached the pre-designed maximum value, the iteration ends, the training is stopped, and the final weights and biases are output.
3. Construction of financial risk early warning indicator system
3.1 Selecting the indicators
Internet finance companies generally have three financial characteristics. First, they have an asset-light structure—on the balance sheet, light assets with strong liquidity and less capital dominate fixed assets, construction in progress, and other heavy assets in terms of their proportion. Second, their liquidity risk is high. Most Internet finance companies are not large in scale and have insufficient funds. Once the financial conditions of the external market weaken, companies tend to face a liquidity risk. Therefore, the Internet finance industry has higher requirements for cash flow management and liquidity risk control compared with traditional industries. Third, Internet finance companies have high and low costs—the cost on income statement accounts for a small proportion, whereas the R&D and sales expenses account for a larger proportion. Following research by H. Zhou et al. (Citation2010) and S. Wu (Citation2015), we construct an early warning indicator system for financial risk of Internet financial enterprises based on the three causes of financial risks. These are explained in the subsections below.
3.1.1 Operational risk
Operational risk is mainly caused by a failure in business operations or an inability to meet external market demands. We select indicators of operational and innovation capability to reflect the operational risks of Internet financial enterprises. Enterprises with strong operational capabilities can deploy assets more efficiently to generate higher benefits and avoid operational failures. Enterprises with strong innovation capabilities can more keenly perceive changes in the demand side, update technology promptly, adjust products, and reduce a mismatch between supply and demand.
3.1.2 Cash flow risk
Cash flow risk is mainly caused by a mismatch between corporate cash inflows and outflows. We choose the cash capacity index and profitability index to reflect the cash flow risk of Internet financial enterprises. Good cash capacity ensures that the company has normal and stable cash operation. The cash inflow generated by the daily operation of an enterprise is the most basic cash inflow. Thus, strong profitability ensures continuous and stable cash inflow while avoiding the risk of a cash flow breakage.
3.1.3 Financing risk
Financing risk is mainly caused by the inability to repay debts of borrowed funds through the income generated from the enterprise’s business activities. We select the solvency, profitability, growth ability, value creation ability, and equity structure indices to reflect the financing risk of Internet financial enterprises. Logically, good profitability, reasonable equity structure, stable growth, and value creation ability can help companies obtain high-quality, stable investments. Moreover, strong solvency can reduce the risk of a company being unable to repay its liabilities.
3.2 Principles of selecting the indicators
Referring to the research results of X. Li et al. (Citation2023), considering that the risks of Internet financial enterprises are affected by many complex factors, this study selects appropriate indicators from the following three perspectives. The first principle of selecting an indicator is applicability. The Internet finance industry is characteristically different from the corporate industry. It operates with few fixed assets but has a high investment in R&D expenditures. When choosing financial indicators, we should always pay attention to indicators that can reflect the industry’s characteristics.
The second principle is data availability. Internet financial enterprises are still new, and there are only a few listed companies. Thus, indicators with complete data should be preferred during selection. As the model constructed using the selected indicators should benefit the enterprise’s management, investors, and government regulators in decision-making, it should reflect practical operability. Thus, it is recommended to choose as many indicators as possible through public financial statements. Such financial indicators are readily available in reports.
The third principle constitutes comprehensiveness and diversity. Digital technology is in perpetual evolution and innovation. Internet financial services have thus long broken the shackles of traditional financial services and are on a path of diversified development. When constructing the indicator system, we strive to include indicators of more dimensions to reflect this industry characteristic. The selected dimensions and indicators offer an independent perspective of analysis for examining the financial status of Internet financial enterprises. Thus, the system we formulate can reflect the real financial status of the enterprise in the most accurate way possible.
3.3 Indicator system
Based on the above analysis, we select 17 indicators from 8 dimensions of the enterprise—solvency, profitability, operational capability, growth ability, cash capacity, value creation capability, creativity, and shareholding structure—to construct the indicator system (Table ).
Table 1. Indicator system
4. Results
4.1 Data selection and data sources
Currently, 143 Internet finance companies are listed on the Shanghai and Shenzhen Main Board Market. We selected the 2010–2019 financial data of these companies; all data are from annual financial statements publicly disclosed by the enterprises. After removing companies with a lack of data in the early stages and those established late, 136 Internet finance listed companies were selected after screening to ensure data integrity. Taking the financial data of the same enterprise in different years as an independent sample, experimental data are recorded in 1,360 groups.
4.2 Data preprocessing
The 17 financial indicators in the indicator system of Internet financial enterprises have different aspects. Owing to the different nature of each indicator, the dimension and order of magnitude of the indicators are often extremely different. Before using the sample data for training simulation, to effectively avoid the effect of the original data dimension or order of magnitude difference on subsequent training, preprocessing the data and unifying different types of data is necessary. This is done for two purposes.
First, when the numerical levels of each index are considerably different, the index with higher numerical value will play a prominent role in subsequent experiments if the initial index value is directly used for the experiment; this would, in turn, reduce the index band with a lower numerical value. Normalization can improve the accuracy of the model and reduce the effect of singular samples on the training network.
Second, if the gap among the input samples is considerably large, both gradient calculation and updating the step size during network training would become difficult, in turn, hindering the network from finding a suitable learning rate to balance singular samples. The normalized data improves the overall convergence speed of the model, which then shortens the training time and effectively improves the early warning efficiency of the model. There are many methods of data normalization, and we use the most common Z-score normalization method.
4.3 Definition and division of financial distress: K-means clustering
In the literature, bankruptcy is often used as the basis for defining the success of business operations (see Altman et al., Citation1977; Altman, Citation1968; Aziz et al., Citation1988; Geng et al., Citation2015; Hosaka, Citation2019; Philippe, Citation2021). However, given China’s national conditions, Chinese scholars generally use ST as the distinguishing standard in their research (G. Yang et al., Citation2019; Guan & Wang, Citation2016; Han & Li, Citation2010; S. Yang & Xu, Citation2003; Zhang et al., Citation2001). Businesses with the ST mark are considered to be in financial trouble, while the remaining businesses are considered financially sound. Nevertheless, given the nascent rise of China’s Internet finance industry and the small number of listed companies, the data are insufficient to support the needs of experimental training. Whether an enterprise is in financial distress cannot be decided by only the ST mark. Thus, we use K-means clustering to classify whether an enterprise is in financial distress.
K-means clustering is an unsupervised learning technique that can analyze the characteristics of the data and then classify the samples according to their inherent internal structure and similarity. Compared with the subjective division that occurs with the ST standard, K-means clustering applied to a clustering algorithm is more objective and scientific for defining the financial status of an enterprise.
Repeated K-means clustering and significant analysis of the clustering results reveal that it is most appropriate to divide the sample data into four categories. The corresponding p-values of 15 of the 17 financial indicators are lower than 0.05, rejecting the null hypothesis at the 5% significance level. Thus, when divided into four categories, the difference among different categories is provably significant, and the hierarchy is clear. For the above four categories, after 17 iterations, the financial indicators of the final cluster centers are obtained as shown in Table . We calculate the average of the 17 financial indicators of the four cluster centers above to obtain the following values: 2.9582, 0.4169, 2.2440, and −0.0706. Among them, the performance of the financial indicators of the fourth type of samples is the worst, and 125 of the 130 sample data marked as ST are classified into the fourth type. In other words, the overall financial situation of the fourth type is poor, and enterprises in this group are vulnerable to financial difficulties. The samples in the fourth category are classified as needing a financial risk warning and are marked with 1 for the convenience of later network training. The performance of the financial indicators of the first, second, and third categories of samples is basically good, and the samples of these three categories are classified as “healthy” and marked 0.
Table 2. List of financial indicators of cluster centers
4.4 Factor analysis of the samples
To reflect the financial situation of the enterprise comprehensively and systematically, a total of 17 financial indicators are selected in the indicator system above, which represent some information about the financial status of the enterprise from different perspectives. However, these indicators are not completely independent. Some of the financial information they contain will be repeated. The larger the number of input variables, the higher the complexity of network training, thus reducing the training speed and model training efficiency. The larger number of input variables may even influence the final training effect because of collinearity.
Factor analysis is a process of simplifying the original data used by the model by means of dimensionality reduction. Using factor analysis, many variables with repeated information can be converted into a few independent common factors. This reduces the number of variables and the computational difficulty of subsequent experiments and retains the information of the original indicator system to the greatest extent. Before performing factor analysis, Kaiser—Meyer–Olkin (KMO) and Bartlett’s sphericity tests are performed to determine whether the data meet the conditions of factor analysis. The formula for the KMO test is as follows:
The closer the KMO value is to 1, the stronger the correlation of variables, and there should be common factors in the original data. A KMO value of 0.645 is obtained after testing the normalized data. Bartlett’s spherical test determines whether each variable is independent. The null hypothesis is that the correlation coefficient matrix is a unit matrix. Most likely, the common factors cannot be extracted from the original data. At this time, it is meaningless to use factor analysis. After testing the normalized data, the null hypothesis is significantly rejected at the 1% level. By comprehensively analyzing the two tests, the sample data are confirmed to be suitable for factor analysis.
The variance of the common factor reflects the degree of reflection of the common factor on the information contained in each variable. The higher the value, the more original information is contained in the common factor. The variances of the common factors of the 17 indicators are basically large, proving that the information contained in the extracted common factors covers most of the information of the original variables. Hence, the extraction process is effective. Next, the quadrature factor after rotation is obtained by the maximum variance method, as shown in Table . The purpose of factor rotation is to reveal the most representative financial information contained in each common factor to facilitate the subsequent definition of the common factor.
Table 3. Rotation component matrix
The seven extracted common factors can be explained through Table . The current ratio, quick ratio, asset-liability ratio, and R&D investment ratio in the first public factor account for a relatively high proportion, indicating a comprehensive factor of debt service and innovation. The proportion of revenue is relatively high, indicating the profit factor. The total asset turnover and current asset turnover ratios in the third public factor are relatively high, indicating the asset operation factor. In the fourth common factor, the sales margin and net present rate of sales account for a relatively high proportion, indicating the sales factor. In the fifth common factor, the year-on-year growth rate of total assets and operating income account for a relatively high proportion, indicating the growth factor. In the sixth common factor, the accounts receivable turnover rate and the first major shareholders have a relatively high shareholding ratio, indicating a comprehensive factor of operation and equity structure. The seventh public factor has a relatively high proportion of return on invested capital, indicating a value-creating factor. These seven common factors will be used as input variables for subsequent network training.
4.5 Experimental analysis
4.5.1 Experimental parameter design
There are seven neurons in the input layer of the BP neural network, indicating the seven common factors in the index system of Internet finance. There are two neuron nodes in the output layer—the financial status of two types of enterprises divided by K-means clustering. Following the literature and experiments applying the BP neural network to the early warning of financial risk, we set the number of hidden layers to 1. Following the extreme learning machine algorithm, we set the hidden layer neurons to 10.
4.5.2 Training simulation experiment process
After determining the experimental parameters and network structure, we use MATLAB (R2018b) to train the BP neural network. Consistent with the training of the extreme learning machine algorithm and the radial basis function kernel support vector machine algorithm, 70% of the data (952 groups in total) are randomly selected as the training data set. Subsequently, 15% of the data (204 groups in total) are selected as the validation data set to adjust the hyperparameters in the network to maximize the model generalization ability. The remaining 15% of the data (204 groups in total) are used as the test data set.
In terms of transfer function, the tansig function is selected from the input layer to the hidden layer, and the purelin function is chosen from the hidden layer to the output layer. In terms of training functions, we choose the Levenberg—Marquardt (LM) algorithm, which requires less computation and has faster convergence speed. The LM algorithm is the preferred choice for training medium-scale network models. The maximum time of iterations is set to 1,000. The training error indicator selects the mean square error. The model goes through 39 iterations with a final error of 0.00141.
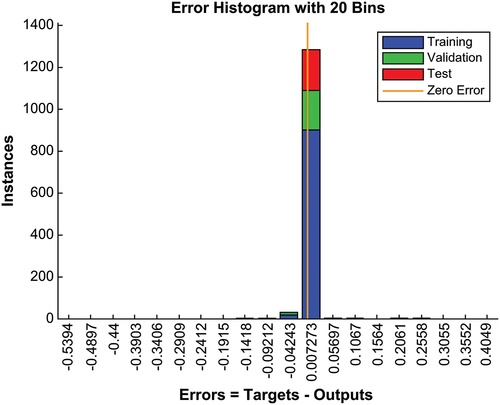
Figure shows the mean square error as a function of training epochs. The mean square error clearly shows a continuous downward trend with the continuous iteration of the BP neural network, and the training ends after 33 iterations. After training, it has a certain level of predictive ability. Figure shows the regression goodness of fit of the training, validation, test, and total sample sets. The four R values are all close to 1, confirming good network fitting effect constructed by the experiment. Figure is the error histogram. Evidently, the errors of the three sample data are mainly concentrated in 0.007, and a small part is concentrated in −0.004. The values are extremely small, and the line with zero error is located in the area with the densest data distribution. The result further proves that the experimentally constructed network has excellent fitting effect and strong generalizability.
Figure 2. Mean square error change diagram.
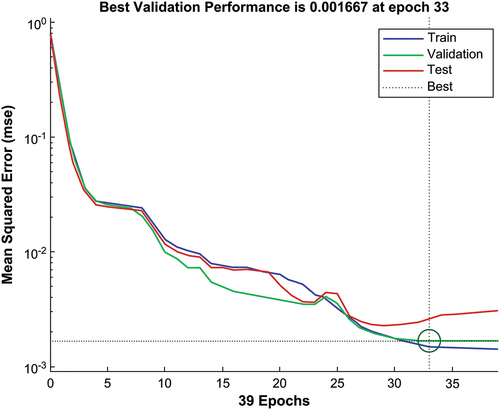
Figure 3. Goodness of fit plot.
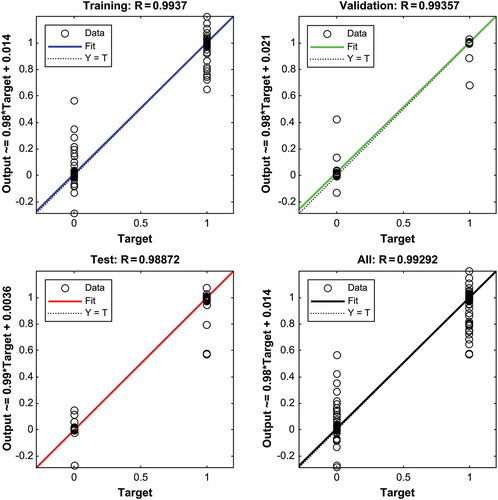
Figure 4. Error histogram.
According to the prediction threshold, the output results obtained by BP neural network training are classified to obtain a confusion matrix (Table ). The confusion matrix reveals that, among the 204 randomly selected groups of samples, the total number of well-managed samples is 27, and that of samples with financial crisis is 177. The experimentally constructed BP neural network can thus make correct predictions. To avoid the result being caused by the random selection of samples, repeated experiments are also conducted, and the average of the results of the experiments is taken to obtain the comprehensive performance of the network: the accuracy, precision, recall, and specificity rates are 99.51%, 99.71%, 99.71%, and 98.30%, respectively. These values confirm that the model obtained by training and simulation using the BP neural network can effectively screen enterprises with a hidden financial situation and will not misclassify enterprises with a good financial situation. Moreover, the model’s missed judgment rates are considerably low, the ability to predict the financial status of Internet financial companies correctly and the accuracy of predicting the occurrence of financial crises are high, and the overall comprehensive accuracy and forecasting efficiency are excellent.
Table 4. Confusion matrix of prediction results of BP neural network
These four indicators prove that our model has high accuracy, low omission and misjudgment rates, strong network generalizability, and a successful construction. Thus, it is feasible and effective to choose the BP neural network to construct a model for Internet financial listed companies. In particular, our early warning model can be used to evaluate the financial situation of enterprises in reality, indicating that our experiment has theoretical and practical significance.
5. Further discussion
5.1 Main conclusions
Based on the financial characteristics and risk causes of the Internet financial industry, we established an indicator system suitable for Internet financial enterprises. K-means clustering was used to divide the financial status of enterprises, and seven common factors were extracted from the index system by factor analysis. Finally, the BP neural network was applied to build the early warning model of financial risk for Internet financial enterprises. The results are summarized below.
First, it is considerably scientific to use K-means clustering to define financial status. In this study, K-means clustering was used to classify the financial status of Internet financial enterprises. The clustering results show that 125 of the 130 sample data marked as ST in the past ten years are classified as having financial difficulty; the differences between different categories are significant, and the layers are clear. Compared with the subjective classification based on the ST standard, the use of a clustering algorithm to define the financial status of enterprises is objective, scientific, and reasonable, and overcomes the problem that the number of listed Internet finance enterprises and enterprises labeled as ST in this industry is extremely small, meeting the needs of the experiment.
Second, the comprehensive performance of the BP neural network is excellent. The BP neural network is suitable for application when internal structures are complex. A neural network with a single hidden layer can fit any continuous mapping function from one finite space to another. The Internet finance industry is an emerging industry with a relatively short development time. The industry order and mechanism are still gradually improving, the information is not sufficiently comprehensive, and the industry complexity is high. We used the BP neural network to construct a new model, whose accuracy, precision, recall, and specificity rates are 99.51%, 99.71%, 99.71%, and 98.30%, respectively. It can effectively screen out companies with hidden financial conditions without misclassifying companies with good financial conditions. The misjudgment rate and the omission rate are considerably low, and the overall comprehensive accuracy and forecasting efficiency of the model are excellent. Thus, the model can accurately identify the financial status of Internet financial companies and can easily predict financial crises.
5.2 Scope for future research
In this section, we will outline the scope for future research. First, the selection of early warning indicators of financial risk should be more comprehensive. There are many indicators for evaluating the financial status of enterprises. We only selected financial indicators that can be quantitatively calculated and a few non-financial indicators. In the future, we will consider adding quantitative or qualitative indicators in terms of the macro environment, national policies, external markets, and audit opinions. The diversification of indicators can better reflect the information inside and outside the enterprise while reducing the collinearity between indicators.
Second, we must refine the division of corporate financial status. We used the K-means clustering method to perform unsupervised learning on the data, with financial status categorized as “healthy” or in “crisis.” We recommend more categories of financial status, such as “healthy,” “general,” and “early warning” or alternatively “no alert,” “light alert,” “medium alert,” and “severe alert.” Richer and more diverse classifications will allow us to determine an enterprise’s financial status more accurately and, ultimately, help in the prudent operation of enterprises.
Finally, we must expand research on increasing early warning timeliness. Our comparative analysis of three different algorithm constructions showed that the simulation prediction effect of the BP neural network model is better. However, the early warning time is not clearly defined. We shall consider increasing the use of data modeling one year, two years, and three years before the sample year to predict the enterprise’s financial status in the sample year and subsequently test the early warning time of the model to enhance the practical applicability of the model.
Geolocation information
Business School, Beijing Language and Culture University, Beijing, China
Disclosure statement
No potential conflict of interest was reported by the authors.
Data availability statement
The data that support the findings of this study are available in Shanghai Stock Exchange at http://www.sse.com.cn/, and in Shenzhen Stock Exchange at http://www.szse.cn/index/index.html
Additional information
Funding
Notes on contributors
Xiaoling Song
Xiaoling Song is the President of Business school at Beijing Language and Culture University. Her research areas are international finance and digital financial inclusion. She has published 3 books and over 50 academic papers in domestic and foreign journals, such as World Economy Studies, Macroeconomics, Finance & Economics, etc. She has won more than 10 awards, such as the second prize of the provincial Social Science Outstanding Achievement Award and the first prize of the provincial Department of Education Social Science Outstanding Achievement Award. She has presided over the National Social Science Fund Project, the China Banking Association’s entrusted project, and the World Bank’s entrusted sub-project, the Provincial Department of Education. She has participated in over 10 key projects, including the National Natural Science Foundation of China’s projects and decision-making projects of the Henan Provincial Government.
References
- Altman, E. I. (1968). Financial ratios, discriminant analysis and the prediction of corporate bankruptcy. The Journal of Finance, 23(4), 589–17. https://doi.org/10.1111/j.1540-6261.1968.tb00843.x
- Altman, E. I., Haldeman, R. G., & Narayanan, P. (1977). ZETATM analysis – a new model to identify bankruptcy risk of corporations. Journal of Banking and Finance, 1(1), 29–54. https://doi.org/10.1016/0378-4266(77)90017-6
- Aziz, A., Emanuel, D. C., & Lawson, G. H. (1988). Bankruptcy prediction – an investigation of cash flow based models. Journal of Management Studies, 25(5), 419–437. https://doi.org/10.1111/j.1467-6486.1988.tb00708.x
- Basse, T., Kunze, F., Rodriguez Gonzalez, M. R., & Saft, D. (2022). Leading indicators for US house prices: New evidence and implications for EU financial risk managers. European Financial Management, 28(3), 722–743. https://doi.org/10.1111/eufm.12325
- Beaver, W. H. (1966). Financial ratios as predictors of failure, empirical research in accounting: Selected studies. Journal of Accounting Research, 4, 179–199. https://doi.org/10.2307/2490171
- Blanco Oliver, A. J., Irimia Diéguez, A. I., Oliver Alfonso, M. D., & Wilson, N. (2015). Improving bankruptcy prediction in micro-entities by using nonlinear effects and non-financial variables. Czech Journal of Economics and Finance, 2(65), 144–166.
- Breden, D. (2018). Monitoring the operational risk environment effectively. Journal of Risk Management in Financial Institutions, 1(2), 156–164.
- Candelon, B., Dumitrescu, E. I., & Hurlin, C. (2014). Currency crisis early warning systems: Why they should be dynamic. International Journal of Forecasting, 30(4), 1016–1029. https://doi.org/10.1016/j.ijforecast.2014.03.015
- Chen, X., & Guo, H. (2022). Study on financial crisis warning of agricultural listed companies based on factor analysis and logistic regression model. Journal of Applied Statistics and Management, 41(01), 11–24. https://doi.org/10.13860/j.cnki.sltj.20201219-018
- Davis, E. P., & Karim, D. (2008). Could early warning systems have helped to predict the sub-prime crisis? National Institute Economic Review, 206, 35–47. https://doi.org/10.1177/0027950108099841
- Fang, K., Fan, X., & Ma, S. (2016). Forecasting of enterprise’s credit risk based on network-logistic model. Statistical Research, 33(04), 50–55. https://doi.org/10.19343/j.cnki.11-1302/c.2016.04.007
- Fitzpatrick, P. J. (1932). A comparison of ratios of successful industrial enterprises with those of failed firms. Certified Public Accountant, 3, 656–662.
- Geng, R., Bose, I., & Chen, X. (2015). Prediction of financial distress: An empirical study of listed Chinese companies using data mining. European Journal of Operational Research, 241(1), 236–247. https://doi.org/10.1016/j.ejor.2014.08.016
- Guan, X., & Wang, Z. (2016). Comparison of financial early warning models based on logistic regression and BP neural network. Statistics & Decision, 17, 179–181. https://doi.org/10.13546/j.cnki.tjyjc.2016.17.049
- Han, L., & Li, L. (2010). On the model of financial crisis discrimination for the small and medium sized listed companies. The Journal of Quantitative & Technical Economics, 27(08), 102–115. https://doi.org/10.13653/j.cnki.jqte.2010.08.008
- Hosaka, T. (2019). Bankruptcy prediction using imaged financial ratios and convolutional neural networks. Expert Systems with Applications, 117, 287–299. https://doi.org/10.1016/j.eswa.2018.09.039
- Jorion, P. (2009). Risk management lessons from the credit crisis. European Financial Management, 15(5), 923–933. https://doi.org/10.1111/j.1468-036X.2009.00507.x
- Koyuncugil, A. S., & Ozgulbas, N. (2011). Social aid fraud detection system and poverty map model suggestion based on data mining for social risk mitigation. In K. P. Mehdi (Ed.), Surveillance technologies and early warning systems: Data mining applications for risk detection (pp. 173–193). IGI Global.
- Lee, K., Booth, D., & Alam, P. (2005). A comparison of supervised and unsupervised neural networks in predicting bankruptcy of Korean firms. Expert Systems with Applications, 29(1), 1–16. https://doi.org/10.1016/j.eswa.2005.01.004
- Li, G., & Farouk, A. (2021). Financial early warning system model combining hybrid semantic hierarchy with group method of data handling neural network for detection of banks’ risks. Discrete Dynamics in Nature & Society, 2021, 1–11. https://doi.org/10.1155/2021/8607667
- Liu, H., & He, G. (2004). Research on early warning of listed companies’ operation failure based on artificial god network method. Accounting Research, 25(2), 42–46.
- Li, X., Wang, J., & Yang, C. (2023). Risk prediction in financial management of listed companies based on optimized BP neural network under digital economy. Neural Computing & Applications, 35(3), 2045–2058. https://doi.org/10.1007/s00521-022-07377-0
- López Iturriaga, F. J. L., & Sanz, I. P. (2015). Bankruptcy visualization and prediction using neural networks: A study of U.S. commercial banks. Expert Systems with Applications, 42(6), 2857–2869. https://doi.org/10.1016/j.eswa.2014.11.025
- Martin, D. (1977). Early warning of bank failure. Journal of Banking and Finance, 1(3), 249–276. https://doi.org/10.1016/0378-4266(77)90022-X
- Odom, M. D., & Sharda, R. (1990). A neural network model for bankruptcy prediction. Proceedings of the International Joint Conference on Neural Networks, 2, 163–168. https://doi.org/10.1109/IJCNN.1990.137710
- Philippe, D. J. (2021). Forecasting Bankruptcy using Biclustering and neural network-based ensembles. Annals of Operations Research, 299(1–2), 531–566. https://doi.org/10.1007/s10479-019-03283-2
- Rumelhart, D. E., Hinton, G. E., & Williams, R. J. (1986). Learning representations by back-propagating errors. Nature, 323(6088), 533–536. https://doi.org/10.1038/323533a0
- Samitas, A., Kampouris, E., & Kenourgios, D. (2020). Machine learning as an early warning system to predict financial crisis. International Review of Financial Analysis, 71. https://doi.org/10.1016/j.irfa.2020.101507
- Song, X., & Chen, N. (2016). Financial prediction system based on combination of genetic algorithm with BP neural network. Journal of Shanghai Jiaotong University, 50(02), 313–316. http://xuebao.sjtu.edu.cn/EN/
- Tsai, C. F. (2014). Combining cluster analysis with classifier ensembles to predict financial distress. Information Fusion, 16, 46–58. https://doi.org/10.1016/j.inffus.2011.12.001
- Wu, S. (2015). A novel company financial risk warning method based on BP neural network. Proceedings of the 7th International Conference on Intelligent Computation Technology and Automation, Changsha, China (pp. 32–35).
- Wu, C., Liu, J., & Guo, Z. (2018). Use of hybrid fuzzy c-means and probabilistic neural network based on improved particle swarm optimization in the prediction of financial distress. Operations Research and Management Science, 27(02), 106–114. http://www.jorms.net/EN/10.12005/orms.2018.0041
- Yang, G., Du, F., & Jia, X. (2022). Financial early warning model of BP neural network based on the first and the last quality factors. Statistics & Decision, 38(03), 166–171. https://doi.org/10.13546/j.cnki.tjyjc.2022.03.031
- Yang, S., & Huang, L. (2005). Financial crisis warning model based on BP neural network. Systems Engineering: Theory and Practice, 25(01), 12–18 + 26. https://kns.cnki.net/kcms/detail/detail.aspx?dbcode=CJFD&dbname=CJFD2005&filename=XTLL200501002&uniplatform=NZKPT&v=0K9JfUeUZ219hKf8_9Uig8TkUdD2RwddxoEo93VvTe_TePx_UKWXP3fkafJphTDK
- Yang, S., & Xu, W. (2003). Financial affairs in early warning model for listed companies—An empirical study on Y Market’s model. China Soft Science, 01, 56–60. https://kns.cnki.net/kcms/detail/detail.aspx?dbcode=CJFD&dbname=CJFD2003&filename=ZGRK200301008&uniplatform=NZKPT&v=HfEHSr5vq5CKULix9n21awp55G9taXD1eS7FG-xLe1C8MMuhci8_Uf6B20fmSH7t
- Yang, G., Zhou, Y., & Sun, L. (2019). Enterprise financial early warning method based on Benford-Logistic Model. The Journal of Quantitative & Technical Economics, 36(10), 149–165. https://doi.org/10.13653/j.cnki.jqte.2019.10.009
- Zhang, A., Zhu, C., & Xu, D. (2001). Principal component prediction model for financial failure of listed companies and its empirical study. Journal of Financial Research, 03, 10–25. https://kns.cnki.net/kcms/detail/detail.aspx?dbcode=CJFD&dbname=CJFD2001&filename=JRYJ200103001&uniplatform=NZKPT&v=E7-M0Zs3rpcMvQ9FA5-1mZfDN981vbz52TT_ljIvlV5csFn0UuP3S3GBMGl6jK75
- Zhou, Z., & Li, D. (2019). The impact of asset-light strategy on corporate R&D investment: A case study of Chinese listed companies. Management Review, 31(06), 91–101. http://journal05.magtech.org.cn/jweb_glpl/EN/
- Zhou, H., Tang, W., & Ren, X. (2010). HGA-BP-based financial crisis warning method. Journal of Systems Management, 19(01), 1–6. https://kns.cnki.net/kcms/detail/detail.aspx?dbcode=CJFD&dbname=CJFD2010&filename=XTGL201001000&uniplatform=NZKPT&v=lWTcxMLnFAbkCS-WTmuZXceqkdDsKgERDChjbAWDroBwFPmFQ5btfogSdDzmx9af
- Zhou, S., Yang, J., & Wang, P. (1996). On the early warning analysis of financial crisis—F-score model. Accounting Research, 8(08), 1–8.
- Zmijewski, M. E. (1984). Methodological issues related to the estimation of financial distress prediction models. Journal of Accounting Research, 22(1). https://doi.org/10.2307/2490859
