
 ?Mathematical formulae have been encoded as MathML and are displayed in this HTML version using MathJax in order to improve their display. Uncheck the box to turn MathJax off. This feature requires Javascript. Click on a formula to zoom.
Abstract
The integrated use of various levels of climate change adaptation practices is a means of increasing farm productivity to meet the food demand of the world’s growing population without harming the environment. Both primary and secondary data were used. In the 2020/21 production year, primary data was collected from 461 sample households of East Hararghe Zone, Oromia, Ethiopia, for the study. For data analysis, the study employed descriptive statistics and multinomial endogenous switching econometric model. Gender, education, extension, livestock holding, cooperatives, market information, soil fertility, farm land slopes, training on land management, climate change information, training, perception of land degradation, climate change perception, and weather road distance are estimated to have a significant influence on the probability of adopting different levels of climate smart practices. According to the impact evaluation results, adopting low levels of climate smart practices increases households’ food and nutrition security by 28% and 4.3%, respectively. Adopting medium-level climate-smart practices boosts food and nutrition security by 43% and 20%, respectively. Adopting high and higher levels of climate smart practices increases food and nutrition security by 56% and 19%, respectively, over very low adopter households. As a result, policymakers should place a premium on climate change adaptation agricultural practices in order to improve rural households’ livelihoods.
1. Introduction
1.1. Background and statements of problem
It is especially true in developing countries, where unsustainable land management, land degradation, and greenhouse gas fluxes in terrestrial ecosystems have all been linked to climate change, resulting in lower agricultural output and a threat to food security (UNDP, Citation2019). Similarly, climate change has resulted in higher production costs due to more irregular and inconsistent rainfall patterns, severe floods, frequent droughts, increased insect and disease rates, and irregular agricultural planting seasons (Shrestra, 2019; Prakash et al., 2020; Barros et al., 2014; Kangogo et al., 2020).
Ethiopia is the most populated country next to Nigeria in Africa, with 112 million people (World Bank, 2019). Crops and livestock farming is the largest sector in the Ethiopian economy, employing 72% of the labor force and contributing nearly 36% of the country’s total production and 81% of export earnings (NBE, Citation2018). In Ethiopia, about 80% of the population lives in the rural farming area (Beyene & Kassie, Citation2015; Kassie et al., Citation2015) and depends on smallholder subsistence agriculture (Alemu, Citation2017), and food and their livelihood sources are directly linked to the exploitation of natural resources (Baye, Citation2017; Nigussie et al., Citation2018). The average landholding of the country is about 0.9 hectares (Alemu, Citation2017; FAO, IFAD and WFP, Citation2015).
Aside from the progress made in the last two decades, Ethiopia’s agricultural sector has been stagnant for centuries, with limited progress in a few areas due to a combination of declining soil fertility, population growth, low exports, and climate-related disasters such as drought (Amare & Belay, Citation2018; Nhat et al., Citation2019). Climate change sensitivity in agriculture is a major issue for long-term global food systems (Mase et al., Citation2017). Smallholder farmers are especially vulnerable to the effects of climate change due to their small farm sizes, lack of funds, and limited market access.
Extreme system shocks, such as climate change, disproportionately affect the poor and vulnerable (Paris & Rola-Rubzen, Citation2018). According to Anuga et al. (Citation2019), smallholder farmers, particularly those in developing countries, are particularly vulnerable to the effects of climate change. Agricultural systems, on the other hand, are becoming increasingly sensitive to climate change, necessitating adaptation, and changes to current agricultural processes. Climate change and variability remain the major challenges facing humanity globally (Abdallah et al., Citation2019; Hundera et al., Citation2019; Pedersen et al., Citation2021). Climate change poses a serious threat to developing countries where most of their population depends on climate-sensitive livelihoods with poor adaptive capacity (Gemeda et al., Citation2021). Other effects of climate change include severe weed and pest problems, ecosystem degradation, biodiversity loss, and water stress, all of which worsen the food security situation (UNDP, Citation2019).
Climate smart agriculture identifies viable options and critical supporting measures based on current understanding of sustainable agricultural development (FAO, Citation2019). Gemeda et al. (Citation2021) found that rainfall fluctuations, such as late or early rainfall patterns and poor rainfall distribution, had a significant impact on crop performance. Furthermore, temperature variability has created a favorable environment for pests and diseases by enhancing pathogen reproduction and survival throughout the lifecycle (Hondula et al., Citation2019). Furthermore, research has shown that the spatial extent and coverage of extreme floods and droughts will persist in the future (Gemeda et al., Citation2021; Mase et al., Citation2017; Tegegne & Melesse, Citation2021). Climate change, agriculture, and nutrition are thus inextricably linked, and climate change affects food availability, calorie consumption, and overall food quality (ASN, Citation2019).
So far, different studies have addressed the diverse effects of climate smart agriculture (Examples; Teklewold et al., 2013; Makate et al., Citation2017; Teklewold et al., Citation2017; Amare & Belay, Citation2018; Wainaina et al., Citation2017; Teklewold et al., Citation2017, Tambo and Mockshell, 2018). These studies do not sufficiently capture the impacts of the different extents of adoption of climate-smart practices that should be rigorously analyzed. Earlier studies in Ethiopia do not consider nutrition security as an outcome variable. As a result, there is an interest in the literature about adoption extents and impacts of climate smart practices on productivity and well-being of the household (Teklewold et al., Citation2017; Wainaina et al., Citation2017). This indicated that there is a literature gap on the impact of these adopted practices on the food and nutrition security of rural households. As a result, the current study was designed to fill a gap in the literature.
The focus area of this study, in East Hararghe zone, high population growth, rapid soil loss, deforestation, low vegetation coverage, unsustainable farming practices, the use of dung and crop residues for fuel, and overcrowding of grazing land are all regarded as major drivers of land degradation (Amare & Belay, Citation2018; Krishnan & Patnam, Citation2014). To improve food systems, rigorous efforts should be directed toward the current low adoption of climate-smart agricultural practices in Ethiopia. Therefore, this study aimed to assess the food and nutrition security impacts of extents of climate change adaptation farming practices in Eastern Oromia, Ethiopia.
1.2. Research hypothesis
H0= There are no factors affecting adoption levels of climate smart agricultural practices, H1= There are factors affecting adoption levels of climate smart agricultural practices
H0=Adoption of the different levels of climate smart practices has no effect on food and nutrition security, H1=Adoption of the different levels of climate smart practices has an effect on food and nutrition security
1.3. Specific objectives
Identify factors affecting adoption levels of climate-smart agricultural practices among smallholder farmers in the area
Evaluate the impacts of adoption levels of climate-smart practices on rural households’ food and nutrition security
2. Material and methods
2.1. Description of the study area
The study was conducted in three districts, Grawa, Haramaya, and Meta in the East Hararghe Zone of Oromia Regional State, Ethiopia. The altitude of the zone ranges from 1200 to 3405 m above sea level with minimum and maximum rainfall of 400 and 1200 mm, respectively. The total area of the zone is 22,622.6 km2. The zone has three agro-ecological zones highland (>2300), midland (1500–2300), and lowland (<1500) meters above sea level (Amare & Belay, Citation2018). Mixed crops and livestock production are the major livelihood sources of the zone.
2.2. Sources of data and methods of data collection
Both primary and secondary data sources were used. The primary data was collected by the trained enumerators. Three districts were selected randomly from 20 districts in east Hararghe Zone. From that, eight rural kebeles were selected randomly. To select sample respondents from the eight kebeles, simple random sampling based on probability proportional to size was used. Determination of the sample size was based on the formula given by Kothari (2004) as shown below:
where n is the sample size, z is confidence level (0.05), P is the proportion of the population of interest and smallholder farmers in the study area. Variable q is the weighting variable, and it would be computed as (1-P), and E is an acceptable error (level of precision). P is 0.5 since statistically, a proportion of 0.5 results in a sufficient and reliable size, particularly when the population proportion is not known with certainty. This led to q of 0.5 (1–0.5). An error of less than 10% is usually acceptable according to Kothari (2004). Thus, an error of 0.05 is used to approximate a sample size of respondents.
Secondary data was collected from written documents of the district’s agricultural development office, natural resources, and environmental protection offices and published different papers to augment the primary data
2.3. Methods of data analysis
The study employed Multinomial endogenous switching model econometric model to analyze the data in addition to descriptive statistics.
2.3.1. Food and nutrition security measure
The study employed households’ food consumption scores to measure household food security status. In this measure, the frequency of food consumption of different food groups consumed by a household during the 7 days preceding the survey is calculated, and a consumption score is calculated using weights assigned to each food group using the cut-off point of 2200 kilocalories as the minimum caloric requirement, used by official reports in Ethiopia (MOFED, 2013), and 2550 kcal consumption per adult equivalent per day as cut-off points or the daily minimum subsistence requirement (WFP and CSA, 2019). As the minimum daily calorie requirement, this study used the most recently updated cut-off points.
The Food Consumption Score (FCS) and the Household Dietary Diversity Score (HDDS) (FAO, 2012a) were used to assess farm households’ food and nutrition security (WFP, 2008). Both employ the household as the unit of analysis and record the consumption of pre-specified food groups. The World Food Programme, for example, uses eight to ten major groups: cereals and tubers, pulses, milk and milk products, meat, fish, and eggs, vegetables, fruits, oils and fats, and sugar, with additional seven subgroups considered in its extended FCS-Nutrition module (WFP, 2015b).
Dietary diversity, which includes total dietary intakes as well as diet quality, can be used to assess overall food access (Kennedy et al., 2010; Leroy et al., 2015). Scores are closely related to other easily measured aspects of socioeconomic status and health, but measuring a person’s total dietary energy and other nutrients is more expensive than others. Overall, dietary diversity scores at the household level provide a very useful measure for use when more expensive measurement methods are not feasible. Dietary diversity scores are relatively cheap to obtain, so they can be collected across large populations to track the progress of intervention and measure disparities over time. Diverse measures frequently produce diversity scores that are highly correlated with one another as well as with other measures of food security and nutrition (Kennedy et al., 2010; Lovon and Mathiassen, 2014).
Furthermore, for the household-level study, dietary diversity can be classified as low (three food groups), medium (four to five food groups), and high (six food groups) (FAO, 2015). For the HDDS and Women Dietary Diversity Score, no established cut-off points indicate adequate or inadequate dietary diversity. It is recommended that the mean score or distribution of scores be used for analytical purposes and in setting program targets or goals. The FAO’s 2015 dietary classification was used in this study using the data collected over the last 24 hours recall period before survey.
2.3.2. Multinomial endogenous switching regression (MESR)
The relationship between the food and nutrition outcome variables and a set of explanatory variables (z) is estimated in the second stage of multinomial endogenous switching regression for each practice choice, e.g. j = 1 (very low adoption as a reference category); j = 2, adoption of low practices, j = 3, adoption of medium practices, j = 4, adoption of high practices, and j = 5, adoption of very high practices. For each possible regime (j), the food and nutrition security outcome equation is as follows:
where are the welfare outcome variables of the ith farmer in regime j at time t and the error terms (
) are distributed with ϵ(
| X, z) = 0 and variance (
| x, z)=
.
are observed if only one of possible adoption combinations is used.
We added the means of all time-varying variables (̅z) in Eq. (29) as additional regressors in order to get consistent estimates. This approach can minimize the problem of unobserved heterogeneity (Mundlak, Citation1978; Wooldridge, 2010). The error term () is comprised of unobserved individual effects (ci) and a random error term (
). Therefore, OLS estimates in Equationeq. (2)
(2)
(2)
and
will be biased if
and
are not independent. A consistent estimation of and requires the inclusion of the selection correction terms of the alternative choices in EquationEq. (2)
(2)
(2) . In the multinomial choice setting, there are j-1 selection correction terms, one for each alternative adoption of the combinations. Following Di Falco (2014) and Kassie et al. (Citation2015; 2018), the second stage of MESR with consistent estimates is specified as follows:
where is the error term with an expected value of zero,
is covariance between and
,
is the inverse Mills ratio computed from estimated probabilities in Equationeq. (3)
(3)
(3) as follows:
At this point ρ is the correlation between
and
. Standard errors in Equationeq. (3)
(3)
(3) are bootstrapped to account for the heteroscedasticity arising from the generated regression due to the two-stage estimation procedure.
This model is estimated to account for potential endogeneity due to omitted variables such as selection bias. Unobserved time-invariant household characteristics could be linked to the adoption of multiple climate-smart agricultural practices as well as our food and nutrition indicators. Unobserved shocks, such as severe weather and death in the family, may also be sources of potential endogeneity. These shocks may have an impact on household food and nutrition status as well as the adoption of climate-smart practices. It is believed that major weather-related shocks are caused by climate change and the perception of land degradation.
2.3.3. Estimation of average treatment effects on the treated
To estimate average treatment on the treated we compared expected values of the outcomes of adopters and non-adopters of multiple climate-smart agricultural practices in actual and counterfactual scenarios as given below;
Adopters with adoption (actual)
Adopters had decided not to adopt (counterfactual)
The above equation defines the value of the outcome variable for adopters which would have been obtained if the coefficients on their characteristics () had been the same as the coefficient on the non-adopter characteristics Kassie et al. (Citation2018). The expected values of the food and nutrition outcomes for the households that adopted the practice j can be calculated by taking differences between actual and counterfactual outcomes following Kassie et al. (Citation2015) as:
The expected change in the mean outcome variable if adopters had the same characteristics and resources as non-adopters is captured by the first term () on the right-hand side of Equationeq (6)
(6)
(6) . The third term (
) on the right-hand side of the EquationEq. (6)
(6)
(6) along with the Mundlak approach (
) corrects selection bias and endogeneity originating from unobserved variables
2.4. Definition of variables and hypothesis
Selection of and inclusion of independent variables were through critical review of literature and scholar-related studies in the utilization of both qualitative and quantitative data types (Gazali and Abdulai, 2019; Belay et al., 2017; Masakha, 2017).
2.4.1. Dependent variables
The use of extents of climate smart practices by farming households was represented using a binary scale. In the study, the following ranked indices of climate-smart agricultural practices which are all explained by explanatory variables were identified: First, the number of adopted climate smart practices was indexed based on the extents of adopted practices. The variable measured as defined below:
Y1 = 0, if a farmer adopts very low climate-smart practices
Y1 = 1, if a farmer adopts low practices
Y1 = 2, if a farmer adopts the medium climate smart practices
Y1 = 3, if a farmer adopts high climate smart agricultural practices
Y1 = 4, if a farmer adopts very high climate smart agricultural practices
Outcome variables: Food and nutrition security is an outcome variable in impact estimation (Table ).
Table 1. The sample districts and total sample households form the target kebeles
Explanatory variables: Socio-economic variables were used as explanatory variables (Table ).
Table 2. Definitions and measurements of the variables used in the study
3. Result and discussion
3.1. Descriptive results
3.1.1. Descriptive results for sample households’ continuous variables
Education level: The total sample’s average years of formal schooling were found to be grade 3.4 years completed. The average education level for low adopters, medium practice adopters, high practice adopters, and higher level adopters was 1.74 years, 2.6 years, 2.6 years, and 3.15 years, respectively. According to the F-test results of group mean difference comparison, there is a statistically significant mean difference between the four groups at the 5% probability level.
Extension contacts: Advice, training, demonstration, and input distribution are all examples of extension services. According to the survey results, extension agents contact farmers for an average of 3.6 days per year. The average extension contact for a low level adopter, a medium level adopter, a high level practice adopter, and a higher level practice adopter was 3.2, 3.3, 3.8, and 4.3 times per year, respectively. According to the F-test results of group mean difference comparison, there is a statistically significant mean difference between the four groups at the 5% probability level.
Livestock holding: The sample households’ mean livestock holding in Tropical Livestock Unit (TLU) was found to be 2.57. The average livestock holding for a low level adopter, a medium level adopter, a high level adopter, and a higher level adopter was 1.74, 2.6, 2.6, and 3.15 years, respectively. According to the F-test results of group mean difference comparison, there is a statistically significant mean difference between the four groups at the 5% probability level. This showed that the sample households that adopted low practices, medium smart practices, high and higher climate smart agricultural practices had significant mean differences in household livestock holding.
Distance to all weather roads: Market access is a determinant of the profitability and sustainability of agricultural products, as well as a proxy for agricultural marketing services. The average distance in minutes between the villages and the weather road for the entire sample was found to be 32 minutes. The average weather road distance for low, medium, high, and higher level practice adopters was determined to be 37, 32.5, 29.3, and 29.1 minutes, respectively. The F-test results of group mean difference comparison revealed that, at a 1% probability level, there is a statistically significant mean difference among the four in terms of weather road distance. This indicated that the sample household who did adopt low level of practices, who did adopt medium level of practices, who did adopt high and higher level of climate smart practices has significant mean differences in terms of distance to weather road.
Total farm income: The average total farm income for the entire sample is 30,626.04 Birr. The average livestock income for low, medium, high, and higher level practices adopter households was found to be 20,902.3, 22781.26, 31613.5, and 55,544.84 birr, respectively. According to the F-test results of group mean difference comparison, there is a statistically significant mean difference in farm income among the four groups at the 1% probability level. This indicated that the sample households that adopted low level, medium level, high level, and higher level climate smart practices had significant mean differences in total farm income.
3.1.2. Characteristics of households (Dummy variables)
Social status of the household head: According to the survey results, 45.6% of the total sample participated in the social status survey, while the remaining 54.4% did not. In the comparison across different levels of climate smart practices, approximately 3.9, 15.6, 17.8, and 8.2% of the households who did adopt low, medium, high, and higher level practices had participated in the social status. The chi-square test revealed a statistically significant mean difference in social status of the household head among the four groups.
Cooperative membership status: According to the survey results, 48.6% of the total sample was found to be members of farmer groups and cooperatives, while the remaining 51.4% were not. In the comparison across different levels of climate smart practices, approximately 5.9, 14.3, 18, and 10.4% of the households who did adopt low level practices, medium level practices, high level practices, and higher level practices had memberships. At the 1% probability level, the chi-square test revealed a statistically significant mean difference between the four groups in terms of membership status of the household head.
Farmers training: According to the study findings, 63.6% of the total sample household participated in farmer training, while the remaining 36.4% did not. In the comparison across different levels of climate smart practices, approximately 5.9, 23.2, 20.6, and 13.9% of the households who did adopt low, medium, high, and higher level practices had participated in the farmers training. At a 1% probability level, the chi-square test revealed a statistically significant mean difference in farmer training among the four groups.
Training on land management: According to the study findings, 49.2% of the total sample household received training on sustainable land management, while the remaining 50.8% did not. According to the comparison across different groups of climate smart practices, approximately 5, 17.4, 16.5, and 10.4% of the households who did adopt low level practices, medium level practices, high level practices, and higher level practices had received land management training. The chi-square test revealed a statistically significant mean difference in land management training between the four groups at the 1% probability level.
Access to market information: According to the study findings, 66.4% of the total sample household accessed market information, while the remaining 33.6% did not. In the comparison across different groups of climate smart practices, approximately 7.6, 24.9, 21.9, and 11.9% of the households who did adopt low, medium, high, and higher level practices accessed market information. The chi-square test revealed a statistically significant mean difference in market information among the four groups at the 5% probability level.
Access to climate change information: According to the study findings, 67% of the total sample household accessed climate change information, while the remaining 33% did not. When we compare different groups of climate smart practices, we find that approximately 6.1, 22.8, 24.7, and 13.4% of households that adopted low level practices, medium level practices, high level practices, and higher level practices accessed market information. The chi-square test revealed a statistically significant mean difference in climate change information among the four groups at the 1% probability level.
Perception of climate change: According to the study findings, 67% of the total sample household perceived climate change, while the remaining 33% did not. The comparison across different groups of climate smart practices revealed that approximately 8, 22.8, 23.6, and 12.6% of households who adopted low level practices, medium level practices, high level practices, and higher level practices perceived the existence of climate change. The chi-square test revealed a statistically significant mean difference in climate change perception among the four groups at the 1% probability level.
Perception of land degradation: According to the study’s findings, 69% of the total sample household perceived land degradation, while the remaining 31% did not. The comparison across different groups of climate smart practices revealed that approximately 6.7, 22.6, 25.6, and 14.1% of households who did adopt low level practices, medium level practices, high level practices, and higher level practices perceived the presence of land degradation over the last 10 years. The chi-square test revealed a statistically significant mean difference in perception of land degradation among the four groups at the 1% probability level.
Phone: According to the study findings, 57% of the total sample household owned a mobile phone, while the remaining 43% did not. The comparison across different groups of climate smart practices revealed that approximately 4.8, 20.4, 19.7, and 12.1% of the households who did adopt low level practices, medium level practices, high level practices, and higher level practices owned a mobile phone. The chi-square test revealed a statistically significant mean difference in mobile phone ownership among the four groups at the 1% probability level.
Credit: According to the study findings, 44.7% of the total sample household accessed credit, while the remaining 53.3% did not. The comparison across different groups of climate smart practices revealed that approximately 5, 15.2, 13.7, and 10.8% of households who adopted low level practices, medium level practices, high level practices, and higher level practices accessed credit. The chi-square test revealed a statistically significant mean difference in credit access between the four groups at the 1% probability level (See Table ).
Table 3. Descriptive statistical results for sample households continuous variables
Slope: According to the study findings, 58.4% of the total sample household had a flatter average land slope, while the remaining 41.6% did not. The comparison across different groups of climate smart practices revealed that approximately 7.6, 20, 19.7, and 11.1% of households that adopted low level practices, medium level practices, high level practices, and higher level practices had flat average land slope. At the 5% probability level, the chi-square test revealed a statistically significant mean difference in land slope between the four groups (See Table ).
Table 4. Descriptive statistical results for sample households’ categorical variables
3.2. Model results
3.2.1. Determinants of extents of adoption of climate smart agricultural practices
Table shows the results of the determinants of adoption of climate smart practices. Very low-adopters are in the reference category. With the Wald test = 766.85, >chi2 = 0.000, the MNL model fits the data well, rejecting the null hypothesis that all the regression coefficients are jointly equal to zero. This section presents the results of the multinomial logit model that is used to estimate the probability of choosing particular climate smart practices. As indicated earlier, the dependent variable in this model is the level of adopted climate smart agricultural practices. The details of the first stage multinomial logit selection model results of the various combinations of climate-smart practices were presented one by one using the estimation procedures used by Abiud (20219), Liag et al. (2021), Shahazad et al. (2021) and Issahaku et al. (Citation2020).
Table 5. Determinants of extents of adopted climate smart practices
Looking into the estimated coefficients, the results indicated that the probability of adopting climate smart agricultural practices significantly influenced by 17 explanatory variables. These variables were gender, education, extension, livestock, membership status, market information, soil fertility, slopes of farm land, training on land management, climate change information, access to training, perception of land degradation, climate change perception, and weather road distance.
Education of head: This variable has a positive and significant relationship to the probability of adopting higher level of climate smart practices at 1% probability level. The marginal effects of 0.0158 for education level stated that, keeping other factors constant, the probability of adopting a higher level of climate smart practices increases by 1.6% as education level of household head increases by 1 year. A positive impact of education on technology acquisition is generally expected as it enhances farmer’s ability to acquire and analyze new ideas, and provides specific or general skills that contribute to farm productivity. Education is expected to improve farmers’ ability to acquire and analyze new ideas, as well as provide specific skills that contribute to farm productivity (Daniel and Muluget, Citation2017).
Similar to the finding of this study, Daniel and Muluget (Citation2017) and Workneh (2015) reported that education gives farmers the ability to perceive, interpret, and respond to new information much faster than farmers with lower education level (non-educated). Thus, those household heads with better education level have a higher probability of adopting best practices. This finding is also consistent with that of Ademe et al. (Citation2019), Etim et al. (Citation2019), Luu (Citation2020) and Sandhya et al. (2021).
Extension contact: Extension contact was found to be affecting the probability of adopting high and higher level of climate smart practices significantly and positively at 1 and 5% probability level. The marginal effect values of 0.0228 and 0.0145 of extension contact indicated that keeping other factors constant, the probability of adopting high and higher level of climate smart practices increases by 2.3 and 1.4% as extension contact increases by one advisory contact. Agricultural development agents are the main source of training and information on how to use these technologies and practices. Access to extension agents will increase farmers’ awareness and information on the importance of technology adoption. A fascinating finding is that, more than access to extension services, farmers’ trust in extension workers’ knowledge influences them to adopt climate-smart agriculture practices. This finding supports the findings of Teklewold et al. (Citation2017), Luu (Citation2020), Nhat et al. (Citation2019).
Access to farmers training: This variable has a negative and significant relationship to the probability of adopting low level of climate smart practices at 5% probability level. The marginal effects of 0.1148 for access to training indicated that keeping other factors constant, the probability of adopting low level of climate smart practices decreases by 11.5% as the household being accessed farmers training. Thus, farmer’s training is associated positively with adoption of these technologies and practices. The results also show that being member of a social organization influences positively and significantly farmer’s adoption of improved climate smart agriculture. Access to farmers training is more likely to obtain technological and climate-related information and its effects of crop and livestock production. This result is consistent with the findings of Tesfaye, (Citation2017) and Zakarias et al., (2020).
Training on land management practices: This variable has negative and significant relationship to the probability of adopting low level of climate smart practices at 10% probability level. The marginal effects of 0.084 for training on land management practices indicated that keeping other factors constant, the probability of adopting low level of climate smart practices decreases by 8.4% as the household being accessed for training on land management practices. This is due to the technical knowledge and the benefits of land management practices for crops and livestock productivity. This is due to technical knowledge and the advantages of land management practices in terms of long-term crop and livestock productivity. This result agrees with the findings of Tesfaye (Citation2017) and Zakarias et al. (2020).
Livestock holdings: This variable has positive and significant relationship to the probability of adopting high and higher level of climate smart practices at 5 and 1% probability level. The marginal effects of 0.0186 and 0.0226 of livestock holding indicated that keeping other factors constant, the probability of adopting high and higher level of climate smart practices increased by 1.8 and 2.3% as the household livestock holding increases by one tropical livestock unit, respectively. Livestock is the primary source of manure and compost, as well as the drivers of soil fertility enhancing inputs. This could be explained by those farmers with large herd size who have better chance to earn more money to invest on tools required for conservation practices, alternative income sources and for livestock feeds. Similar results were reported by Belay et al. (Citation2017), Deressa et al. (2011), Haftu et al. (2016), and by Ali and Erenstein (Citation2017) who revealed statistically significant relationship between livestock ownership and adaption of sowing time adjustment and crop diversification. The findings are consistent with those of Bongole et al. (2020), Etim et al. (Citation2019) and Tekeste (2021).
Cooperative memberships of head: Participation of household head to local cooperative memberships found to be affecting the probability of adopting low climate smart practices at 5% probability level. The marginal effects of 0.0968 for cooperative memberships indicated that keeping other factors constant, the probability of adopting low level of climate smart practices decreases by 9.7% as the household being participated to local cooperative memberships. On the social capital networks and social conformity, membership in at least one agricultural group and trust in fellow community members had a positive effect on the choice of climate smart agricultural practices. The adoption of climate-smart practices was influenced by membership in at least one agricultural group or cooperative community members. Such social networks improve access to markets and financial services by facilitating information flows about markets, opportunities, potential risks, and climate change shocks. This result is consistent with the findings of Etim et al. (Citation2019), Sandhya et al. (2021) and Tekeste (2021).
Access to climate change information: This variable was found to be negatively related with the probability of adopting low level of climate smart practices at 1% probability level. Whereas positively and significantly related to the probability of adopting the medium level of climate smart practices at 5% probability level. The marginal effects of 0.0144 and 0.1105, for climate change information indicated that keeping other factors constant, the probability of adopting low and medium level climate smart practices decreases and increases by 1.4 and 11.1% as the household being accessed climate change information. The reason is that those farmers that have access to climate change information are more likely to implement its adaptation practices and to protect its effects on agricultural production.
This result is consistent with the findings of Nhat et al., (Citation2019) and Ademe et al. (Citation2019). Similar to findings of Hailemariam et al (Citation2019) and Aryal et al. (Citation2018), infrastructure reduces transaction costs, facilitates transport of farm inputs and outputs, opportunity costs of time and acquiring timely production, market and climate information thus enhancing the capacity of adoption of climate smart agricultural practices. Access to information was significant at 10% significance level for feed conservation. Although not significant for other three practices, the finding upholds the results of Mulwa et al (Citation2017) and Issahaku and Abdulai (Citation2020) that exposure of farmers to climate information increases the knowledge and awareness of climate change and climate smart agriculture skills and practices and hence the likelihood of the farmers to take measures to cope and mitigate the risks associated with climate change.
Perception of climate change: This variable has a positive and significant relationship to the probability of adopting high and higher level climate smart practices at 5 and 1% probability level. The marginal effects of 0.1018 and 0.0917 for climate change perception indicated that keeping other factors constant, the probability of adopting high and higher level climate smart practices increased by 10.2 and 9.2% respectively as the households being perceived climate change. The possible justification is that those farmers that have perceived climate change are more likely to implement technological and climate related information and its effects on agricultural production. This result is consistent with the findings of Nyang’au et al (2021)
Distance to weather road: This variable was found to be negative and statistically significant at 5% probability level with probability of adopting medium and higher level of climate smart practices. The marginal effects of 0.0035 and 0.004 of weather road distance imply that, other things being constant, the probability of adopting medium and higher level of climate smart practices decreases by 0.04 and 0.4% as distance to weather road increases by one unit. Distance to input and output market significantly increased the likelihood of adopting climate smart practices. Access to markets determines the availability of inputs required for climate change adoption, a means of exchanging and sharing information and experiences on climate smart agriculture among farmers. However, the accessibility of the markets depends on the condition of infrastructure. The findings show that distance to the weather road was significant for improved adoption of climate smart practices. This result contradicts the findings of Etim et al. (Citation2019) and Luu (Citation2020). This finding is consistent with that of Tekeste (2021) and Nhat et al. (Citation2019). Similarly, Hailemariam et al. (Citation2019) and Aryal et al. (Citation2018) discovered that infrastructure lowers transaction costs and facilitates the transport of inputs and outputs.
Perception of land degradation: At a 5% probability level, this variable was found to be positively related to the likelihood of adopting higher level of climate smart practices. The marginal effects of 0.0897 for the variable indicate that when all other factors are held constant, the likelihood of adopting higher level of climate smart practices increased by 8.9% as the household head perceived land degradation. Farmers’ perceptions of climate-smart agricultural technologies also play a significant role in technology adoption and success. This finding is consistent with the findings of Nhat et al. (Citation2019), Dereje et al. (Citation2019), Etim et al. (Citation2019) and Tekeste (2021) as well as the findings of Ntshangase et al. (2018), who emphasized that age, level of education, and farmers’ positive perceptions are key factors in technology adoption.
The slope of farmland: At 5% and 1% probability levels, this variable was found to be negatively and positively related to the likelihood of adopting low and high level of climate smart practices. The marginal effects of 0.097 and 0.114 for the variable indicate that when all other factors are held constant, the probability of adopting low and high level of climate smart practices decreases and increases by 9.7 and 11.4%, respectively, as the average farm household was planned. This result agrees with the findings of Dereje et al. (Citation2019).
Gender: This variable was found to be negatively and positively related to the likelihood of adopting the medium and higher level of climate smart practices at a 10 and 1% probability level. The marginal effect of −0.1046 and 0.0884 for this variable indicates that when other factors are held constant, the likelihood of adopting the medium and higher level climate smart practices decreases and increases by 10.5 and 8.8% when the household was headed by male. This finding is consistent with the findings of Bongole et al. (2020).
Mobile phone ownership: This variable was found to be positively and significantly related to the likelihood of adopting higher level of climate smart agricultural practices at a 5% probability level. The marginal effect of 0.074 for the variable shows that if other factors remain constant, the probability of adopting the higher level of climate smart practices increases by 7.4% for the household who owned mobile phone. This result agrees with the findings of Ali (2021).
Credit: This variable was found to be negatively and positively related to the likelihood of adopting the low and medium level of climate smart practices at a 1 and 5% probability level. The marginal effect of -0.143 and 0.0975 for this variable indicates that when other factors are held constant, the likelihood of adopting the low and medium level climate smart practices decreases and increases by 14.3 and 9.8% when the household being accessed credit. This finding is consistent with the findings of Bongole et al. (2020).
Labor force: At a 10% probability level, this variable was found to be positively related to the likelihood of adopting the medium level of climate smart practices. The marginal effects of 0.0006 for the variable indicate that, if all other factors remain constant, the probability of adopting the medium level of climate smart management practices increased by 0.06% for every additional household labor force. This finding backs up the findings of Destaw and Fenta (2021).
3.3. Impact evaluation
3.3.1. Impact evaluation results: Second stages of MESR
This section of the impact evaluation presents the second stage of multinomial endogenous switching results of average treatment effects on the treated using outcome variables with actual and counterfactual result comparisons. The multinomial treatment effects of different extents of climate-smart practice on farm households’ food and nutrition security were estimated in the second stage multinomial endogenous switching regression. The appendix tables show the detail estimation with their respective covariates, including selectivity correction terms (Tables ).
Table 6. Impacts of different level of climate smart practices on households’ food security
Table 7. Impacts of different level of climate smart practices on nutrition
Here the actual and counterfactual results of an outcome variables and the level of the treatment effect were presented for the different extents of climate-smart practices. In the multinomial endogenous switching estimation perception of climate change and land degradation variables were used as an instrumental variables and validity of the variables were tested. The test result indicated that the selected variables were valid to be used an instrumental variable. The same estimation procedures were used by Abiud (20219), Liag et al (2021), Shahazad et al (2021), Abebe et al (Citation2017), Makaiko et al (2021) and Issahaku et al (Citation2020).
3.3.2. Impacts of extents of adopted climate smart practices
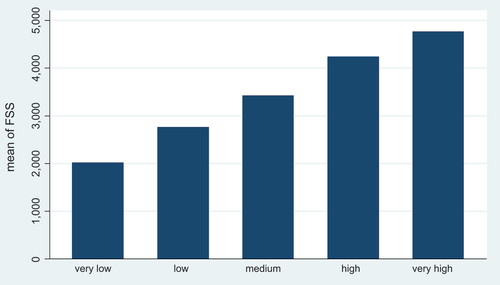
Table shows the impact of adopting different level of climate-smart practices on the food security status of rural households at various treatment levels. According to the average treatment effect estimation, adopting low level of climate smart agricultural practices increases farm households’ food security status by 28%. Adopting the medium level of climate smart agricultural practices increases households’ food security status by 43%, and adopting high and higher level of climate smart agricultural practices increases farm households’ food security status by 56 and 61% over very low-adopter households, and this difference is significant at a 1% probability level (Table ).
The following figure indicates the mean levels of food security status of the farm households measured by calorie intake by different treatment levels of climate-smart agricultural management practices.
Figure 1. Food security status by level of climate smart management practices.
3.3.2.1. Impacts extents of adopted climate smart practices on nutrition security
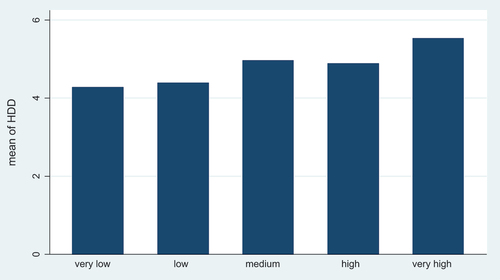
Table shows the impact of adopting different level of climate-smart practices on the nutritional security status of rural households at various treatment levels. According to the average treatment effect estimation, adopting low level of climate smart agricultural practices has no significant impact on farm households’ nutritional security status. Adopting the medium level of climate smart agricultural practices increases households’ nutritional security status by 20%, and adopting high and higher level of climate smart agricultural practices increases farm households’ nutritional security status by 19 and 41% over very low-adopter households, and this difference is significant at a 1% probability level (Table ).
Figure indicates the mean levels of nutrition security status of the farm households measured by the household dietary diversity score by different treatment level climate smart agricultural practices.
Figure 2. Nutritional status by level of climate smart management practices.
4. Conclusion and recommendations
This study was carried out to examine the determinants and impact of climate change adaptation agricultural practices on food and nutrition security in the district of East Hararghe zone Oromia, Ethiopia. The study employed both primary and secondary sources of data. The primary data source was gathered from 461 sample households using semi-structured questionnaires. Secondary data were collected from different sources to support primary data. The study employed a multinomial endogenous switching model to identify determinants of adoption.
Multinomial logit model results indicated that the probability of adopting different levels of climate smart agricultural practices is significantly influenced by; gender, education level, extension contact, livestock holding, membership status, market information, soil fertility, slopes of farm land, training on land management, climate change information, access to training, perception of land degradation, climate change perception, and weather road distance. Impact evaluation result indicated that adopting low level of climate smart practices increases farm households’ food and nutrition security statuses by 28% and 4.3%. Adopting the medium indicators of climate smart practices increases food and nutrition security status by 43% and 20%, respectively. Whereas adopting high and higher extents of climate smart practices increases food and nutrition security by 56% and 19% and 61% and 41% over that of very low adopter households, respectively.
Overall, the study identified knowledge and skills, finance, perception and awareness, information, infrastructure, and information dissemination as major challenges of CSA in the area. Therefore, improving farmers’ education, training on land management, farmer training, and accessing extension services should be some of the policy measures that will facilitate adoption. Increasing farmers’ awareness of climate change and land degradation, according to the study, facilitates smallholder adoption of climate smart agriculture. Farmers’ adoption of climate-smart practices is aided by the expansion of rural social capitals such as farmers’ cooperatives, farmer groups, and social status. Providing appropriate market and weather information can assist smallholders in making informed decisions about crop variety selection, planting time, resource allocation, and crop and livestock management. It is strongly advised to own a mobile phone and use it for agricultural and market information. Livestock ownership and economic participation also assist producers in reducing the financial and labor requirements of climate smart agriculture.
Acknowledgments
The authors acknowledge that the College of Agricultural and Environmental Sciences of Haramaya university for funding this research.
Disclosure statement
No potential conflict of interest was reported by the authors.
Data availability statement
The author confirms that the data will be available based on the acceptance of the paper.
Additional information
Notes on contributors
Beyan Ahmed
Beyan Ahmed, (PhD) Beyan is an experienced lecturer and researcher at Haramaya university. His research interest is environmental economics, impact evaluation, Resilience food systems, climate change economics, food and nutrition, health economics, adoption and efficiency, and development partnerships
Jema Haji is the most senior professor of agricultural economics at Haramaya university. His research areas are Productivity, Marketing, Impact evaluation, and Climate change and adaptation strategies.
Mengistu Ketema (Prof, PhD), Mengistu has an Extensive experience in research, education, teaching and management of institutions at Haramaya. His research interest are climate change, farming system, value chain, climate change economics, impact assessment, natural resource economics, and production and efficiency analysis.
Kedir Jemal (PhD), Kedir is a senior researcher and lecturer in Haramaya university. His research interest includes climate change, natural and environmental resource economics, gender and conflict resolution, food security and multidimensional poverty.
References
- Abdallah, A. H., Ayamga, M., & Awuni, J. A. (2019). Impact of agricultural credit on farm income under the savanna and transitional zones of Ghana. Agricultural Finance Resource, 79(1), 60–21. https://doi.org/10.1108/AFR-02-2018-0009
- Alemu, M. M. (2017). Current trends of investment effect on land-use practices of Ethiopia. Open Access Library Journal, 4, e3326. http://doi.org/10.4236/oali-b-1103-326
- Amare, A., & Belay, S. (2018). Determinants of smallholder farmers’ decision to adopt adaptation options to climate change and variability in the muger sub basin of the upper blue nile basin of Ethiopia. Agric and Food Security, 6(1), 64. https://doi.org/10.1186/s40066-017-0144-2
- Anuga, S. W., Gordon, C., Boon, E., & Surugu, J. M. (2019). Determinants of climate smart agriculture (CSA) adoption among smallholder food crop farmers in the Techiman Municipality, Ghana. Ghana Journal Geographical, 11, 124–139.
- Aryal, J. P., Jat, M., Sapkota, T. B., Khatri-Chhetri, A., Kassie, M., Rahut, D. B., & Maharjan, S. (2018). Adoption of multiple climate-smart agricultural practices in the Gangetic plains of Bihar, India. International Journal of Climate Change Strategies and Management, 10(3), 407–427. https://doi.org/10.1108/IJCCSM-02-2017-0025
- ASN, (2019). Nutrition and climate change, American society for nutrition. Retrieved December 1, 2020) from https://nutrition.org/nutrition-and-climate-change/.
- Baye, T. (2017). Poverty, peasantry, and agriculture in Ethiopia. Ann Agrarian Science, 15(3), 420–430. https://doi.org/10.1016/j.aasci.2017.04.002
- Beyene, A. D., & Kassie, M. (2015). Speed of adoption of improved maize varieties in Tanzania: An application of duration analysis. Technological Forecasting and Social Change, 96, 298–307. https://doi.org/10.1016/j.techfore.2015.04.007
- FAO. (2019). Early Warning Early Action report on food security and agriculture. www.fao.org/publications/card/en/c/CA8606EN
- FAO, IFAD and WFP. (2015). State of Food Insecurity in the World. Meeting the 2015 international hunger targets: Taking stock of uneven progress. Advance in Nutrition Intrenational Review Journal, 6(5), 513–627.
- Gemeda, D. O., Feyssa, D. H., & Garedew, W. (2021). Meteorological data trend analysis and local community perception towards climate change: A case study of Jimma City, Southwestern Ethiopia. Environment, Development and Sustainability, 23(4), 5885–5903. https://doi.org/10.1007/s10668-020-00851-6
- Hondula, E. K. L, Kinney, P., Monaghan, A., Morin, C. W., Ogden, N., & Springmann, M. (2019). Health risks of climate variability and change. In Alan E., G., Montserra, F., Jennifer, A. H., & Richard, L. S. (Eds.), Handbook of Environmental and Ecological Statistics (1st ed) (Vol.1) (pp. 819–839). Chapman and Hall/CRC.
- Hundera, H., Mpandeli, S., & Bantider, A. (2019). Smallholder farmers’ awareness and perceptions of climate change in Adama district, central rift valley of Ethiopia.Weather Clim. Extrem, 26, 100230. https://doi.org/10.1016/j.wace.2019.100230
- Issahaku, G., & Abdulai, A. (2020). Can farm households improve food and nutrition security through adoption of climate‐smart practices? empirical evidence from Northern Ghana. Applied Economic P. https://doi.org/10.1093/aepp/ppz002 42 (3) 559–579
- Kassie, M., Marenya, P., Tessema, Y., Jaleta, M., Zeng, D., Erenstein, O., & Rahut, D. (2018). Measuring farm and market level economic impacts of improved maize production technologies in Ethiopia: Evidence from panel data. Journal Agricultural Economics, 69(1), 76–95. https://doi.org/10.1111/1477-9552.12221
- Kassie, M., Teklewold, H., Marenya, P., Jaleta, M., & Erenstein, O. (2015). Production risks and food security under alternative technology choices in Malawi: Application of a multinomial endogenous switching regression. Journal Agricultural Economics, 66(3), 640–659. https://doi.org/10.1111/1477-9552.12099
- Krishnan, P., & Patnam, M. (2014). Neighbors and Extension Agents in Ethiopia: Who Matters More for Technology Adoption? American Journal of Agricultural Economics, 96(1), 308–327. https://doi.org/10.1093/ajae/aat017
- Luu, D. T. (2020). Origins of farmers’ adoption of multiple climate-smart agriculture management practices in the Vietnamese Mekong delta. Makara Human Behavior Studies in Asia, 24(2), 141–153. https://doi.org/10.7454/hubs.asia.1030320
- Makate, C., Mango, N., & Mango, N. (2017). Sustainable agriculture practices and livelihoods in pro-poor smallholder farming systems in southern Africa. African Journal of Science, Technology, Innovation and Development, 9(3), 269–279. https://doi.org/10.1080/20421338.2017.1322350
- Mase, A. S., Gramig, B. M., & Prokopy, L. S. (2017). Climate change beliefs, risk perceptions, and adaptation behavior among Midwestern US crop farmers. Climate Risk Management, 15, 8–17. https://doi.org/10.1016/j.crm.2016.11.004
- Mundlak, Y. (1978). On the pooling of time series and cross-section data. Econometrica, 46(1), 69–85. https://doi.org/10.2307/1913646
- NBE. (2018). Quarterly Bulletin, First Quarter 2017/18 fiscal. Year Series, 34(1), 1–126.
- Nhat, L. T., Roberto, F. R., Ole, J., B, S., Wassmann, R., Dinh, T. N., & Nong, N. K. (2019). Determinants of adoption of climate-smart agriculture technologies in rice production in Vietnam. International Journal of Climate Change Strategies and Management, 12(2), 2020 pp. 238–256. https://doi.org/10.1108/IJCCSM-01-2019-0003
- Nigussie, Z., Tsunekawa, A., Haregeweyn, N., Adgo, E., Cochraned, L., Floquete, A., & Abele, S. (2018). Applying Ostrom’s institutional analysis and development framework to soil and water conservation activities in north-western Ethiopia. Land Use Policy, 71, 1–10. https://doi.org/10.1016/j.landusepol.2017.11.039
- Paris, T., & Rola-Rubzen, M. F. (2018). Gender dimension of climate change research in agriculture: case studies in Southeast Asia. In Thelma, P., & Maria , F. (Eds.), CGIAR Research Program on Climate Change, Agriculture and Food Security.
- Pedersen, J. S. T., Santos, F. D., van Vuuren, D., Gupta, J., Coelho, R. E., Aparício, B. A., & Swart, R. (2021). An assessment of the performance of scenarios against historical global emissions for IPCC reports. Global Environmental Change, 66, 102199. https://doi.org/10.1016/j.gloenvcha.2020.102199
- Tegegne, G., & Melesse, A. M. (2021). Comparison of trend preserving statistical downscaling algorithms toward an improved precipitation extremes projection in the headwaters of blue nile river in Ethiopia. Environ Proc, 8(1), 59–75. https://doi.org/10.1007/s40710-020-00474-z
- Teklewold, H., Mekonnen, A., Kohlin, G., & Falco, S. D. (2017). DOES ADOPTION of MULTIPLE CLIMATE-SMART PRACTICES IMPROVE FARMERS’ CLIMATE RESILIENCE? EMPIRICAL EVIDENCE from the NILE BASIN of ETHIOPIA. Empirical Evidence from the Nile Basin of Ethiopia Climate Change Economics, 8(01), 1750001. https://doi.org/10.1142/S2010007817500014
- UNDP, (2019). Climate change adaptation Ethiopia. Retrieved December 25, 2021 form https://www.adaptation-undp.org/explore/Ethiopia
- Wainaina, P., Tongruksa Wattana, S., & Qaim, M. (2017). Synergies between different types of agriculture technologies in the Kenyan small farm sector. The Journal of Development Studies. https://doi.org/10.1080/00220388.2017.1342818