
 ?Mathematical formulae have been encoded as MathML and are displayed in this HTML version using MathJax in order to improve their display. Uncheck the box to turn MathJax off. This feature requires Javascript. Click on a formula to zoom.
Abstract
The objective of this paper was to analyse the relationship between inflation and economic growth in Burundi and to determine whether there is an inflation threshold or not to allow monetary authority to adopt the optimal policies to deal with shocks. With annual data from 1990 to 2020, the ARDL approach is adopted to assess the short and long run relationship between inflation and economic growth. The results showed a negative and significant relationship in the short run between inflation and economic growth, and a positive and significant relationship between investment, household consumption, and exchange rate with economic growth in the long run. Moreover, with the conditional least square (CLS) method used to determine the threshold, an inflation threshold of 13% above which inflation is harmful to growth by 3.7% was found. In addition, two stage least square (2SLS) was used for robustness checking and yielded the same results. We recommend to policy makers to target an inflation ceiling of 13%, to coordinate the various policies, whether monetary, budgetary and fiscal, and to promote investment and improve the structure of production.
1. Introduction
It is generally accepted that one of the main objectives of macroeconomic policy is to achieve a high and sustained rate of economic growth while maintaining a low inflation rate. For Ibarra and Trupkin (Citation2016) the main objective of monetary policy is to achieve and maintain high growth with low inflation. Khan et al. (Citation2001) argue that a high level of growth with stable inflation is the central objective of macroeconomic policy. However, to achieve these economic policy objectives it is crucial to determine the existing relationship between inflation and economic growth.
Even though this relationship has been widely studied, it is not well defined, and the debate on the exact association between these two variables is still open. In the existing literature the views fall into four categories: inflation has no influence on economic growth Cameron et al. (Citation1996) DorranceGraeme (Citation1966) MukokaShame and Mukoka (Citation2018) Sidrauski (Citation1967) Wai (Citation1959) inflation has a positive impact on economic growth Benhabib and Spiegel (Citation2009) Lily et al. (Citation2021) Rapach (Citation2003) inflation has a negative impact on economic growth Akinsola and Odhiambo (Citation2017) Friedman (Citation1971) Nas and Perry (Citation2018) C G F (Citation2003) and inflation has an impact on economic growth in terms of a specific threshold Aydın et al. (Citation2016) Azam and Khan (Citation2020); Dinh (Citation2020) Rasyid et al. (Citation2021) Khan et al. (Citation2001). Moreover, research on the inflation threshold for panels of countries has found different thresholds but reflecting the same realities. That is, there is an inflation threshold of less than 5% for developed countries and a double-digit threshold for developing countries Azam and Khan (Citation2020) Fei et al. (Citation2019) Khan et al. (Citation2001).
The literature suggests that low and stable inflation contributes to economic growth by enabling an optimal environment for investment, an environment that does not penalize producers and allows consumers to continue consuming but also facilitates decision-making of all economic actors by reducing the uncertainty. Although, high inflation rate is associated with uncertainty and thus have a negative impact on the economic growth and welfare of society by reducing the purchase power of household, affecting decision-making on investment and consumption, increasing the gap between income groups. In Burundi, the 1990s were characterized by high inflation, which reached 30% in 1997. This decade was also characterized by negative GDP growth rates, almost −8% in 1995. This negative growth rate is largely explained by the political crisis that shook the country during this decade. In the 2000s, despite the end of the crisis, the inflation rate did not go down but oscillated between low and high inflation and reached 25% in 2008, partly due to the financial crisis that shook the world. Even with this instability of the inflation rate, the GDP growth rate managed to remain at a rate close to 5% between 2006 and 2014 before experiencing a sharp decline in 2015 to reach −4% due to the political crisis in the country in 2015. This instability of inflation rate can be explained by internal shocks, such as the drop in production that can be accentuated by external shocks, such as the increase in the price of fuel given Burundi’s strong dependence on imports.
In view of the central role played by the level of inflation for the optimization of monetary policy and thus in the long term on growth, the main objective of this paper is to shed light on the relationship between inflation and economic growth in the short and long-run to allow monetary authority to adopt the optimal policies to deal with shocks. Moreover, this inflation–growth relationship is not the only one to consider because Burundi is part of the East African community. The protocol creating this union, signed in November 2013, sets four so-called first-tier convergence criteria, including an 8% inflation rate ceiling. In addition, Burundi’s monetary authority main objective is to maintain price stability by the country’s monetary and exchange rate policy through a move to an inflation targeting regime. All this leads us to the second objective of this paper, which is just as essential as the first, concerning the determination of an optimal inflation threshold to ensure whether the inflation ceiling as established by the EAC is optimal for Burundi but also to allow the Burundian monetary authority to adopt the right inflation target for the conduct of monetary policy. That is to say, an inflation rate that does not penalize producers and that allows consumers to continue to consume.
The originality of this paper lies in three points. First, this paper is a country-specific study, using characteristics of Burundi to shed light on the inflation growth relationship and for the estimation of the threshold. Second, it uses ARDL for the analysis of the inflation growth relationship in the short and long run. This model does not impose restrictive assumptions on the variable order of integration but also provides unbiased information even when some of the variables in the regression are endogenous. Third, we use the CLS (Conditional Least Square) for the determination of the threshold level and the 2SLS (Two Stage Least Square) for robustness check of the results. We found an inflation threshold of 13% that is above the inflation ceiling of the East African Community (EAC) suggesting for policy makers in Burundi to think twice before adopting the inflation ceiling set by EAC in order not to slowdown economic growth. This paper is organized as follows: section 1 presents a brief review of the theoretical and empirical literature on optimal inflation; section 1.2 discusses the methodological framework of this research; section 1.3 presents the estimation results, while section 1.6.1 concludes and summarizes the policy implications of the study.
1.1. Review of the literature
The relationship between inflation and growth has been widely studied theoretically or empirically, but it remains inconclusive due to the different country context, the use of different proxies and measurement methodologies Gokal and Hanif (Citation2004). In recent years, inflation is considered by many economists to affect the economy in both negative and positive ways Ball (Citation2017) Eggoh and Khan (Citation2014) Kremer et al. (Citation2013) Nas and Perry (Citation2018). S. J. J. o. m. e. Fischer (Citation1993) was the first to study the possibility of non-linearity in the relationship between inflation and output growth with a panel of 93 countries. He found a positive relationship between inflation and economic growth at low rates of inflation, which became negative as inflation increased. This means that below a certain threshold the effect of inflation on growth is positive.
However, several previous studies have provided divergent results on the association between inflation rates and growth. These studies can be divided into two broad categories: panel studies and country-specific studies. For panel studies: Azam and Khan (Citation2020) using fixed effects and generalized least squares (FGLS) methods, empirically evaluated the threshold effect of inflation on economic growth for 27 countries. They found that inflation hinders growth when inflation exceeds the turning point of 12.23% and 5.36% for developing and developed economies, respectively. Mohammad Hoomani et al. (Citation2020) using the smooth transition regression model (STAR) and data from eight developing Islamic countries over the period 1990–2017 found an inflation threshold of 11.88% beyond which inflation has a negative impact not only on economic growth but also on investment. Ekinci et al. (Citation2020) using a dynamic threshold panel data model found that the threshold value was 4.182% in inflation targeting countries. Below this threshold, the inflation–growth relationship is insignificant, and above that threshold, inflation negatively affects economic growth. Ndoricimpa (Citation2017) found 9% and 6.5% for low- and middle-income African countries, respectively. Ibarra and Trupkin (Citation2016) found 19.13% and 4.47% for non-industrialized and industrialized economies, respectively. Similarly, Thanh (Citation2015) found 7.84% for ASEAN-5 countries, Muzaffar and Junankar (Citation2014) found a threshold between 7% and 14% for 14 Asian countries, Kremer et al. (Citation2013) suggest 2.53% and 17.22% for industrialized and non-industrialized countries, respectively. Khan et al. (Citation2001) estimated a threshold of 1–3% for industrialized economies, while for developing countries they found 11–12%.
For country-specific studies, they suggest a wide range of inflation threshold: Tarawalie and Kamara (Citation2022) using a non-linear model (quadratic function) with time-series data from 1980 to 2020, found an inflation threshold of 10.3% for Sierra Leone. Asaduzzaman (Citation2021) examined the relationship between inflation and economic growth in Bangladesh using time series annual data covering the sample period from 1980 to 2017, an ARDL model to test for cointegration and a quadratic regression to estimate the threshold level found an inflation threshold of 7%. Tenaw and Demeke (Citation2020) examined effect of the inflation threshold on economic growth in Ethiopia over the period 1975–2018 using a two-regime auto-regressive threshold (TAR) model. It was found that the inflation threshold was in the range of 9–10% for Ethiopia. In particular, the threshold level for food inflation is between 10% and 8% for non-food inflation. Dammak and Helali (Citation2017) in the case of Tunisia, the authors of the paper, with data from January 1993 to November 2012, using the econometric technique proposed by Hansen and improved by Khan et al. (Citation2001) found a threshold of 3.48%. Above this threshold, there is a statistically significant negative relationship between the inflation rate and economic growth. Rutayisire (Citation2015) using a quadratic regression model for the Rwandan economy, with a data set covering the period from 1968 to 2010, showed that at low levels inflation does not affect economic growth while at higher levels inflation reduces economic growth. It also found an inflation threshold of 12.7%. Esen et al. (Citation2016), with data from the first quarter of 2002 to the first quarter of 2015, using an autoregressive threshold model (TAR), found an inflation threshold on economic growth of 8.89%. An inflation rate above this threshold exerts a negative influence on growth, while an inflation rate below this threshold exerts a positive influence on economic growth. Bawa and Abdullahi Ismaila (Citation2012) using quarterly time-series data for the period 1981 – 2009, using a threshold regression model developed by Khan et al. (Citation2001) found an inflation threshold of 13% for Nigeria. Below this threshold, inflation has a moderate effect on economic activity, while above it, the magnitude of the negative effect of inflation on growth is high. So, whether for panels or for country-specific studies, there is a common thread among all these studies that below the thresholds found that the effect of inflation is often positive. Empirically, one of the most widely used estimation methods for country-specific thresholds is the one developed by Hansen (Citation1999) and improved by Khan et al. (Citation2001), this method also called conditional least squares (CLS) has been used in many recent country-specific studies; Mosikari and Eita (Citation2018) found 12% for Jiranyakul and Jiranyakul (Citation2017) found 3% for Thailand; Behera and Mishra (Citation2017) found 4% for India; Gebregergis and Mekuria (Citation2016) found 10% for Ethiopia; Thanh (Citation2015) found 7% for Vietnam.
1.2. Methodology
Since the inflation threshold is unknown, it must be estimated along with other regression parameters. The best method in this case is nonlinear least square (NLLS). Furthermore, since the optimal inflation level enters the regression in a nonlinear and non-differentiable manner, conventional gradient search techniques to implement NLLS are inappropriate Khan et al. (Citation2001). Instead, Conditional Least square can overcome all these inconveniences. This method was created by B. E. J. J. o. e. B. E. Hansen (Citation1999) and developed by Khan et al. (Citation2001) for the analysis of threshold level of inflation for both industrial and developing countries.
is the GDP growth,
is the inflation rate measured by the consumer price index (CPI),
is a dummy variable
= 1 if
and
if
,
is a vector of explanatory variables (HOUSEHOLD_EXP, INVEST, OFFI_EXCH).
is a dummy variable that materializes the shock (the political crisis) that Burundi underwent in 1993. Details on variables in Table .
Table 1. Description of variables
In the CLS technique, the basic idea is to find the level of inflation that minimizes the sum of residual squares (RSS) or the one that maximizes the R-squared for different values of the assigned threshold points. As B. Hansen (Citation1996) suggests, the growth Equationequation (1)(1)
(1) is estimated using the OLS method for different values of the threshold (K) that are assigned in an ascending order as (1, 2, 3, … etc). Since the value of k is arbitrary, the optimal k can be obtained from the estimates of Equationequation (1)
(1)
(1) by selecting the value of the estimated equation that gives the lowest value of the residual sum of squares (RSS) and maximizes R square. In the conditional least squares (CLS) method before starting the regression, it is necessary to assign dummy values to the inflation threshold. For example, if the inflation threshold (K) chosen is equal to 2%, the dummy variable (DINFLA) must be assigned 0 for all values less than or equal to 2% and 1 for all values that are greater than 2%. In regards to the literature above, we can see that the inflation threshold for developing countries is most of the time between 7% and 15%. Thus, for this paper the values of K are from 7% to 15%.
The parameter k has the property that the link between output growth and inflation is given by at low inflation and
+
at high inflation. When the coefficient on DINFLA is significant (
significant), and we have the lowest value of the residual sum of squares (RSS) and the maximum R square, then the two (
+
) can be summed to see their impact on growth when the inflation is above the threshold estimated even if
is statistically not significant.
1.3. Presentation of the results
The descriptive table (Table ) shows an average GDP growth rate of 1% and a maximum growth rate of 5.4%. We also see that the averages for inflation, investment, household expenditure, and official exchange rate are 10.4%, 11%, 86%, and 992.9, respectively, with maximum rates of 31.1%, 18.3%, 94.5%, and 1915.
Table 2. Descriptive Statistics
Before estimating the equation, preliminary tests were performed, namely the stationarity test, the correlation matrix, and the granger causality test.
Table above shows that all variables expected for the official exchange rate are significant at 5%. Which means there are integrated at level I(0). As reported in the table, variables are integrated at different orders. Thus, to analyse the relationship between economic growth and the explanatory variables we must proceed with a cointegration test with an ARDL model.
Table 3. AUGMENTED DICKEY-FULLER UNIT-ROOT TEST
Table shows the correlation between variables in the model. The relationship between inflation and economic growth is negative, with a coefficient of −0.36. This relationship supports the statement by Akinsola and Odhiambo (Citation2017); Nas and Perry (Citation2018) that “inflation has a negative effect on growth”. Household consumption, official exchange rate and investment have a positive correlation with GDP growth. Household consumption and inflation have a negative correlation with the official exchange rate. This suggests that an increase in the level of the official exchange rate would reduce household consumption. However, all the coefficients are below 0.5 suggesting that there is no multicollinearity.
Table 4. Correlation matrix
To measure the linear causality between economic growth and inflation, a standard Granger causality test is performed. The test statistics in Table show that the null hypothesis is rejected at the 5% significance level, implying that inflation causes growth. This is also the case for the causality from growth to inflation. This implies that growth causes inflation. By these results, we conclude a bidirectional causality between growth and inflation. This means that the inflation-growth link is far from linear López-Villavicencio and Mignon (Citation2011).
Table 5. Granger Causality Tests
Before estimating the inflation threshold, we first tested for cointegration in the model.
1.4. Cointegration test with the ARDL model
There are several approaches to detecting long-term relationships between variables in the model. As an example, we mention a method based on the residuals by Engle and Yoo (Citation1987) and the one based on ordinary least squares procedures modified by Phillips and Hansen (Citation1990). For these cointegration techniques, the most important limitation is that all series have the same order of integration. In this paper, the cointegration test was performed using the auto-regressive distributed lag model (ARDL) developed by Pesaran et al. (Citation2001). In this study, the cointegration approach (ARDL) is applied because it has some advantages over other cointegration methods. Unlike other cointegration techniques, the ARDL method does not impose a restrictive assumption that the variables under study must be integrated of the same order. In other words, we can test for cointegration among the variables whether the variables in the regression are integrated of order one I(1) or of order zero I(0). Second, while other cointegration techniques are sensitive to sample size, the ARDL test is suitable even if the sample size is small. Third, the ARDL approach generally provides unbiased information, long-run model estimation, and valid statistics even when some of the variables in the regression are endogenous.
Lag selection is important for driving the ARDL model because this model is very sensitive to the choice of an optimal lag length. This study applied unrestricted vector autoregression (VAR) to estimate an appropriate model for understanding the relationship between inflation and economic growth in Burundi. The unrestricted VAR provides criteria such as the likelihood ratio (LR), Akaike information criterion (AIC), Schwarz information criterion (SC) and Hannan Quin information criterion (HQ). The results of all the criteria are presented in Table .
Table 6. Selection-order criteria
Table above shows that the optimal number of lags for the model is 4. However, due to the existing collinearity between the variables and their lags we chose to use a single lag for all the variables. Then, we proceed with the BOUND TEST. This test gives two critical values, one is the lower bound, and the other is the upper bound. The calculated F-statistic must be above the upper bound indicating that cointegration exists. Table presents the results of the bounds test.
Table 7. Bound test
The F-statistic is 4.869, which is above the lower critical value of 3.25 and the upper critical value of 5.06 at the 2.5% significant level. Thus, there is a long-run relationship between the dependent variable (GDP growth) and the explanatory variables. Next, we estimate the coefficients of the long-run relationship, which are the coefficients corresponding to the error correction model (ECM).
Table above gives the results of the cointegration test using the ARDL method. First, it presents the short-term estimate and then the long-term estimate, as well as the error correction term that reflects the speed of adjustment of the model. The short-term estimate shows that only inflation has a significant short-term relationship with GDP growth. The same short-run effect of inflation was found by Nyoni and Mutongi (Citation2019). But in the long run, only the inflation-economic growth relationship is insignificant. Investment has a negative and insignificant short-run relationship with GDP growth. This reflects the fact that the cost of investment penalizes growth in the short run. This relationship becomes positive and significant in the long run. This result shows that the positive effect of investment outweighs the negative effect in long-term Bakari and Tiba (Citation2022); Pokhrel and Khadka (Citation2019). Inflation has a negative and significant relationship with economic growth in the short run, which becomes not significant in the long run. In view of this immediate negative effect of the rise in prices on the economic growth of Burundi and considering the complexity of identifying the determinants of this inflation, it becomes essential for the monetary authority to determine the inflation threshold to adopt the better instruments in the execution of monetary policy.
Table 8. Cointegration test
Household consumption has a positive and significant long-run relationship with economic growth. This result is in line with Koyuncu and Safa (Citation2020) who investigated the long run relationship between household consumption and economic growth in Turkey from 1960 to 2018. He found that 1% rise in the GDP per capita results in a 1.2084% increase in the household consumption expenditure, which might lead to an expansion in the production in return. This finding on the effect of household consumption on economic growth is the same found by Ganchev and Todorov (Citation2021). In addition, for a country like Burundi, with very low-income levels, the government should adopt an expansionary budgetary policy directed towards the growth-promoting sectors mixed with wage harmonization to reduce the income gap and thus be able to take advantage of economic growth resulting from the growth of household consumption. Exchange rates have a positive and significant long-run relationship with economic growth. This result is in line with David (Citation2021) but in contradiction with Karahan (Citation2020). Moreover, this positive effect of the official exchange rate may be caused by an increase in prices that has caused nominal GDP to increase. This is very plausible for a country like Burundi, whose national currency continues to lose value and whose exports are in continuous decline.
Econometric theory suggests that if the variables are cointegrated, the errors are corrected by the error correction approach (ECM). The ECM can correct any imbalance that may arise from any shock in the system from one period to the next. The ECM value defines the speed of adjustment. The error correction term (ECT) derived from the error correction model is an important element in the dynamics of the cointegration system. The size and statistical significance of the error correction term measure the speed to which the dependent variable tends to recover its long-run equilibrium. The negative adjustment speed coefficient is reported in the (ECT) section in Table . Thus, the period required for the correction is approximately equal to [(1/0.786)*12 = 15.2] which is equivalent to almost 15 months.
1.5. Estimating the inflation threshold
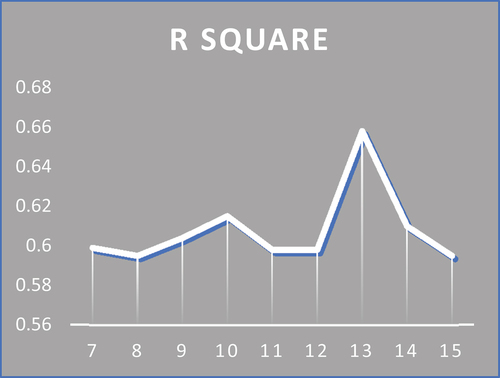
Table above shows the result of the estimation with the conditional least square model (CLS) for the inflation threshold in Burundi. The coefficient of determination (R-squared) is 0.65 at the threshold, which is quite low. This shows that there are other variables explaining growth that were not included in the model, especially because the main objective of this work is to study the relationship between inflation and economic growth. As mentioned before, with the CLS method, the threshold level is where the residuals sum of squares (RSS) is minimized with an R-squared that is maximal. This threshold is at 13%. When inflation is below this level its effect on growth is positive and insignificant at 0.073%.
Table 9. Estimation of eq 1 with the cls method (K threshold variable from 7 to 15)
This result reflects a general consensus in the literature that moderate inflation also contributes to the economic growth Lily et al. (Citation2021) Mubarik and Riazuddin (Citation2005). Above this threshold of 13%, the effect of inflation on growth is negative and significant at −3.7%. This means that any percentage point of inflation above 13% would reduce growth by 3.7%. This result supports the view of Akinsola and Odhiambo (Citation2017) Nas and Perry (Citation2018) S. Fischer and Modigliani (Citation1978) that inflation is harmful to growth when it is too high. In addition, the estimation of the optimal threshold level is also illustrated with CHART and . The results show that the optimal point minimizes the residual sum of squares and the one that maximizes the R-squared. The different inflation thresholds are on the horizontal axis. The different values of R-squared and RSS (residuals sum of squares) are on the y-axis.
Chart 1. The Evolution of the residual sum of square according to the level of inflation dummy variable
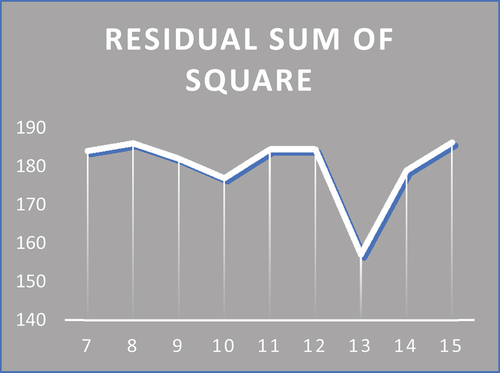
Chart 2. The evolution of the residual sum of square the R square according to the level of inflation dummy variable
In addition, diagnostic tests such as normality, stability, autocorrelation, heteroscedasticity, and multicollinearity were performed (See Appendix).
1.6. Robustness check
Most of the time the OLS estimator of regression is biased by endogeneity issues that happen when one or more explanatory variables are correlated with the error term. Such bias can also stem from omitted variables (specification bias) or from bidirectional causality. For example, there is a bidirectional causality between inflation and economic growth. In addition, many studies have confirmed that investment and economic growth are important determinants of each other. To handle this endogeneity, we applied the 2SLS (two stage least square) method. This approach uses lagged value of variables as instruments.
Table above shows that the results of the estimation of the model with the 2SLS method are consistent with those of the CLS estimation. We show in the table that the optimal inflation rate is always 13%, which is the same as the one found with the CLS method. But also, the effect of inflation on growth remained the same. Below the threshold of 13%, the effect of inflation is positive and not significant at up to 0.07%. Above the threshold, the effect is negative and significant at −3.7%. The result of the inflation threshold seems high, but some evidence shows that below 20% the effect of inflation on growth is debatable, but also that a country can achieve stable economic growth with a double digit inflation rate Burton and Fischer (Citation1998). Thus, it becomes paramount for monetary authority to determine the main sources of inflation. For structuralists like Watcher (Citation1976) the causes of inflation must be sought in the fundamental problems of economic development and in the structural characteristics of the production system of these developing countries. The effect on household consumption, investment and official exchange rates remained positive and significant.
Table 10. Two stage least square (2sls) estimation
In addition, this inflation threshold found for 13% is very close to the thresholds found in different studies for developing countries. Tarawalie and Kamara (Citation2022) with time-series data from 1980 to 2020 found an inflation threshold of 10.3% for Sierra Leone. Azam and Khan (Citation2020) with a panel of 27 countries found that inflation hinders growth when inflation exceeds the turning point of 12.23% for developing economies. Kelikume (Citation2018) using a dynamic panel threshold model for a panel of 41 African countries over a period from 1960 to 2015 found that inflation was beneficial to growth when it was below 12.5 percent. Mosikari and Eita (Citation2018) found 12% for Swaziland. Rutayisire (Citation2015) found an inflation threshold of 12.7% for Rwanda.
1.6.1. Conclusion
The main objective of this paper is to shed light on the relationship between inflation and economic growth in the short and long-run to allow monetary authorities to adopt the optimal policies to deal with shocks. This matter of optimizing monetary policies leads to the second objective of this paper, which is just as essential as the first, concerning the determination of an optimal inflation threshold to ensure whether the inflation ceiling as established by the EAC is optimal for Burundi but also to allow the Burundian monetary authority to adopt the right inflation target for the conduct of monetary policy. We used time series from 1990 to 2020, all from the WDI database (World Development Indicators).
First, in terms of assessment of inflation growth relationship in the short and long run, we proceeded with an ARDL model. Results found showed, on the one hand, that there is a significant negative relationship between inflation and growth in the short run, which becomes insignificant in the long run. Given the particularity of Burundian economy, materialized by high interest rate and high inflation rate, which is the completely opposed to the conventional view of economist on the relationship between inflation and interest; depreciation of the national currency; a continuous decline in the volume of exports with a large external balance deficit, we recommend to policy makers in order to deal with this negative effect of inflation on growth to coordinate the various policies, whether monetary, budgetary and fiscal, to correct and improve the structure of the production system, which is mainly the source of the rise in prices in the short term. On the other hand, investment, household consumption, and official exchange rate have positive and significant relationships with economic growth in long run. We recommend that policymakers adopt measures to improve the business climate by lowering interest rates and better communication on decisions taken related to economic policy to reduce uncertainty, but also by diversifying the tax base to reduce the burden of taxes on households and thus increase their consumption (or savings) and thereby increase the GDP.
Second in terms of inflation threshold, Conditional Least Square (CLS) and Two Stage Least Square (2SLS) were used. One for the determination of the threshold level and the other one for robustness check, respectively. The results found showed a threshold level of 13% above which inflation becomes harmful to economic growth with a coefficient of −3.7. This result means that a 1% increase in inflation rate above 13% decreases economic growth by 3.7%. In regards to the inflation threshold found in 13% which is above the inflation ceiling 8% set by the East African Community, Burundi, policy makers should avoid restraining inflation rate under 8% because this measure would present a shortfall for the Burundian economy. Thus, keeping inflation rate under 13% must be essential to reach a sustainable economic growth. Moreover, considering the rapid growth of the Burundian public debt in recent years and in regards to the fiscal theory of the price-level determination, which show that an increase in public debt have a positive and persistent effect on inflation, we recommend to fiscal authority to assess the sustainability of public debt to ensure solvency.
Disclosure statement
No potential conflict of interest was reported by the author.
Additional information
Notes on contributors

Jean Tony Ezako
Jean Tony Ezako, Burundian citizen, holder of a bachelor’s degree from the Faculty of Economics and Management of the University of BURUNDI. Moreover, I am passionate about economic research with the aim of contributing to the development of my country, Burundi, and developing countries in general. Thus, this paper on optimal inflation in Burundi is part of a research project consisting of 4 papers that I initiated to focus on the role of financial economics in the development process. The other 3 papers are ODA and TFP in developing countries in short and long run: public debt and economic growth relationship in Burundi: financial inclusion and non-performing loans in developing countries.
References
- Akinsola, F. A., & Odhiambo, N. M. (2017), ‘Inflation and economic growth: A review of the international literature’.
- Asaduzzaman, M. (2021). Relationship between threshold level of inflation and economic growth in Bangladesh: A multivariate quadratic regression analysis. Social Science Research Network Electronic Journal, %J Available at SSRN 3777880. https://doi.org/10.2139/ssrn.3777880.
- Aydın, C., Omer, E., & Metin, B. (2016). Inflation and economic growth: A dynamic panel threshold analysis for Turkish Republics in transition process, 229, 196–18.
- Azam, M., & Khan, S. (2020). Threshold effects in the relationship between inflation and economic growth: Further empirical evidence from the developed and developing world. %J International Journal of Finance, and Economics, 27(4), 4224–4243. https://doi.org/10.1002/ijfe.2368
- Bakari, S., & Tiba, S. (2022). Determinants of economic growth: The case of the United States of America. %J Journal of Developing Economies, 7(1), 29–44. https://doi.org/10.20473/jde.v7i1.34414
- Ball, R. J. (2017). Inflation and the Theory of Money. Routledge).
- Bawa, S., & Abdullahi Ismaila, S. (2012). Threshold effect of inflation on economic growth in Nigeria. %J CBN Journal of Applied Statistics, 3(1), 43–63.
- Behera, J., & Mishra, A. K. (2017). The recent inflation crisis and long-run economic growth in India: An empirical survey of threshold level of inflation. %J South Asian Journal of Macroeconomics, and FinancePublic, 6(1), 105–132. https://doi.org/10.1177/2277978717695154
- Benhabib, J., & Spiegel, M. M. (2009). Moderate inflation and the deflation–depression link. %J Journal of Money, Credit, andBanking, 41(4), 787–798. https://doi.org/10.1111/j.1538-4616.2009.00232.x
- Burton, D., & Fischer, S. (1998). Moderate Inflation: The Experience of Transition Economies (pp. 15–96).
- Cameron, N., Hum, D., & Simpson, W. (1996). Stylized facts and stylized illusions: Inflation and productivity revisited. %J Canadian Journal of Economics, 29(1), 152–162. https://doi.org/10.2307/136156
- C G F, V. (2003). Inflation and economic growth in the long run. %J Economics Letters, 80(2), 167–173. https://doi.org/10.1016/S0165-1765(03)00085-5
- Dammak, T. B., & Helali, K. (2017). Threshold effects on the relationship between inflation rate and economic growth in Tunisia. %J International Economic Journal, 31(2), 310–325. https://doi.org/10.1080/10168737.2017.1289546
- David, O. N. (2021). An econometrics analysis of the impact exchange rate on economic growth of Nigeria’. %J African Journal of Economics and Development, Sustainable, 4(3), 185–198. https://doi.org/10.52589/AJESD-EY7IWKD2
- Dinh, D. V. (2020). Optimal Inflation Threshold and Economic Growth: Ordinal Regression Model Analysis’. %J Journal of Asian Finance, Economics and Business, 7(5), 91–102. https://doi.org/10.13106/jafeb.2020.vol7.no5.091
- DorranceGraeme, S. (1966). Inflation and growth: The statistical evidence. %J Staff Papers, 13(1), 82–102. https://doi.org/10.2307/3866409
- Eggoh, J. C., & Khan, M. (2014). On the nonlinear relationship between inflation and economic growth. %J Research in Economics, 68(2), 133–143. https://doi.org/10.1016/j.rie.2014.01.001
- Ekinci, R., Tüzün, O., & Ceylan, F. (2020). The relationship between inflation and economic growth: Experiences of some inflation targeting countries. %J Financial Studies, 24(1 (87), 6–20.
- Engle, R. F., & Yoo, B. S. (1987). Forecasting and testing in co-integrated systems. %J Journal of Econometrics, 35(1), 143–159. https://doi.org/10.1016/0304-4076(87)90085-6
- Esen, O., et al. (2016), ‘Inflation threshold effect on economic growth in Turkey’, 7, 1983.
- Fei, C. J., Siok, K. S., & Mohd, T. I. (2019). Threshold effects of inflation on economic growth: Evidence from dynamic panel threshold regression analysis for 18 developed economies.
- Fischer, S. (1993). The role of macroeconomic factors in growth. %J Journal of Monetary Economics, 32(3), 485–512. https://doi.org/10.1016/0304-3932(93)90027-D
- Fischer, S., & Modigliani, F. (1978). Towards an understanding of the real effects and costs of inflation. %J Review of World Economics, 114(4), 810–833. https://doi.org/10.1007/BF02696381
- Friedman, M. (Ed.). (1971). The demand for money. In A Theoretical Framework for Monetary Analysis (NBER) (pp. 11–15). National Bureau of Economic Research.
- Ganchev, G., & Todorov, I. (2021). Taxation, government spending and economic growth: The case of Bulgaria. %J Journal of Tax Reform, 7(3), 255–266. https://doi.org/10.15826/jtr.2021.7.3.102
- Gebregergis, C. M., & Mekuria, A. G. (2016). Do Prices Influence Economic Growth?. University Library of Munich.
- Gokal, V., & Hanif, S. (2004). Relationship between inflation and economic growth. Economics Department, Reserve Bank of Fiji Suva).
- Hansen, B. (1996). Inference when a nuisance parameter is not identified under the null hypothesis. %J Econometrica: Journal of the Econometric Society, 64(2), 413–430. https://doi.org/10.2307/2171789
- Hansen, B. E. (1999). Threshold effects in non-dynamic panels: Estimation, testing, and inference. %J Journal of Econometrics, 93(2), 345–368. https://doi.org/10.1016/S0304-4076(99)00025-1
- Ibarra, R., & Trupkin, D. R. (2016). Reexamining the relationship between inflation and growth: Do institutions matter in developing countries? %J Economic Modelling, 52, 332–351. https://doi.org/10.1016/j.econmod.2015.09.011
- Jiranyakul, K., & Jiranyakul, K. (2017). Estimating the threshold level of inflation in Thailand. Journal of Economics Bibliography, 4(2), 150–155. https://doi.org/10.2139/ssrn.2984660
- Karahan, Ö. (2020). Influence of exchange rate on the economic growth in the Turkish economy. %J Financial Assets and Investing, 11(1), 21–34. https://doi.org/10.5817/FAI2020-1-2
- Kelikume, I. (2018). An estimation of inflation threshold for Africa. %J International Journal of Management, Economics and Sciences, Social, 7(4), 283–300. https://doi.org/10.32327/IJMESS/7.4.2018.18
- Khan, M. S., Senhadji, A. S., & Smith, B. D. %J Available at SSRN 879432. (2001), ‘Inflation and financial depth’.
- Koyuncu, C., & Safa, Ü. (2020). ‘The link between gdp and household consumption expenditures in the longrun in Turkey: ARDL Analysis. %J Balkan Ve Near Eastern Journal of Social Sciences, 6(1), 171–177.
- Kremer, S., Bick, A., NautzDieter, & Nautz, D. (2013). Inflation and growth: New evidence from a dynamic panel threshold analysis. %J Empirical Economics, 44(2), 861–878. https://doi.org/10.1007/s00181-012-0553-9
- Lily, J., & Mori, K. (2021). ASYMMETRIC EFFECT of REAL EXCHANGE RATES and OIL PRICES into INFLATION: EMPIRICAL EVIDENCE in ASEAN-5’. International journal of business and economy, 3(1), 60–74.
- López-Villavicencio, A., & Mignon, V. (2011). On the impact of inflation on output growth: Does the level of inflation matter? %J Journal of Macroeconomics, 33(3), 455–464. https://doi.org/10.1016/j.jmacro.2011.02.003
- Mohammad Hoomani, F., Ghabel Najjar, S., & Mohammadpour, R. A. (2020). The Effect of inflation threshold on financial development and economic growth: A case study of D-8 Countries. %J Iranian Economic Review, 25(3), 465–475.
- Mosikari, T. J., & Eita, J. H. (2018). Estimating threshold level of inflation in Swaziland: Inflation and growth.
- Mubarik, Y. A., & Riazuddin, R. (2005). Inflation and growth: An estimate of the threshold level of inflation in Pakistan. Citeseer).
- MukokaShame, & Mukoka, S. (2018). An econometric assessment of the impact of inflation on economic growth: A case study of Zimbabwe economy. %J Economics, 7(1), 17–22. https://doi.org/10.11648/j.eco.20180701.13
- Muzaffar, A. T., & Junankar, P. N. (2014). Inflation–growth relationship in selected Asian developing countries: Evidence from panel data. %J Journal of the Asia Pacific Economy, 19(4), 604–628. https://doi.org/10.1080/13547860.2014.920594
- Nas, T. F., & Perry, M. J. (Eds.) (2018). Turkish inflation and real output growth: 1963-2000’. In Inflation and disinflation in Turkey (pp. 145–160). Routledge.
- Ndoricimpa, A. (2017). Threshold effects of inflation on economic growth in Africa: Evidence from a dynamic panel threshold regression approach. %J African Development Bank Group, Working Paper, 29(3), 249. https://doi.org/10.1111/1467-8268.12282
- Nyoni, T., & Mutongi, C. (2019), ‘Modeling the long-run relationship between inflation and economic growth in Zimbabwe: A bi-variate cointegration (Engle-Granger Two-Step) approach’.
- Pesaran, M. H., Shin, Y., & Smith, R. J. (2001). Bounds testing approaches to the analysis of level relationships. %J Journal of Applied Econometrics, 16(3), 289–326. https://doi.org/10.1002/jae.616
- Phillips, P. C., & Hansen, B. E. (1990). Statistical inference in instrumental variables regression with I (1) processes. %J the Review of Economic Studies, 57(1), 99–125. https://doi.org/10.2307/2297545
- Pokhrel, S., & Khadka, C. B. (2019), ‘Assessment of Long and Short Run Relationship Amongst Macroeconomic Variables and Economic Growth of Nepal’.
- Rapach, D. E. (2003). International evidence on the long-run impact of inflation. %J Journal of Money, Credit and Banking, 35(1), 23–48. https://doi.org/10.1353/mcb.2003.0005
- Rasyid, M., Kristina, A., & PurwantiPutu, A. P. (2021). Optimal Price Level Under Slowing Economic Performance Using Simple Growth-Inflation Threshold Models. %J KnE, Social Sciences. https://doi.org/10.18502/kss.v5i8.9342
- Rutayisire, M. J. (2015), Threshold effects in the relationship between inflation and economic growth: Evidence from Rwanda ( African Economic Research consortium).
- Sidrauski, M. (1967). Inflation and economic growth. %J Journal of Political Economy, 75(6), 796–810. https://doi.org/10.1086/259360
- Tarawalie, A. B., & Kamara, F. (2022). Inflation and growth nexus: An estimate of the threshold level of inflation in Sierra Leone. %J Applied Economics, and Finance, 9(2), 70–78. https://doi.org/10.11114/aef.v9i2.5553
- Tenaw, D., & Demeke, H. (2020), ‘Inflation threshold effects on growth in Ethiopia: Evidence from food and non-food sectors’.
- Thanh, S. D. (2015). Threshold effects of inflation on growth in the ASEAN-5 countries: A panel smooth transition regression approach. %J Journal of Economics, Finance andScienceadministrative, 20(38), 41–48. https://doi.org/10.1016/j.jefas.2015.01.003
- Wai, U. T. (1959). The relation between inflation and economic development: A statistical inductive study. %J Staff Papers, 7(2), 302–317. https://doi.org/10.2307/3866244
- Watcher, S. (1976). Latin American Inflation: The Structuralist Monetarist Debate (pp. 409). Lexington books.
