
 ?Mathematical formulae have been encoded as MathML and are displayed in this HTML version using MathJax in order to improve their display. Uncheck the box to turn MathJax off. This feature requires Javascript. Click on a formula to zoom.
Abstract
This study explores the nexus among government revenue, government expenditure, and gross domestic product (GDP) across time and/or frequency using a Ghana dataset. It applies the wavelet approaches to investigate the lead-lag nexus, degree of integration and interdependency among public expenditure, public revenue, and gross domestic product (GDP) in the Ghanaian context. The data source is the World Bank and consists of yearly data from 1983 to 2021 yielding 39 observations. While public expenditure and revenue are closely related, and mostly positive throughout both time and frequency, there is a nexus between public spending and revenue at specific intervals and on a regular basis that was bi-directional, bi-causal, and interdependent. Between 1993 and 2021, a bi-directional nexus could be seen; however, most of the arrows pointed to the right. This shows that the co-movements between public spending and revenue are positive and behave similarly as a result. Accordingly, it is anticipated that increased levels of public spending will be met by higher levels of public spending, and vice versa. This is the first application of a wavelet approach to the study of this phenomenon with a Ghana dataset.
1. Introduction
The relationship between government revenue and expenditure has attracted empirical and policy interest, due to its relevance to public economics (Gurdal et al., Citation2021; Karlsson, Citation2020), the desire to identify avenues for budget and deficit control, and the revelation of severe vulnerabilities to and pressure on the economies of poor and transitioning countries when a global crisis such as the COVID-19 pandemic occurs. Due to this, fiscal policy has gained critical scholarly interest. The scholarly interest in the “revenue-expenditure” nexus is because it impacts budgetary policies, affecting effective and sustainable fiscal policy (Brady & Magazzino, Citation2019).
Currently, studies about the “revenue-expenditure” nexus do not adequately explore nations that have transitioned from centrally planned economies, and political instability to market-oriented economies and democracy. The study’s relevance is also justified by the mixed and often contradictory findings, vis-à-vis the importance of sound theories about this phenomenon to guide policy debates. Tashevska et al. (Citation2020) express worry about the inconclusive and different findings concerning the validated hypothesis about this nexus even for the same country, attributing it to sensitivity to the period analyzed, the econometric approach, the degree of temporal aggregation, and the inclusion of control variables. Impliedly, the findings have been impacted by method choices.
The level of borrowing and status of public debt (to fund government expenditure) in Ghana has come under scrutiny in recent times (IMF, Citation2022, Poku et al., Citation2022). The economy of Ghana is currently reeling under economic pressure from a downgrade of its bonds to junk status with a consequential lack of access to the international financial market. There is consensus about the contribution of the continuous year-on-year widening fiscal deficits to this economic despondency. However, there is a stack rift between the government and the IMF, on the one hand, and civil society organizations, on the other hand, about the effective approach to sustainably resolve the perennial fiscal deficit challenges, to set a path to fiscal consolidation aimed at restoring credibility in the management of public finances (Narayan & Narayan, Citation2006; Nketiah-Amponsah, Citation2009). The government’s approach, as announced in the 2023 national budget, has been to significantly increase taxation in a bid to raise more revenue, while also announcing significant increases in government expenditure. Most civil society organizations have suggested the alternative approach of an interim reduction in government expenditure, rather than the massive tax revenue measures announced.
Quite clearly, this debate will benefit from an empirical exploration that uses a Ghana dataset. Payne (Citation2003) reiterates this by suggesting that for countries with perennial fiscal deficits, it is crucial to have a clear understanding of how the relationship between revenue and expenditure impacts the correction of fiscal imbalances to achieve budget deficit targets. Indeed, there is clear evidence about how different variables such as bad governance and corruption impact revenue and expenditure (Dankumo et al., Citation2021). Yet it is unclear how revenue and expenditure relate in the case of Ghana across time and frequency. Linhares et al. (Citation2021), Karlsson (Citation2020) and Li (Citation2001) confirm that institutional and structural rigidities have a bearing on the relationship between government revenue and expenditure. Considering the empirical confirmation of a unique set of institutional and structural rigidities faced by African countries, underpinned by a complex web of variables including international geopolitics, national characteristics and culture, country-specific studies about this phenomenon may be helpful in economic policy decisions in this regard. Hopper (Citation2017) for instance, broadly categorizes the set of variables that introduce rigidities into the economic transition of African countries as neopatrimonialism. It is logical therefore to estimate that the country-specific causality factors for Ghana may differ from other economies.
This overarching objective of this study is to explore the nature of the interconnectedness between government revenue and expenditure using a Ghana dataset. In the process, it aims to (a) identify the direction of temporal causality between revenues and expenditure and evaluate its implication for fiscal consolidation across time and frequency, (b) examine the partial influence of gross domestic product (GDP) as a common interdependence on the nexus between revenues and expenditure to deal with business cycle issues across time and frequency, (c) explore the degree of integration and interdependency among revenues, expenditure, and GDP simultaneously to provide a complete picture of the nexus at intrinsic times of short-term and long-term, and (d) explore whether and how the “revenue-expenditure” nexus changes or evolves over time. To the best of our knowledge, no study has explored this phenomenon using a Ghana dataset with a wavelet approach.
The study makes several contributions. Firstly, the dataset contributes to an understanding of how the relationship between government revenue and expenditure evolves, characterizes, or propels the economies of countries that have transitioned from planned economies to market-oriented economies. The literature on this is scant. To be clear, Ghana is of research interest because it has undergone significant economic, institutional, political, and fiscal changes over the relevant period of the study. This is an unusual characteristic of countries usually used in studies about this phenomenon. For instance, Ghana’s hereto background is a centrally planned economy with political instability before transitioning to a market-oriented economy and democracy. Due to this, Ghana’s economy is still largely informal, underpinned by massive tax evasion, public sector inefficiency, and higher-than-normal corruption. Such economies have not featured prominently in studies about the “revenue-expenditure nexus” because of previous constraints regarding reliable “time series data of sufficient frequency and adequate quality” (Tashevska et al., Citation2020; p1). Moreover, the transition to a market-oriented economy has required massive fiscal and institutional reforms distinguishing Ghana from countries often found in studies about the revenue-expenditure nexus.
Another contribution is that the wavelet approach improves the robustness (Percival & Walden, Citation2000) of the results and hence may help in achieving the required critical mass and empirical consistency necessary for theorization. Wavelet analysis conducts an estimation of the spectrum characteristics of a time series as a function of time, thereby revealing how periodic components change over time. It allows for the identification of possible breaks in each period and frequency and can also be applied to non-stationary series (or signals) and data with structural breaks. The decomposition of time scales can be more useful than an ambiguous categorization of time scales into short and infinitely long long-term relationships (as per cointegration methods). This advantage of wavelet analysis in decomposing a series into different time scales improves robustness and decision usefulness (Almasri & Shukur, Citation2003; Hacker et al., Citation2014; Percival & Walden, Citation2000; Ramsey & Lampart, Citation1998).
Lastly, even though the mechanism through which economic, institutional, structural, political, and cultural factors impact fiscal policy is complex (Linhares et al., Citation2021) and beyond the scope of this study, the time-variant approach amenable to a wavelet analysis allows for establishing a chronological relation between key national and international events and the changes observed in the “revenue-expenditure” nexus. In that way it may provide an impetus for further studies about how the iterated factors impact fiscal policy developments.
A synthesis of existing literature leads to two broad categorisations of studies of this phenomenon. The first categorisation relates to the directional impact of one variable on another. Friedman (Citation1978) advances the tax-and-spend hypothesis arguing that revenue causes expenditure such that increasing tax revenues leads to more spending (Richter & Paparas, Citation2013). Peacock and Wiseman (Citation1961, Citation1979) support the spend-and-tax hypothesis, suggesting that expenditure causes revenue, especially during national crises. The premise for this hypothesis is that such a severe crisis can affect public attitudes about the size of the government. When such a favourable view of large government sizes occurs, the resulting increases in taxes initially justified by the crisis become permanent tax policies. Another subgroup under this categorisation is the “fiscal synchronisation hypothesis”, which implies that governments can vary expenditure and taxes concurrently (Meltzer & Richard, Citation1981). The last variant which is the institutional separation hypothesis suggests that the decision on government revenue and expenditure should be made independently of each other (Baghestani & McNown, Citation1994) as there is no significant impact of one variable on the other.
The second broad categorisation of studies relates to the methodological approach adopted. One set of studies applies traditional econometric techniques (Provopoulos & Zambaras, Citation1991) based on vector autoregression (VAR) models. Another set of studies use modern econometrics techniques (Kollias & Makrydakis, Citation2000) based on cointegration and error correction models. The techniques mostly applied are unit roots and cointegration, causality and error correction models (ECM) based on time series, and panel analysis. These methods have been used to analyse the acceptance of either one hypothesis or another in countries with different levels of development and degrees of deficit and debt (Jaén-García, Citation2020). While a sizeable number of studies apply the above-mentioned time-invariant (i.e., without limits to time) techniques to study the “revenue-expenditure” nexus, these methods are constrained in their ability to model the impact of dynamic strategies applied at different points in time to manage public finances. They are also limited in their ability to explore the possibility of change in trajectories for variables of interest in a singular estimation.
The link between revenue and expenditure and the trajectory therefore may turn in response to economic, political, business cycles, etc. This is because, in reality, changes are constantly taking place in the co-movements between economic variables at various times and frequencies, and in a manner that can impact and vary economic interconnectedness. Karlsson (Citation2020) for instance confirms, with a China dataset, that the four directions of causalities between revenue and expenditure have associations with different time horizons. Wavelet analysis emerges as an alternative to previously applied Fourier analysis. Wavelet analysis has advantages over the traditional error correction model and cointegration for studying short and long-run relationships. First, it avoids the loss of crucial variable information from using first differences to make a nonstationary series stationary. Second, it specifies time scales associated with changes instead of an ambiguous dichotomy into short and infinitely-long long-term
The remainder of the paper is organised as follows: Section two discusses the four hypotheses related to the “revenue-expenditure” nexus and a brief review of the literature, while Section three introduces wavelet methodology. This is followed by a section about the empirical analysis and the conclusions.
2. Literature review
In the literature, several hypotheses have been used to explain the intertemporal relationship in the “revenue—expenditure” nexus (Saunoris, Citation2015). Even though sovereign entities (Musgrave, Citation1985), make revenue and expenditure decisions simultaneously and continually (Koren & Stiassny, Citation1998) to maximize intertemporal social welfare, it does not necessarily imply a balanced budget. This is because the macroeconomic aggregates that underpin revenue and expenditure usually have different time profiles.
2.1. Tax and spend hypothesis
This suggests a unidirectional causality from revenue to expenditure, wCitation1985hich can be positive or negative. Friedman (Citation1978) suggests a positive unidirectional relationship where changes in expenditure are driven by current and past revenues. Impliedly, a strategy to raise taxes to reduce a fiscal deficit is likely to fail because the resulting higher government revenue will only encourage more government expenditure (Friedman, Citation1978). Cheng (Citation1999) is quick to suggest that while the relationship is clearer in the case of higher revenue, it may not necessarily translate to a postulation that lower revenues lead to low expenditure, because governments may decide to opt for debt financing. Based on this hypothesis, a reduction in expenditure is a more robust strategy for achieving budget deficit targets.
Wagner (Citation1977) and later Young (Citation2009) contest this “starving the beast” strategy (Romer and Romer, Citation2009) suggesting a negative unidirectional relationship as a result of fiscal illusion. In their view, public spending can be financed through direct taxation, debt, and indirect taxation (i.e., inflation). Direct tax increases result in lower government expenditure because direct taxation increases the perceived cost of government programs to citizens. That way citizens will reduce their requests for government programs including the propensity for further consumption growth. Expenditure that is financed other than through direct taxation has the same impact, even though it may initially lead to a perception that the cost of public spending is less than it would be with direct taxation. Specifically, although taxpayers may pay less through direct taxation, a fiscal illusion emerges because borrowing leads to higher interest rate, a form of indirect tax. This substitution effect occurs within the economy and the resulting inflation creates shifts in tax brackets. Therefore, the optimum level of revenue to finance an expenditure depends on the relative costs associated with the revenue initiative. A rise in direct taxes may cause a decrease in public expenditure if options for indirect taxation are constrained, either through debt or tax bracket shifts. Conversely, a decrease in revenues could lead to spending growth when consumers demand more spending programmes. Yinusa et al. (Citation2017) test the relationship between taxes and expenditures with a Nigerian dataset from 1981 to 2014. The study applied the asymmetric cointegration test using the TAR and MTAR models and find confirmation for the tax and spend hypothesis.
2.2. Spend-and- tax hypothesis
This hypothesis suggests a unidirectional causality from expenditures to revenues where changes in revenues are driven by current and/or past expenditures. In such a case, government adjustments to revenue schemes are based on government expenditure plans. In the long run, this could lead to higher expectations for tax growth and to capital outflow (Richter & Paparas, Citation2013). Roberts (Citation1987) and Peacock and Wiseman (Citation1979) explain that a temporary increase in government expenditures during an economic downturn results in a permanent increase in taxes in line with the displacement effect hypothesis.
Barro (Citation1979) counters the fiscal illusion hypothesis and argues that the ultimate source(s) of government expenditures are higher future taxes, due to the Ricardian equivalence hypothesis. Based on the Ricardian equivalence theory, increases in public spending result in tax increases because whatever government spends impacts future tax obligations. This type of tax rise can occur in parallel to public spending growth, or there may be a delay between the two. Therefore, reduced government expenditure leads to decreases in deficit, meaning that deficit control can be achieved through unforeseen increases in fiscal pressure or strict legal limits on public spending levels (Jaén-García, Citation2019). Studies by Carneiro et al. (Citation2004), Lojanica (Citation2015), Reddick (Citation2002), Saunoris and Payne (Citation2010), Zapf and Payne (Citation2009), and Kazungu (Citation2019) confirm the spend and tax hypothesis.
2.3. Fiscal synchronization hypothesis
This suggests a bidirectional causality (a feedback mechanism) between revenue and expenditure (Meltzer & Richard, Citation1981; Musgrave, Citation1966). Revenue and expenditure decisions are made jointly because voters compare the marginal benefits and marginal costs of government services. Fiscal policy considerations must therefore make decisions on government revenues and expenditures simultaneously. Al-Zeaud (Citation2012), Baharumshah et al. (Citation2016), Hasan and Lincoln (Citation1997), Mehrara et al. (Citation2011), Miller and Russek (Citation1990), Ewing and Payne (Citation1998), and Vamvoukas (Citation2012) confirm a mutual causal relationship underpinned by a financial cohesion hypothesis. Turan and Karakas (Citation2018) test how noninterest revenues relate to noninterest government expenses in Turkey, with a dataset spanning 1998–2016. The results from their study confirm the fiscal synchronization hypothesis. Specifically, a positive shock in noninterest expenditures increases revenues in the long term, while a positive (negative) shock in revenues leads to an increase (decrease) in said expenditures. Irandoust (Citation2018) find similar evidence of a bidirectional causal relationship for Sweden between 1722 and 2011.
2.4. Institutional separation hypothesis
The institutional separation or fiscal independence hypothesis (Baghestani & McNown, Citation1994; Wildavsky, Citation1988), argues that decisions on revenues and expenditures are made separately and independently and do not significantly impact each other. Wolde‐rufael (Citation2008) explains that fiscal neutrality could be due to the disagreement among different groups involved in the budgetary process. Obeng (Citation2015), explains that this continual economic growth allows for the long-term possibility of fragmented institutions that are independent. In that case, decisions on revenue and spending can be made separately. Baghestani and McNown (Citation1994), suggests that expenditure is determined by the requirements of citizens, and revenue depends on the maximum amount of taxes that citizens are willing to bear. Consequently, fiscal balance is a mere coincidence. Linhares et al. (Citation2021) contest this hypothesis, arguing that there are several reasons for establishing interporal links between revenue and expenditure.
Studies using USA dataset by Akçağlayan and Kayıran (Citation2010), Chang et al. (Citation2002), Kollias and Makrydakis (Citation2000) Baghestani and McNown (Citation1994) confirm expenditure and income decisions are independent from each other, perhaps offering a partial confirmation that the institutional separation hypothesis is more amenable to mature developed economies.
In summary, while the first three hypotheses suggest an interdependence between revenue and expenditure, the institutional separation hypothesis suggests an independent relationship between revenue and expenditure. Earlier studies emerged in the 1980s about the “revenue-expenditure” nexus using datasets from advanced economies specifically from the USA largely due to rising deficits in such economies at the time (Linhares et al., Citation2021). Owoye (Citation1995) for instance used error correction models (ECM) to study this phenomenon among G7 countries and confirmed a bidirectional causality among all the countries except Japan and Italy. Japan and Italy had a unidirectional causality from revenue to expenditure. Koren and Stiassny (Citation1998) studied selected European countries between 1956 and 1992 and confirmed the Tax and Spend hypothesis for Germany, the UK, the USA, and the Netherlands; the Spend and Tax hypothesis in Austria, France, and Italy and Institutional separation in Sweden and Switzerland. Unfortunately, their study did not adduce reasons for these differences.
Phiri (Citation2017) summarizes the relevant studies about this phenomenon, the methods adopted and the key findings. Subsequent studies beyond their tabulation have shown a similar trajectory of mixed results and diverse methods that are mostly time invariant. A few studies that have tested changes in the “revenue-expenditure” nexus such as Mounts and Sowell (Citation1995) have been based on exogenously pre-determined break dates rather than letting the data determine whether and when there is a variation in causality (Linhares et al., Citation2021). Linhares et al. (Citation2021) correct for this constraint and apply Shi et al. (Citation2018, Citation2020) causality test. Yet they suggest the application of other dynamic methods to build a critical mass of findings necessary for theorization.
It appears that the literature cited above implicitly treats the fiscal regime as constant (Lucas, Citation1997). Infact, except for Barro (Citation1986) and Baghestani and McNown (Citation1994), consideration of changes in institutional fiscal relationships (the budget regime or process) has been largely absent in the budget and debt literature (Mounts & Sowell, Citation1995).
2.5. Tax revenue‒economic growth studies
The empirical studies about the relationship between tax revenues and economic growth are without a consensus. The ongoing debate is underpinned by two theoretical philosophies. Blinder and Solow’s (Citation1976) had earlier proposed models underpinned by neoclassical theories that hypothesize that tax policy will not affect economic growth. Romer’s (Citation1986) endogenous growth theory contested this hypothesis. Even though there is growing empirical support for the impact of tax policy on economic growth through its effect on new investment, entrepreneurial incentives, and skills acquisition (Solow, Citation1956) the direction of the impact is not clear. Even still, some scholars suggest no relationship between tax and economic growth.
Engen and Skinner (Citation1992) propose several ways in which the tax impacts economic growth. First, higher taxes may disincentivize capital investment investments in R&D, create unintended allocation problems and deadweight losses. Specific taxes on corporate and individual incomes as well as on gifts and capital gains can lead to a reduction in the net growth in capital stock. Additionally, taxes can constrain labour’s willingness to work (in certain occupations) or acquire new skills and training. Alternatively, lower taxes can affect contributions to capital formation, social equity, and distributional justice through their impact on government expenditure. Castles and Dowrick (Citation1990) and Agell et al. (Citation1997) take this argument further to suggest that the impact of tax revenue on economic growth through its impact on government expenditure is not absolute and depends on what the government spends on. Akanbi et al. (Citation2019) suggest, that capital expenditures, compared to current expenditures, have a higher chance of impacting economic growth positively.
Takumah (Citation2014), applied a VAR framework to examine the effect of tax revenue on economic growth in Ghana using quarterly data for 1986 to 2010. His study confirmed that tax revenue impacts economic growth in the short and long runs. Gurdal et al.’s (Citation2020) study perhaps provides partial evidence that the quantitative method applied can impact the empirical findings about this phenomenon. Gurdal et al. (Citation2020) applied two approaches to testing panel causality on an annual dataset from 1980 to 2016 in exploring the relationship between tax revenue, government expenditure, and economic growth for the G7 countries (Canada, France, Germany, Italy, Japan, UK, and the USA). The time domain panel causality test confirmed a bidirectional causality between economic growth and government expenditure, a unidirectional causality between tax revenue and government expenditure and no causal relationship between economic growth and tax revenue. The frequency domain causality approach suggested a bidirectional short- and long-run causality between economic growth and tax revenue and a long-run causality between economic growth and government expenditure.
Other studies have explored the nature of the unidirectional impact of tax revenue on economic growth. For instance, Lee and Gordon (Citation2005), Mamatzakis (Citation2005), Saqib et al. (Citation2014), Taha et al. (Citation2011), Widmalm (Citation2001), Zeng and Du (Citation2003), and Amri et al. (Citation2019) confirm that the impact of taxation on economic growth is negative. Anastassiou and Dritsaki (Citation2005), Lee and Gordon (Citation2005), Ray et al. (Citation2012), Tosun and Abizadeh (Citation2005), Egbunike et al. (Citation2018), Aydin and Esen (Citation2019a), and Eneche and Stephen (Citation2021) however confirm a positive impact of taxes on economic growth. Mendoza et al. (Citation1997) study is among a few that suggest that the impact of changes in tax rates on economic growth does not extend into the long term. Gale et al. (Citation2017) also suggest that tax revenue does not have a significant impact on economic growth because any directional impact is reversed in subsequent periods.
Amin et al. (Citation2018) study has contested Mendoza et al. (Citation1997) study with data for Pakistan and China between 1986 and 2015. Ami et al. find a positive relationship between personal income tax and economic growth for both countries in the long term. Ojede and Yamarik (Citation2012) approached their study from a different perspective, investigating the effects of state and local tax policies on economic growth in the USA using the pooled group estimator approach. They find that real estate taxes affect both short- and long-term economic growth negatively and that sales taxes affect economic growth in the long term, whereas income taxes do not affect economic growth in the short or long term. Non-linear effects of fiscal policy on the economic growth hypothesis proposed by Barro (Citation1990) and Scully (Citation1996, Citation2003) takes this further by suggesting that through appropriate modelling, governments can pre-determine the tax threshold that can achieve a desirable level of economic growth. Some studies disaggregate the government revenue in their analysis. Olayungbo and Olayemi (Citation2018) for instance use a dataset from 1981 to 2015 to confirm that nonoil revenue has a positive effect on economic growth.
2.6. Government expenditures‒economic growth studies
Perceived and actual failures of market mechanisms to self-correct and appropriately allocate scarce resources in a manner that focuses on citizens priorities, long-term sustenance, and welfare (Okoye, Citation2019) as well as an optimum level of distributive justice have made government expenditure topical. There seems to be an emerging consensus that strategies about the nature, timing, and amount of public expenditure can propel or constrain economic growth. This perhaps explains why European institutions now encourage their members to change the composition of public expenditure by increasing “productive spending” (that is spending on education, research and development, public investment) to propel sustainable and inclusive growth (Lupu et al., Citation2018). Onifade et al. (Citation2020) and later Poku et al. (Citation2022) are not convinced that the monumental increase in public expenditure among African countries has translated into the desired levels and nature of economic growth. Aydin and Esen (Citation2019a), Afonso and Ibraimo (Citation2020) and Alshammary et al. (Citation2022) seem to suggest that there is an optimal size of government and hence government expenditure beyond which further expenditure can have a deteriorating impact on welfare indices and economic growth. Particularly when the size of government is excessively large, corruption and rent seeking behaviour becomes pervasive. Lupu and Asandului (Citation2017) applied the Armey curve to determine optimal levels of government expenditure for eight eastern European countries. Aluthge et al. (Citation2021) take this further to suggest that the state of the economy can determine the impact of government expenditure on economic growth. Specifically, government expenditures are significant growth propellers during periods of a recession.
Competing economic philosophies and hypotheses from Wanger and Keynes have bedrocked studies about the impact of government expenditure on economic growth. Wagner suggests that economic growth raises government expenditure, while Keynes believes that government expenditure drives economic growth (Aydin & Esen, Citation2019b). Substantively Wagner’s organic theory aided by the Peacock-Wiseman hypothesis proposes public expenditure as an endogenous variable to growth, while the Keynesian hypothesis suggests government expenditure as an exogenous policy instrument to influence economic growth. Studies such as Levitt and Joyce (Citation1987), Abizadeh and Yousefi (Citation1998), Odhiambo (Citation2015), Williams and Abere (Citation2019), Chirwa and Odhiambo (Citation2019) confirm the Wanger preposition, while studies such as Karagianni et al. (Citation2019), Okere et al. (Citation2019), Rasaily and Paudel (Citation2019), Sedrakyan and Varela-Candamio (Citation2019) confirm the Keynesian preposition.
Neoclassical public expenditure theorists complicate the debate further with their insistence that, whatever the impact, government interventions in the market system should be minimal (Wang & Wen, Citation2019) to sustain growth in the long run. Therefore, while there is some emerging consensus of a relationship between public expenditure and economic growth, the direction and nature of the relationship remains unclear, especially in the long run. Public sector expenditure on economic growth is indirect but can serve as a stimulus to economic growth. Olayungbo and Olayemi (Citation2018) and Bose et al. (Citation2007) are convinced that any impact of public expenditure on economic growth is indirect through its impact on the marginal productivity of public and privately owned factors of production.
Odhiambo (Citation2015) confirm, with an ARDL method, that in South Africa a bidirectional relationship exists between government expenditure and economic growth in the short term, but government expenditure did not impact economic growth in the long term. Ajayi and Aluko (Citation2016) use data for 1985‒2014, to examine the nexus of government expenditure and economic growth in Nigeria. They deployed the Toda-Yamamoto causality test in their analysis and found no evidence of a substantive relationship between the two variables. Lupu and Asandului (Citation2017) use ARDL methods to study this phenomenon for eight eastern European countries, with a dataset from 1995 to 2014. They find evidence of a long-term integrated relationship between the variables in all countries. Olayungbo and Olayemi (Citation2018) use a dataset from 1981 to 2015 to confirm that government spending has a negative impact on economic growth in the short and long-run. Nyarko-Asomani et al. (Citation2019) unpack public expenditure in their study that uses a Ghana dataset from 1980 to 2017 and adopt the Stock-Watson Dynamic OLS estimation. They confirm that whereas capital expenditure is growth-enhancing, non-interest and interest-payments recurrent expenditures are not. Akanbi et al. (Citation2019) also disaggregates public expenditure with a Nigerian dataset from 1981 to 2015, adopting a VECM approach. They find that in the long-run, government agriculture expenditure influences economic growth. Additionally, in the short-run, government agricultural spending and agricultural output are positive and significantly related to economic growth. Barlas (Citation2020) also evaluates the influence of government expenditure on economic growth in Afghanistan, with data spanning 2004 to 2019, and an autoregressive distributed (ARDL) lag approach. The findings suggest that government expenditure is negatively associated with economic growth. Ibrahim (Citation2019) unpacks both public expenditure and nature and source of economic growth and applies a Vector Autoregression approach to examine the relationship between government expenditure and non-oil economic growth in the UAE. An increase in the current and development public expenditure increases non-oil economic growth. Poku et al. (Citation2022) propose that variations in findings about the impact of fiscal policy measures can be a result of peculiarity in fiscal reforms implemented over a period by specific countries.
From the reviews conducted so far there is enough evidence to suggest that the nexus between government expenditure and revenue is dynamic. Hence, the four hypotheses found in the literature may alternate across time and frequency. The vast literature reviewed utilized techniques that are devoid of calendar time and/or frequency domain(s). In this manner, we noticed some gaps that need to be filled as a way of highlighting the novelty and the value of the work performed based on the literature reviewed. It was ascertained that a study that explores the interconnectedness between spending and revenue across economic events through time and frequency in the Ghanaian setting is missing. Also, due to the pertinent role of the real economy, the conditional influence of economic growth in the co-movements between spending and revenue across time and frequency is timely, but less empirically discussed. Moreover, considering the fact that integration levels do not operate in isolation (Asafo-Adjei et al., Citation2022), the degree of integration and interdependencies among spending, revenue, and economic growth simultaneously are not considered.
Hence, we offer a unique contribution to the literature by assessing the causality and degree of integration between public revenues and public expenditure to evaluate the heterogeneity behind the formation of budget deficits amidst the real economy in the Ghanaian setting, by employing four main wavelet approaches. First, we answer questions relating to causality between public expenditure and public revenue across time and frequency through the bi-wavelet. Second, we examine the conditional influence of GDP as a common interdependence between public expenditure and public revenue across time and frequency to avoid the effects of non-policy decisions and respond to business cycle impacts with the help of the partial wavelet. Third, the extent of integration among the economic indicators is simultaneously determined in the short-term and medium-term through the wavelet multiple-correlation approach. Fourth, to find out the averaged lead-lag nexus among the indicators in the short term and long term, the wavelet multiple cross-correlation is specifically utilized.
2.7. Key events in the economic and fiscal revolution of Ghana
The current and future economic development of Ghana is underpinned by a complex set of past economic and political events (Leith & Söderling, Citation2000) culminating in a major reform program in 1983. Prior to this, Nkrumah’s (1951–1966) administration, immediately after colonial rule, was predominantly a centrally planned socialist economy (e.g., a fixed exchange rate regime) and characterized by an overly ambitious government expenditure program that pushed the budget deficit to over 6% of GDP. Ghana drew down on substantial foreign exchange reserves (by the end of 1966 net foreign assets in the monetary system were negative), in addition to incurring significant foreign debt, in part for major development projects, but in part as suppliers’ credits financing current purchases.
This was followed by a military coup led by the National Liberation Movement (NLC) characterized by a brief period of resetting economic policies (1966–1969). The NLC reduced total government spending in its first year mainly through a reduction in capital expenditure with an attendant impact on the gross investment-to-GDP ratio. They were successful in renegotiating a restructuring of Ghana’s short-term debt to reduce budgetary pressures. The period was also characterized by a devaluation of the currency and a significant reduction in government revenue, allowing the overall government budget deficit, to continue to run more than 5% of GDP until 1969 when the deficit was reduced to 3.3% of GDP.
Governance returned to a democratically elected Busia in 1969–1971. Busia’s regime experimented with market-oriented policies including an underwhelming import liberalization strategy. The precarious political balance that characterized this period was heightened by the perceived targeting of persons from certain tribes including the expulsion of large numbers of aliens in 1969 (See Austin, Citation1976). The excruciating budget deficits continued returning to 1969’s rate in 1971.
Busia’s government was interrupted by another military coup with severe and precarious economic impact (1972–1979) of galloping inflation and depressing real incomes. Junior military officers briefly took over the reins of power (1979), handing over to an elected Liman government (1979–1981). Liman's government was again overthrown by the junior military (PNDC) ranks (1982) leading to an economic reform program in 1983, which preceded the democratic experiment re-initiated in 1992.
The PNDC launched a market-oriented reform in the April 1983 budget dubbed the Economic Reform Program (ERP)Footnote1 as part of a Structural Adjustment Programme. This was with the support of the IMF and the World Bank. ERP aimed at freeing up markets and eliminating the government's budget deficit. The ERP abandoned the rationing system in favor of a market-based system. This reduced the pressure on government expenditure. Unfortunately, several politically sensitive and administratively complex reforms remained incomplete before the return to electoral competition in 1992. This included reforms to, the cocoa sector, state-owned enterprises, and, critically, tax collection and expenditure control systems. This made the economic reforms vulnerable to the vagaries of electoral competition, compared to an authoritarian government (Leith & Söderling, Citation2000). The ERP has made considerable progress in reducing macroeconomic imbalances and liberalizing the external sector. Inflation was lowered from 142% in 1983 to 10% by the end of 1991. The highly distorted exchange and trade system was also liberalized, with a massive surplus in the balance of payments sizable throughout the period. Real GDP growth averaged about 5% a year, resulting in appreciable increases in real per capita incomes (IMFFootnote2). Despite this, the damage from the rent seeking behavior of the previous regimes, coupled with the earlier populist phase of the PNDC, had inflicted on the economy with adverse consequences for many ensuing years (Leith & Söderling, Citation2000).
The following table provides an itemization of critical activities that have impacted government revenue and expenditure action during the study period.
3. Methodology
3.1. Data sources and description
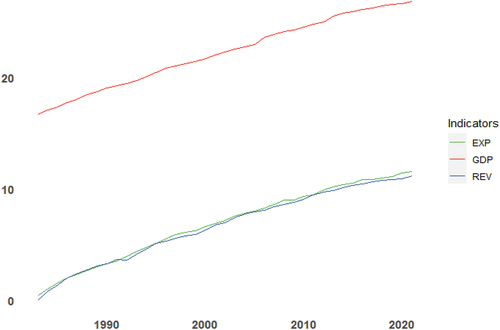
The study employs yearly data on public expenditure, public revenue and gross domestic product, which spans 1983 to 2021 yielding 39 observations. The chosen data is gleaned from the World Bank databank. The selected data span is based on data availability. The sample period is long enough to welcome economic events and other crises that influenced the Ghanaian economy such as the 1983 drought in Ghana, the 2008 Global Financial crisis, rebasing the economic statistics of the country in 2010, the 2017 banking sector clean-up, the COVID-19 pandemic, and the global crude oil price crash. The need for the selection of data on public expenditure and public revenue in this study is to address the theoretical concerns in relation to the tax-and-spend, spend-and-tax, fiscal synchronization and institutional separation (fiscal neutrality) hypotheses which will be executed across time and frequency in the Ghanaian context. The presence of gross domestic product as a common interdependence in the nexus of public expenditure and public revenue highlights the fact that expenditure and revenue are responsive to real economic activity. This can be seen in a reduction in tax revenue during severe economic shocks because of a fall in personal and business incomes. On the other hand, public spending is expected to upsurge as a result of fine-tuning or encouraging demand to spur economic growth. Hence, gross domestic product is specifically utilised in this study to deal with business cycle issues. All estimations are performed using the natural logarithm of public expenditure (EXP), public revenue (REV), and gross domestic product (GDP) to enhance effective comparison.
We show the preliminary statistics of the selected variables in Table . From Table , it can be seen that the mean of GDP exceeds that of EXP and REV. Nonetheless, the fiscal and economic indicators are seen to be negatively skewed suggesting that there is potential for lower values than higher values for the years ahead. This requires policymakers and governments to fine-tune these indicators to restore them to appropriate levels. The insignificant estimates from the Jarque–Bera statistic indicate that the indicators are normally distributed. However, both the Augmented Dickey—Fuller and Kwiatkowski—Phillips–Schmidt—Shin (KPSS) tests provide that the series are not stationary. Hence, the null hypothesis of the ADF test, which states that the series is not stationary is not rejected based on the insignificant estimates. On the other hand, the KPSS test with a null of stationarity is rejected from the significant estimates. Accordingly, the study employs methodologies (wavelet approaches) that are able to deal with issues of stationarity. Table provides the preliminary statistics of the key variables of interest.
Table 1. Key activities with impact on government revenue and expenditure
Table 2. Preliminary statistics of variables
We further show the correlation matrix of the indicators in Table to see how the variables are connected. It can be observed from Table that EXP, REV, and GDP are highly and significantly positively connected. In this manner, investigating their interdependencies across time and frequency is worthwhile in response to the tax-and-spend, spend-and-tax, and fiscal synchronization hypotheses as well as the influence of business cycles. The large correlation values pose no problem for multicollinearity since the wavelet approaches employed in this study are robust in handling it (Idun et al., Citation2022; Nkrumah-Boadu et al., Citation2022).
Table 3. Correlation matrix
Figure shows a trajectory of EXP, REV, and GDP for the sample period. A glance at Figure provides that the economic indicators trend upwards suggesting their non-stationary dynamics across time. A trajectory of the GDP is shown to be high above EXP and REV, and any business cycle effect could have a significant influence on the findings. This is not surprising because EXP and REV form part of real economic activity rendering shocks from GDP a common interdependence of EXP and REV. In this regard, ignoring the conditional impact of GDP would escalate the problem of non-policy effects within the data (Jaén-García, Citation2020). Furthermore, joint trajectories are evident in the case of EXP and REV with minimal differences at specific points in time as also found by Jaén-García (Citation2020) in Spain. It is clear that since 1992, Ghana’s public expenditure is always above public revenue.
Figure 1. Time series plot of fiscal indicators.
3.2. Bi-wavelet method
We outline an approach using bi-wavelet to look into how spending and income move together. This method can decipher the time-frequency analysis between expenses and income. To accomplish this, we dissect the time-series data of expenditure and revenue indicators into the spectral perspective, enabling policy-makers to make well-informed economic choices (Amoako et al., Citation2022; Hung, Citation2020). This is performed in response to the theoretical concerns of tax-and-spend, spend-and-tax, fiscal synchronization, and institutional separation hypotheses. The bi-wavelet approach, which helps researchers to appreciate the primary sorts of variability as well as how they change as a result of decomposition, is one of the most prominent techniques for detecting the power variation between two time-series data (Nkrumah-Boadu et al., Citation2022).
We begin by adopting the continuous wavelet transform (CWT) since it offers better extraction benefits (Pal & Mitra, Citation2019). The CWT makes sure that time series are broken down into simpler functions that are easier to understand because every frequency is used in operation and the shifting of the wavelet function is a continuous process.
Wavelet transform coherence (WTC), according to Torrence and Compo (Citation1998), is the squared value normalization of a cross-absolute spectrum to a single wavelet power spectrum. The equation for the squared wavelet coefficient is represented in Equationequation 1(1)
(1) as
where i shows the location or time depicting the specific place or time of the wavelet and scale dilation component identified as s tells the stretched nature of the wavelet, and ρ is a smoothing factor, which stabilizes resolution as well as significance, and the squared wavelet coefficient ranges between 0 and 1; .
A number that is closer to 1 emphasizes a considerable connection, while one that is closer to 0 indicates a weaker correlation. The time-frequency domain time-series variables are thoroughly connected by the WTC. The brighter hue in the results denotes a stronger co-movement. The Monte Carlo approach was created to investigate the statistical significance of this nexus because it is difficult to predict the theoretical distribution of the cross-wavelet transform coefficient (Torrence & Compo, Citation1998).
The oscillation breaks in a specific time series are shown by the WTC Phase difference. According to Bloomfield et al. (Citation2004), Equationequation 2(2)
(2) incorporates the phase difference between (t) and y(t) as
where ℑ and ℜ used in EquationEquation 2(2)
(2) represent imaginary operators and real operators correspondingly.
The phase pattern dimension on the wavelet coherence map emphasizes the wavelet coherence difference as a source of guidance. Phase patterns can be distinguished using dimensional arrows. Their findings are visually shown using arrows pointing to the right, left, up, or down. Left and right arrows pointing upward and downward, respectively, show that the second variable leads, whereas right and left arrows pointing upward and downward, respectively, identify the first variable leading. A colour scheme and a surface colour show how expenditure and revenue comove. Blue (cold) colour denotes areas with minimal co-movements, whereas red (warm) colour denotes areas with significant co-movements. An extended presentation of the bi-wavelet method can be found in the studies of Asafo-Adjei et al. (Citation2022), Boateng et al. (Citation2022), Bossman et al. (Citation2022) and Owusu Junior et al. (Citation2021).
3.3. Partial Wavelet Coherence (PWC)
The PWC is used in the literature to regulate the impact of time series variable z(t) on the wavelet coherence between the other two time-series variables x(t) and y(t), as well as to reduce the problem of “pure” correlation between time-series variables. The partial wavelet technique opines the degree of distortion in the co-movement of two time-frequency domain variables from a common interdependence (which in this case, is GDP). Hence, the application of the partial wavelet in this study helps in the determination of the conditional influence of GDP on the co-movements between expenditure and revenue across time and frequency. EquationEquation 3(3)
(3) depicts how the PWC among the chosen variables
where is between 0 and 1. We employ t and y, respectively, as expenditure and revenue while z denotes GDP.
3.4. Wavelet multiple
We further utilize the wavelet multiple approaches (wavelet multiple correlation (WMC) and wavelet multiple cross-correlations (WMCC)) to investigate the degree of interdependence among expenditure, revenue, and GDP to illustrate a complete picture of the nexus across intrinsic times of short-, medium-, and long-terms.
Let follows a multivariate stochastic process and let
be a resultant scale
. Fitted values of
from a theory of regression is
, therefore the wavelet multiple correlation (WMC) is in EquationEquation (4)
(4)
(4)
where is used to capitalize on
represents the fitted values in the regression of
on the outstanding wavelet coefficients at scale
.
The wavelet multiple cross-correlation (WMCC) is obtained by allowing a lag τ amid fitted values observable at scale as in EquationEquation 5
(5)
(5)
where for n = 2, WMCC and WMC unite with the cross-correlation and standard wavelet correlation.
To calculate WMCC and WMC, let be the recognition of the multivariate stochastic process
for
. MODWT of order J is linked to individual univariate time series {{
, … ,
}, for
, the
vectors of coefficients of MODWT
is obtained.
A nonlinear function of all wavelet correlations of scale
and a steady estimator of wavelet correlation from the MODWT is shown in EquationEquation 6
(6)
(6)
where represents the regression of the equivalent set of regressors
optimize the R2, and
denotes meeting the requirements fitted values.
An appropriate equation for the WMCC is presented as in EquationEquation 7(7)
(7)
For simplicity’s sake, Fernández-Macho (Citation2012) calculates the confidence interval (CI) of WMC using the transformation arctan ℎ(r), where arctan ℎ(.) is the inverse hyperbolic tangent function. The same realization of x used in the calculation of WMC and WMCC served as the basis for the estimation of the confidence interval. See, Fernández-Macho (Citation2012) for an extensive presentation of WMC and WMCC approaches.
4. Results and discussion
Analyses of the study are presented in three parts. The first shows the bi-wavelet, followed by the partial wavelet. The wavelet multiple approaches (WMC and WMCC) are further presented to detect the degree of integration and lead–lag relationships among EXP, REV, and GDP in the short-, medium-, and long-terms.
4.1. Bi-wavelet
Figure presents the time and frequency connectedness between EXP and REV using the bi-wavelet approach for the sample period (1983–2021). It demonstrates the extent of causality between EXP and REV as well as the direction of causality—whether positive or negative by observing the phase pattern dimension. It also reveals the degree to which the EXP and REV are interdependent (bi-causality) by observing the upwards or downwards right- and left-pointing arrows across time and frequency. From a warm (red) colour, we can decipher a strong connectedness between EXP and REV, which is relevant for policy direction, especially in times of serious economic events, whereas a cold (blue) colour depicts portions of minimal co-movements.
Figure 2. Co-movement between expenditure (EXP) and revenue (REV).
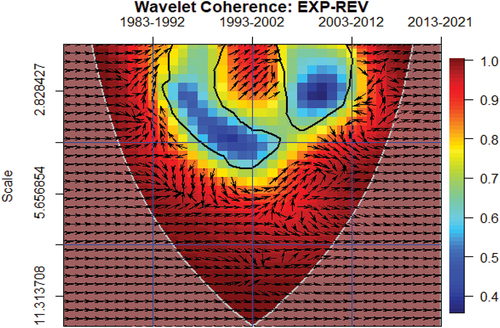
It can be seen from Figure that there is a strong co-movement between EXP and REV across time and frequency with minimal interconnectedness in the short-term of the mid of 1993 and 2002 as well as 2003 and 2012. The minimal co-movements between EXP and REV during these periods are not surprising due to the following reasons. The period between 1993 and 2002 (specifically, the first 3–4 years) marked a turn of events where public expenditure outweighed public revenue to take a new course. Also, due to increase in population and other macro indicators such as inflation, interest rate, unemployment, and the impact of economic shocks like the 2008 Global Financial crisis, strongly induced higher values in public spending and revenue thereby taking a new perspective between 2003 and 2012 (particularly, the first 3 years). Nonetheless, at most times public spending and revenue are highly connected and should be observed with caution.
Furthermore, the phase patterns can be observed from Figure exhibiting bi-directional, bi-causality, as well as interdependent EXP-REV nexus at certain times and frequencies. We notice right-pointing arrows between 1983 and 1992 in the short-, medium-, and long-terms suggesting positive connectedness between EXP and REV. A bi-directional nexus is observable between 1993 and 2021, but with most being right-pointing arrows. This is indicative of the fact that public expenditure and revenue are positively related, and as such move in a similar function. Accordingly, higher public expenditure is expected to meet higher levels of public spending and vice versa. However, to find out what drives or causes the nexus, it is prudent to critically observe the arrows further based on right-pointing upward or downward and left-pointing upward or downward to resolve the tax-and-spend and spend-and-tax hypothesis across time and frequency. The fiscal synchronicity hypothesis is, however, supported when EXP and REV exhibit interdependency or bi-causality. Portions of minimal co-movements shown in blue correspond to the institutional separation hypothesis.
Following from the above, between 1983 and 1992, there is a mixture of right-pointing arrows upwards and downwards between EXP and REV. The right-pointing arrows upward for this period show that public expenditure drives REV mostly in the short term. On the other hand, right-pointing arrows downward from Figure indicate that public revenue causes public expenditure mostly in the medium term. In this manner, between the period of 1983 and 1992, the spend-and-tax hypothesis is crucial in the short term whereas tax-and-spend hypothesis is dominant in the medium term. The bi-causality between the 1983 and 1992 economic period supports the fiscal synchronization hypothesis. This is in line with the outcome of Owoye (Citation1995) when the error correction model (ECM) was utilized to study this phenomenon among G7 countries and confirmed a bidirectional causality among all the countries except Japan and Italy.
Similarly, left-pointing arrows upwards and right-pointing arrows downwards are dominant between 1993 and 2022 in the medium- and long-terms. In the short term, more right-pointing arrows upwards can be observed. It therefore reveals the leading capability of public revenue at in the medium- and long-term implying that the tax-and-spend hypothesis is germane for this period. The spend-and-tax hypothesis is still magnified in the short-term, confirming the outcomes by Carneiro et al. (Citation2004), Lojanica (Citation2015), Reddick (Citation2002), Saunoris and Payne (Citation2010), Zapf and Payne (Citation2009), and Kazungu (Citation2019). Hence, in the short term, it is pertinent that the government spends first, and later cater for these expenditures using public revenue, such as raising taxes. Consequently, boosting the outflow of capital in the future raises public concerns about paying more taxes in the future.
Comparatively, the presence of dominating cold colour in the short term between 1993 and 2002 as well as 2003 and 2012 accentuates the institutional separation hypothesis signalling independence (evidence of no causality) between expenditure and revenue. At this point, bi-directional causality between EXP and REV does not hold implying that revenue decisions from government are made independent of public spending. This can create excessive budget deficits due to an eventual excess rise in public expenditure relative to revenue. This is not surprising because Ghana has been facing persistent budget deficits since 1992 with her public expenditure exceeding public revenue. The outcome on institutional separation hypothesis is confirmed by prior studies such as Akçağlayan and Kayıran (Citation2010); Baghestani and McNown (Citation1994); Chang et al. (Citation2002); and Kollias and Makrydakis (Citation2000).
The fiscal synchronization hypothesis is, however, germane in the medium term between 2003 and 2012 as well as in the short-term between 2013 and 2021. This is synonymous with the outcome by Jaén-García (Citation2020) in the context of Spain when the wavelet approaches were adopted. Other empirical studies by Baharumshah et al. (Citation2016), Hasan and Lincoln (Citation1997), Mehrara et al. (Citation2011), Miller and Russek (Citation1990), Ewing and Payne (Citation1998), Turan and Karakas (Citation2018), Vamvoukas (Citation2012) and Irandoust (Citation2018).
The medium term of 2013 and 2021 is nonetheless seen to exhibit the tax-and-spend hypothesis from the dominant right-pointing arrows downwards inclusive of the era of the COVID-19 pandemic. Hence, policymakers and the government in Ghana can mitigate budget deficits by targeting and implementing policies that drive public revenue. This is not surprising because during the pandemic in Ghana, public revenues were required from different sources to undertake public spending. Hence, from the dissociation of the source of information over time in line with the delay hypothesis, there are likelihoods for a rise in taxes, heightening the price of resources accessible to the public to plunge the budget deficit, providing avenue for a rise in public expenditure. In this sense, a rise in public revenue leads to a rise in public expenditure.
The findings from this study partly support the outcomes by Koren and Stiassny (Citation1998) who confirmed the Tax and Spend hypothesis for Germany, the UK, the USA, and the Netherlands; the Spend and Tax hypothesis in Austria, France, and Italy; and Institutional separation in Sweden and Switzerland. Yinusa et al. (Citation2017) on the other hand, established the tax and spend hypothesis in Nigeria through an asymmetric cointegration test (TAR and MTAR models) with a dataset spanning from 1981 to 2014. It must be noted that right-pointing arrows that are undefined in terms of upwards or downwards highlight the potential for a lead-lag nexus between public expenditure and revenue for the years ahead.
4.2. Partial wavelet
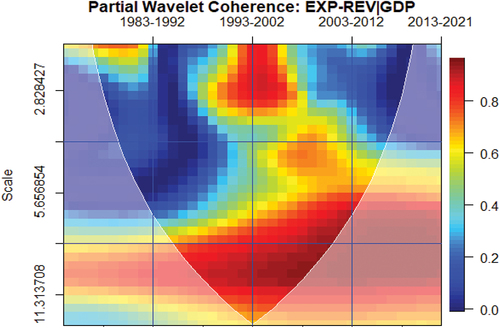
The outcome from the bi-wavelet is not conclusive without considering the conditional influence of the real economic highlighting policy effects and business cycles. Hence, we present the partial effect of GDP as a common interdependence on the nexus between public spending and public revenue. This is presented using the partial wavelet approach. The strong influence of GDP within the interconnectedness of EXP and REV can be observed from the blurring or eventual elimination of the already existing interconnectedness in the bi-wavelet case. In that case, the presence of cold (blue) colour or minimal warm (red) colour from the highly interconnected EXP and REV nexus suggests the strong impact of the real economy.
From Figure , the nexus between EXP and REV is less connected in the presence of the real economy across time and frequency. There are patches of strong co-movements in the long-term, and short-term between 1993 and 2002 as well as between 2003 and 2012. This implies that by observing from the partial impact of the real economy, the institutional separation hypothesis is plausible in this study.
Figure 3. Conditional effect of GDP on the nexus between expenditure (EXP) and revenue (REV).
4.3. Wavelet multiple
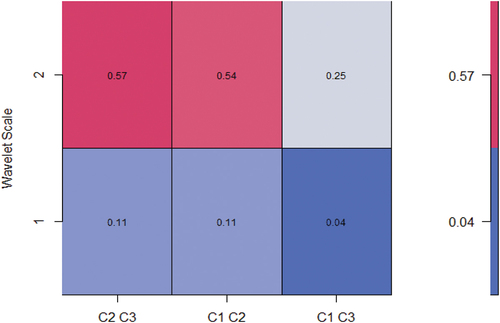
We proceed with the wavelet multiple showing the level of integration among EXP, REV, and GDP at intrinsic times only in the short term and long term. We notice from the bivariate contemporaneous analysis that EXP and GDP are more connected at various frequencies. This is followed by the connection between EXP and REV, and then between REV and GDP. This implies that public expenditure contributes substantially to the real economy, whereas public revenue supports or is supported by public expenditure as revealed from the bi-wavelet approach. The positive nexus between the variables is confirmed by prior studies on revenue-growth (see, Anastassiou & Dritsaki, Citation2005; Aydin & Esen, Citation2019b; Egbunike et al., Citation2018; Eneche & Stephen, Citation2021; Lee & Gordon, Citation2005; Ray et al., Citation2012; Tosun & Abizadeh, Citation2005), expenditure-growth (see, Akanbi et al., Citation2019; Ibrahim, Citation2019), and expenditure-revenue (Irandoust, Citation2018). Other studies, however, found otherwise (see, Amri et al., Citation2019; Barlas, Citation2020; Mamatzakis, Citation2005; Saqib et al., Citation2014; Taha et al., Citation2011; Widmalm, Citation2001; Zeng & Du, Citation2003). Figure , depicts the Bivariate contemporaneous analysis.
Figure 4. Bivariate contemporaneous analysis.
Knowing that EXP, REV, and GDP are connected at various frequencies, we present the degree of integration among the variables simultaneously in Figure . In this manner, we are able to decipher the extent to which EXP and REV are connected in the presence of business cycles highlighting the real economic activity. Again, as revealed from the partial wavelet approach, integration among the economic indicators increases from the short term to the long term but not as strong as revealed by existing studies achieving roughly beyond 80% dependency relative to the 70% in Table (see, Asafo-Adjei et al., Citation2022, Citation2022; Boateng et al., Citation2022; Hamidu et al., Citation2022).
Figure 5. Wavelet multiple correlations among expenditure, revenue and GDP. U-upper limits, L- lower (at 95% confidence interval).
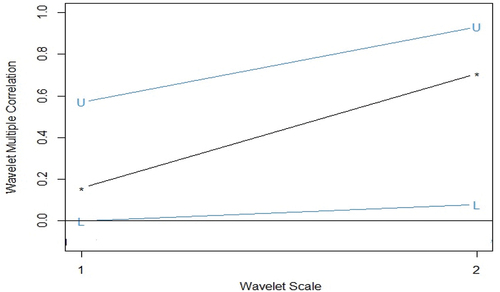
Table 4. Wavelet Multiple Correlations (WMC)
Following from the extant literature on the interpretation of the WMCC (Agyei et al., Citation2022; Asafo-Adjei et al., Citation2021; Bossman et al., Citation2022; Fernández-Macho, Citation2012; Owusu Junior et al., Citation2021), we present the WMCC outcome in Figure and Table to investigate the degree of lead–lag relationships among the economic indicators in the short term and long term. From Figure , public expenditure maximises the cross-correlations of public revenue and the real economy from a linear combination in the short term and long term. It can be concluded that on the average, public spending leads to the nexus among a network of the selected economic indicators in both the short term and long term. The findings imply that public expenditure is the first economic indicator to respond to shock before all other variables at various economic horizons. In this manner, on average, public spending leads the relationship in the presence of the real economy in Ghana, supporting the spend-and-tax hypothesis of Peacock and Wiseman (Citation1979).
Figure 6. Wavelet multiple cross-correlations among expenditure, revenue and GDP.
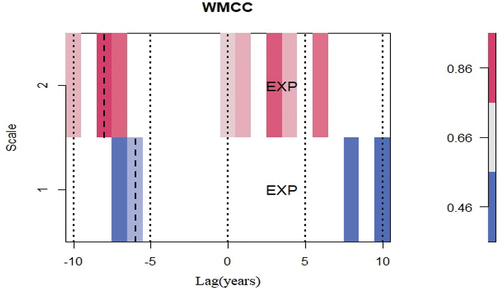
Table 5. Wavelet Multiple Cross Correlations (WMCC)
This study provides confirmation for the Keynes’ proposition of government revenue driving economic growth. This is because overall, we find evidence of the impact of government expenditure on economic growth in both the short term and long term (Aydin & Esen, Citation2019a). In this regard, our study aligns with Akanbi et al. (Citation2019), Karagianni et al. (Citation2019), Okere et al. (Citation2019), Rasaily and Paudel (Citation2019), as well as Sedrakyan and Varela-Candamio (Citation2019). Despite this, the contesting views by Levitt and Joyce (Citation1987) with a UK dataset, Abizadeh and Yousefi (Citation1998b & b) with (a) South Korea, (b) USA dataset, Bagdigen and Beser (Citation2012) with Turkey Dataset, Odhiambo (Citation2015), with South African dataset, and Chirwa and Odhiambo (Citation2019), with Zambia dataset calls for more studies using West African datasets. In the main, it will seem from prevailing studies that English speaking West African countries, as well as countries under severe reconstruction exhibit evidences of public expenditure impacting economic growth, at least within a threshold. For instance, in Nigeria, Akanbi et al. (Citation2019) revealed that government agriculture expenditure influences economic growth in the long-run. Also, in Afghanistan, Barlas (Citation2020) finds that government expenditure affects economic growth, but negatively.
Hence, in light of economic events and other crises that influenced the Ghanaian economy such as the 1983 drought in Ghana, the 2008 Global Financial crisis, rebasing the economic statistics of the country in 2010, the 2017 banking sector clean-up, the COVID-19 pandemic, and the souring, global crude oil price crash that drive temporary increases in public spending lead to unforeseeable rise in public revenues. Furthermore, today’s Ghana deficit-financed expenditure consistent with the view of Barro (Citation1979) means rising tax liabilities in the future in line with the Ricardian equivalence proposition ruling out the effect of the fiscal illusion. Accordingly, higher public expenditure in Ghana drives public revenue in the form of taxes in the future implying that reduction in public expenditure is a necessary condition for minimising budget deficits.
5. Conclusion
The study employed wavelet approaches (bi-wavelet, partial wavelet, wavelet multiple correlation, and wavelet multiple cross-correlation techniques) to investigate the lead-lag nexus, degree of integration and interdependency among public expenditure, public revenue, and gross domestic product (GDP) in the Ghanaian context. Analyses of the study were performed across time and/or frequency to reveal heterogeneity in causality between public revenues and expenditures in the context of four main hypotheses including spend-and-tax, tax-and-spend, fiscal synchronization, and institutional separation (fiscal neutrality). We utilized GDP in this study as a common interdependence in the nexus between public expenditure and public revenue since expenditure and revenue are responsive to the real economic activity and aid in business cycle and policy effects decisions investigations.
The unique contribution of this study to prior literature is the assessment of the causality and degree of integration between public revenues and public expenditure to evaluate the heterogeneity behind the formation of budget deficits amidst the real economy in the context of Ghana, a developing economy, using four main wavelet approaches. First, we answer questions relating to causality between public expenditure and public revenue across time and frequency through the bi-wavelet. Second, we examine the partial influence of GDP as a common interdependence between public expenditure and public revenue across time and frequency to avoid the effects of non-policy decisions and respond to business cycle impacts. Third, the extent of integration among the economic indicators is simultaneously determined in the short-term and medium-term through the wavelet multiple-correlation approach. Fourth, to find out the averaged lead-lag nexus among the indicators in the short term and long term, the wavelet multiple cross-correlation is specifically utilized.
The study came up with four major findings that have equivalent ramifications. First, the bi-wavelet analysis revealed that public expenditure and revenue are closely related, and mostly positive throughout both time and frequency. Additionally, the phase patterns revealed a nexus between public spending and revenue at specific intervals and on a regular basis that was bi-directional, bi-causal, and interdependent. Between 1993 and 2021, a bi-directional nexus could be seen; however, the majority of the arrows pointed to the right. This shows that public spending and revenue have a positive relationship and behave similarly as a result. Accordingly, it is anticipated that increased levels of public spending will be met by higher levels of public spending and vice versa.
Again, from 1983 to 1992, public spending primarily led revenues in the short run. Public revenue, on the other hand, mostly led to public spending during the medium term. The fiscal synchronization hypothesis is supported by the bi-causality between the economic periods of 1983 and 1992. The leading capacity for public revenue between 1993 and 2022 in the medium- and long-terms also supports the tax-and-spend hypothesis. On the other hand, the short-term evidence favors the spend-and-tax hypothesis. Therefore, it increases public anxieties about having to pay more in taxes in the future in order to increase the outflow of capital. Additionally, the institutional separation or fiscal neutrality hypothesis is supported in the short-term periods of 1993, 2002, 2003, and 2012 due to the indication of independence (no causality) between expenditure and revenue. However, both in the short term (between 2013 and 2021) and the medium term (between 2003 and 2012), the fiscal synchronization hypothesis is relevant. The tax-and-spend hypothesis is observed to be present between 2013 and 2021, which includes the heat of the COVID-19 pandemic timeframe. Therefore, by focusing on and executing policies that increase public revenue, policymakers and the government of Ghana can reduce budget deficits. In this sense, an increase in tax revenue causes an increase in governmental spending. The possibility of a lead–lag relationship between public spending and revenue in the future can be inferred.
Secondly, from the partial wavelet, the strong influence of GDP on the nexus between expenditure and revenue supports the institutional separation hypothesis. Thirdly, evidence from the WMC indicated that integration among expenditure and revenue in the presence of the real economy increases from the short-term to the long-term but with minimal dependency in comparison with prior literature. Fourthly, public expenditure maximises the cross-correlations of public revenue and the real economy from a linear combination in the short-term and long-term. The findings imply that public expenditure is the first economic indicator to respond to shock before all others at various economic horizons. In this manner, on average, public spending leads the relationship in the presence of the real economy in Ghana supporting the spend-and-tax hypothesis. It is recommended that policymakers and governments, including other specific economic agents such as the Bank of Ghana, commercial banks, the Securities and Exchange Commission, Ghana Revenue Authority, and Departments and Agencies directly under the Ministry of Finance help fine-tune public expenditure and revenue to resuscitate the persistent budget deficits.
The current study is not without limitations, giving credence for investigations by further studies. Since GDP is influenced by a number of macroeconomic indicators, as a suggestion for future studies, indicators relating to merchandise trade flows, monetary survey, exchange rates, financial soundness measures, government fiscal operations, interest rates, and the real sector indicators can be included to investigate the interconnectedness between public spending and revenue since financial times series do not operate in isolation. In addition, other studies can perform the investigation through the application of time varying connectedness that welcomes a simultaneous connectedness of several variables for effective policy decisions. Furthermore, the study was limited to the Ghanaian setting as a developing economy. Further studies can be conducted in other developing nations to see how the interconnectedness between expenditure and income amid economic growth play out for the four hypotheses explored in this study.
Disclosure statement
No potential conflict of interest was reported by the authors.
Notes
1. For more about the ERP program of Ghana please see Leith and Söderling (Citation2000); Abbey (Citation1989); Bulir (Citation1998).
2. Ghana—Enhanced Structural Adjustment Facility Economic and Financial Policy Framework Paper, 1998–2000.
3. Confirmed statutory independence of the Central Bank including insisting of zero financing by the central bank of governments operations. Also capped amount of debt to government from central bank at 5% of prior years expenditure.
4. Start of Highly Indebted Poor Countries Programme led to a period of debt reduction from $66 billion to $23 billion in 2006.
5. Massive emergency supply deficiency that led to frequent power cuts and load shedding and led to an unprecedented initiative to improve installed capacity through collaborations with Independent Power Producers.
6. The Ghana Integrated Financial Management Information System (GIFMIS) was a comprehensive ERP for government financial operations.
7. An extended credit facility aimed at restoring debt sustainability and macroeconomic stability of circa $918 million. This is attached to conditionalities around expenditure control etc.
8. The Income Tax Act consolidated and reformed income tax laws and regulations.
9. The Public Financial Management Act engrained accrual accounting and the adoption of IPSAS in public financial management.
10. Fiscal Responsibility Act provides rules to ensure macroeconomic stability, including capping the allowable fiscal deficit at 5%.
11. Monumental International Development Agency support to Ghana, particularly from the IMF and World Bank (WB), in support of government of Ghana’s emergency preparedness and response fund. Totally estimated receipt in excess of a Billion dollars with an additional SDR release of 1 billion dollars by IMF.
12. The Emergency Powers Act suspended key fiscal and monetary rules during the COVID-19 pandemic.
13. The Emergency Powers Act suspended key fiscal and monetary rules during the COVID-19 pandemic.
References
- Abbey, J. L. S. (1989). On Promoting Successful Adjustment, Some Lessons from Ghana. Per Jacobsson Foundation.
- Abizadeh, S., & Yousefi, M. (1998). An empirical analysis of South Korea's economic development and public expenditures growth. The Journal of Socio-Economics, 27(6), 687–28.
- Abizadeh, S., & Yousefi, M. (1998b). An empirical analysis of South Korea’s economic development and public expenditures growth. The Journal of Socio-Economics, 27(6), 687–700. https://doi.org/10.1016/S1053-5357(99)80003-1
- Afonso, A., & Ibraimo, Y. (2020). The macroeconomic effects of public debt: An empirical analysis of Mozambique. Applied Economics, 52(2), 212–226. https://doi.org/10.1080/00036846.2019.1644445
- Agell, J., Lindh, T., & Ohlsson, H. (1997). Growth and the public sector: A critical review essay. European Journal of Political Economy, 13(1), 33–52. https://doi.org/10.1016/S0176-2680(96)00031-6
- Agyei, S. K., Adam, A. M., Bossman, A., Asiamah, O., Owusu Junior, P., Asafo-Adjei, R., & Asafo-Adjei, E. (2022). Does volatility in cryptocurrencies drive the interconnectedness between the cryptocurrencies market? Insights from wavelets. Cogent Economics & Finance, 10(1), 2061682. https://doi.org/10.1080/23322039.2022.2061682
- Ajayi, M. A., & Aluko, O. A. (2016). The Causality between Government Expenditure and Economic Growth in Nigeria: A Toda-Yamamoto Approach. Journal of Economics & Business Research, 22(2), 77–90. 20.
- Akanbi, O. O., Onuk, E. G., & Umar, H. S. (2019). Effect of agricultural sector expenditure on Nigeria’s economic growth. Asian Journal of Agricultural Extension, Economics & Sociology, 1–11. https://doi.org/10.9734/ajaees/2019/v32i330157
- Akçağlayan, A., & Kayıran, M. (2010). Public Expenditures and Revenues in Turkey. Nedensellik ilişkisi üzerine bir araştırma Eskişehir Osmangazi Üniversitesi İİBF Dergisi, 5(2), 129–146. Retrieved from. https://dergipark.org.tr/tr/pub/oguiibf/issue/56495/785640
- Almasri, A., & Shukur, G. (2003). An illustration of the causality relation between government spending and revenue using wavelet analysis on Finnish data. Journal of Applied Statistics, 30(5), 571–584. https://doi.org/10.1080/0266476032000053682
- Alshammary, M. D., Khalid, N., Karim, Z. A., & Ahmad, R. (2022). Government expenditures and economic growth in the MENA region: A dynamic heterogeneous panel estimation. International Journal of Finance & Economics, 27(3), 3287–3299. https://doi.org/10.1002/ijfe.2321
- Aluthge, C., Jibir, A., & Abdu, M. (2021). Impact of government expenditure on economic growth in Nigeria, 1970-2019. Central Bank of Nigeria Journal of Applied Statistics, 12(1), 139–174. https://doi.org/10.33429/Cjas.12121.6/6
- Al-Zeaud, H. A. (2012). Government revenues and expenditures: Causality tests for Jordan. Interdisciplinary Journal of Contemporary Research in Business, 4(7), 193–204.
- Amin, A., Chen, Y., & Huang, S. (2018). Personal income tax and economic growth: A comparative study between China and Pakistan. Asian Journal of Economic Modelling, 6(1), 65–73. https://doi.org/10.18488/journal.8.2018.61.65.73
- Amoako, G. K., Asafo-Adjei, E., Mintah Oware, K., Adam, A. M., & Gherghina, S. C. (2022). Do Volatilities Matter in the Interconnectedness between World Energy Commodities and Stock Markets of BRICS? Discrete Dynamics in Nature & Society, 2022, 1–13. https://doi.org/10.1155/2022/1030567
- Amri, K., Masbar, R., & Aimon, H. (2019). Is there a causality relationship between local tax revenue and regional economic growth? A panel data evidence from indonesia. Regional Science Inquiry, 11(1), 73–84.
- Anastassiou, T., & Dritsaki, C. (2005). Tax revenues and economic growth: An empirical investigation for Greece using causality analysis. Journal of Social Sciences, 1(2), 99–104. https://doi.org/10.3844/jssp.2005.99.104
- Asafo-Adjei, E., Adam, A. M., Hamidu, Z., Oppong, P. O., & Amoako, G. K. (2022). Risk-synchronisation through the prism of interconnectedness among sustainability equities returns: A regional and global perspective. International Journal of Green Economics, 16(2), 165. 2. https://doi.org/10.1504/IJGE.2022.10052714
- Asafo-Adjei, E., Boateng, E., Isshaq, Z., Idun, A. A. A., Owusu Junior, P., Adam, A. M., & Trinidad Segovia, J. E. (2021). Financial sector and economic growth amid external uncertainty shocks: Insights into emerging economies. PLos One, 16(11), e0259303. https://doi.org/10.1371/journal.pone.0259303
- Austin, D. (1976). Ghana observed: Essays on the politics of a West African republic. Manchester University Press.
- Aydin, C., & Esen, Ö. (2019a). Does too much government spending depress the economic development of transition economies? Evidences from dynamic panel threshold analysis. Applied Economics, 51(15), 1666–1678. https://doi.org/10.1080/00036846.2018.1528335
- Aydin, C., & Esen, Ö. (2019b). Optimal tax revenues and economic growth in transition economies: A threshold regression approach. Global Business & Economics Review, 21(2), 246–265. https://doi.org/10.1504/GBER.2019.098091
- Bagdigen, M., & Beser, B. (2012). An analysis of the causality relation between public expenditures and economic growth based on Wagner’s Law: The case of Turkey. Int J Manag Econ Bus, 5(9), 1–17.
- Baghestani, H., & McNown, R. (1994). Do revenues or expenditures respond to budgetary disequilibria? Southern Economic Journal, 61(2), 311–322. https://doi.org/10.2307/1059979
- Baharumshah, A. Z., Jibrilla, A. A., Sirag, A., Ali, H. S., & Muhammad, I. M. (2016). Public revenue‐expenditure nexus in South Africa: Are there asymmetries? South African Journal of Economics, 84(4), 520–537. https://doi.org/10.1111/saje.12130
- Barlas, A. W. (2020). The impact of government expenditure on economic growth in Afghanistan. Journal of Economics and Business, 3(2). https://doi.org/10.31014/aior.1992.03.02.234
- Barro, R. J. (1979). On the determination of the public debt. Journal of Political Economy, 87(5, Part 1), 940–971. https://doi.org/10.1086/260807
- Barro, R. J. (1986). US deficits since World War I. The Scandinavian Journal of Economics, 195–222.
- Barro, R. J. (1990). Government spending in a simple model of endogenous growth. Journal of Political Economy, 98(5, Part 2), S103–125. https://doi.org/10.1086/261726
- Blinder, A. S., & Solow, R. M. (1976). Does fiscal policy still matter?: A reply. Journal of Monetary Economics, 2(4), 501–510. https://doi.org/10.1016/0304-3932(76)90045-3
- Bloomfield, D. S., McAteer, R. J., Lites, B. W., Judge, P. G., Mathioudakis, M., & Keenan, F. P. (2004). Wavelet phase coherence analysis: Application to a quiet-sun magnetic element. Astrophysical Journal, 617(1), 623–632. https://iopscience.iop.org/article/10.1086/425300/pdf
- Boateng, E., Asafo-Adjei, E., Addison, A., Quaicoe, S., Yusuf, M. A., Adam, A. M., & Adam, A. M. (2022). Interconnectedness among commodities, the real sector of Ghana and external shocks. Resources Policy, 75, 102511. https://doi.org/10.1016/j.resourpol.2021.102511
- Bose, N., Holman, J. A., & Neanidis, K. C. (2007). The optimal public expenditure financing policy: Does the level of economic development matter? Economic Inquiry, 45(3), 433–452. https://doi.org/10.1111/j.1465-7295.2007.00021.x
- Bossman, A., Adam, A. M., Junior, P. O., & Agyei, S. K. (2022). Assessing Interdependence and Contagion Effect on the Bond Yield and Stock Returns Nexus in sub-Saharan Africa: Evidence from Wavelet Analysis. Scientific African, 16, e01232. https://doi.org/10.1016/j.sciaf.2022.e01232
- Brady, G. L., & Magazzino, C. (2019). Government expenditures and revenues in Italy in a long-run perspective. Journal of Quantitative Economics, 17(2), 361–375. https://doi.org/10.1007/s40953-019-00157-z
- Bulir, M. A. (1998). The price incentive to smuggle and the cocoa supply in Ghana, 1950-96. International Monetary Fund.
- Carneiro, F., Faria, J. R., & Barry, B. S. (2004). Government revenues and expenditures in Guinea-Bissau: Causality and cointegration. Journal of Economic Development, 30(1), 107–117. https://doi.org/10.2139/ssrn.574143
- Castles, F. G., & Dowrick, S. (1990). The impact of government spending levels on medium-term economic growth in the OECD, 1960-85. Journal of Theoretical Politics, 2(2), 173–204. https://doi.org/10.1177/0951692890002002003
- Chang, T., Liu, W. R., & Caudill, S. B. (2002). Tax-and-spend, spend-and-tax, or fiscal synchronization: New evidence for ten countries. Applied Economics, 34(12), 1553–1561. https://doi.org/10.1080/00036840110103265
- Cheng, B. S. (1999). Causality between taxes and expenditures: Evidence from Latin American countries. Journal of Economics & Finance, 23(2), 184–192. https://doi.org/10.1007/BF02745952
- Chirwa, T. G., & Odhiambo, N. M. (2019). The nexus between key macroeconomic determinants and economic growth in Zambia: A dynamic multivariate Granger causality linkage. Empirical Economics, 57(1), 301–327. https://doi.org/10.1007/s00181-018-1439-2
- Dankumo, A. M., Ishak, S., Bani, Y., & Hamza, H. Z. (2021). Governance, Public Expenditure, Trade and Poverty Reduction in Sub-Saharan African Countries. Jurnal Ekonomi dan Studi Pembangunan, 13(1), 16–35. https://doi.org/10.17977/um002v13i12021p016
- Egbunike, F. C., Emudainohwo, O. B., & Gunardi, A. (2018). Tax revenue and economic growth: A study of Nigeria and Ghana. Signifikan: Jurnal Ilmu Ekonomi, 7(2), 213–220. https://doi.org/10.15408/sjie.v7i2.7341
- Eneche, E. O., & Stephen, I. A. (2021). Tax revenue and Nigeria economic growth. European Journal of Economics and Business Studies Articles. https://doi.org/10.26417/ejss.v3i1.p30-44
- Engen, E. M., & Skinner, J. S. (1992). Fiscal policy and economic growth. NBER Working Paper No. 4223, National Bureau of Economic Research, https://doi.org/10.3386/w4223
- Ewing, B., & Payne, J. (1998). Government revenue-expenditure nexus: Evidence from Latin America. Journal of Economic Development, 23(2), 57–69.
- Fernández-Macho, J. (2012). Wavelet multiple correlation and cross-correlation: A multiscale analysis of Eurozone stock markets. Physica A Statistical Mechanics & Its Applications, 391(4), 1097–1104. https://doi.org/10.1016/j.physa.2011.11.002
- Friedman, M. (1978). The limitations of tax limitation. Quadrant, 22(8), 22–24.
- Gale, W., Khitatrakun, S., & Krupkin, A. (2017). Cutting Taxes and Making Future Americans Pay for It: How Trump’s Tax Cuts Could Hurt Many Households. The Tax Policy Center. https://www.taxpolicycenter.org/sites/default/files/publication/143411/cutting_taxes_and_making_future_americans_pay_for_it_1.pdf
- Gurdal, T., Aydin, M., & Inal, V. (2021). The relationship between tax revenue, government expenditure, and economic growth in G7 countries: New evidence from time and frequency domain approaches. Economic Change and Restructuring, 54(2), 305–337. https://doi.org/10.1007/s10644-020-09280-x
- Gurdal, T., Veysel, İ. N. A. L., & Şahpaz, K. İ. (2020). Empiric Evidences on the Relationship Between Tax Revenues and Income Distribution Inequality: Kónya Panel Causality Test. Kahramanmaraş Sütçü İmam Üniversitesi Sosyal Bilimler Dergisi, 17(2), 1100–1117.
- Hacker, R. S., Karlsson, H. K., & Månsson, K. (2014). An investigation of the causal relations between exchange rates and interest rate differentials using wavelets. International Review of Economics & Finance, 29, 321–329. https://doi.org/10.1016/j.iref.2013.06.004
- Hamidu, Z., Oppong, P. B., Asafo-Adjei, E., Adam, A. M., & Li, Y. (2022). On the Agricultural Commodities Supply Chain Resilience to Disruption: Insights from Financial Analysis. Mathematical Problems in Engineering, 2022, 1–12. https://doi.org/10.1155/2022/9897765
- Hasan, M., & Lincoln, I. (1997). Tax then spend or spend then tax? Experience in the UK, 1961–93. Applied Economics Letters, 4(4), 237–239. https://doi.org/10.1080/758518502
- Hopper, T. (2017). Neopatrimonialism, good governance, corruption and accounting in Africa: Idealism vs pragmatism. Journal of Accounting in Emerging Economies, 7(2), 225–248.
- Hung, N. T. (2020). Volatility spillovers and time-frequency correlations between Chinese and African stock markets. Regional Statistics, 10(2), 63–82. https://doi.org/10.15196/RS100203
- Ibrahim, C. (2019). Government spending and non-oil economic growth in the UAE. Economics and Business, 33(1), 82–93. https://doi.org/10.2478/eb-2019-0006
- Idun, A. A. A., Asafo-Adjei, E., Adam, A. M., & Isshaq, Z. (2022). Dynamic Connectedness between Indicators of the Ghana Stock Exchange Returns and Macroeconomic Fundamentals. Risks, 10(11), 215. https://doi.org/10.3390/risks10110215
- International Monetary Fund. (2022). Annual Report of the Executive Board. https://www.imf.org/en/Publications/AREB
- Irandoust, M. (2018). Government spending and revenues in Sweden 1722–2011: Evidence from hidden cointegration. Empirica, 45(3), 543–557. https://doi.org/10.1007/s10663-017-9375-5
- Jaén García, M. (2019). Alternative models to explain the evolution of Spanish public spending. Semestre Económico, 2(51), 169–199. https://doi.org/10.22395/seec.v22n51a8
- Jaén-García, M. (2020). Tax-spend, spend-tax, or fiscal synchronization. A wavelet analysis. Applied Economics, 52(28), 3023–3034. https://doi.org/10.1080/00036846.2019.1705238
- Karagianni, S., Pempetzoglou, M., & Saraidaris, A. (2019). Government expenditures and economic growth: A nonlinear causality investigation for the UK. European Journal of Marketing and Economics, 2(2), 52–58. https://doi.org/10.26417/ejme-2019.v2i2-70
- Karlsson, H. K. (2020). Investigation of the time-dependent dynamics between government revenue and expenditure in China: A wavelet approach. Journal of the Asia Pacific Economy, 25(2), 250–269. https://doi.org/10.1080/13547860.2019.1646573
- Kazungu, K. (2019). The nexus between government expenditure and revenue in Tanzania. Asian Journal of Economic Modelling, 7(4), 158–170. https://doi.org/10.18488/journal.8.2019.74.158.170
- Kollias, C., & Makrydakis, S. (2000). Tax and spend or spend and tax? Empirical evidence from Greece, Spain, Portugal and Ireland. Applied Economics, 32(5), 533–546. https://doi.org/10.1080/000368400322444
- Koren, S., & Stiassny, A. (1998). Tax and spend, or spend and tax? An international study. Journal of Policy Modeling, 20(2), 163–191. https://doi.org/10.1016/S0161-8938(96)00073-7
- Lee, Y., & Gordon, R. H. (2005). Tax structure and economic growth. Journal of Public Economics, 89(5–6), 1027–1043. https://doi.org/10.1016/j.jpubeco.2004.07.002
- Leith, J. C., & Söderling, L. (2000). Emerging Africa.
- Levitt, M., & Joyce, P. M. (1987). The Growth and Efficiency of Government Expenditure. Cambridge University Press.
- Li, X. (2001). Government revenue, government expenditure, and temporal causality: Evidence from China. Applied Economics, 33(4), 485–497. https://doi.org/10.1080/00036840122982
- Linhares, F., Nojosa, G., & Bezerra, R. (2021). Changes in the revenue–expenditure nexus: Confronting evidence with fiscal policy in Brazil. Applied Economics, 53(44), 5051–5067. https://doi.org/10.1080/00036846.2021.1915463
- Lojanica, N. (2015). Government expenditure and government revenue–The causality on the example of the republic of Serbia. Management International Conference, 79–90. https://www.researchgate.net/profile/Nemanja-Lojanica/publication/292059760_Government_Expenditure_and_Government_Revenue_-_The_Causality_on_the_Example_of_the_Republic_of_Serbia/links/56a8b24208aeded22e38e8e6/Government-Expenditure-and-Government-Revenue-The-Causality-on-the-Example-of-the-Republic-of-Serbia.pdf
- Lucas, R. (1997). Taxing, spending, and the budget process: The role of budget regimes in the intertemporal budget constraint. Swiss Journal of Economics and Statistics, 133(3), 421–440.
- Lupu, D., & Asandului, M. (2017). The nexus between economic growth and public spending in Eastern European countries. Engineering Economics, 28(2017), 155–161. https://doi.org/10.5755/j01.ee.28.2.7734
- Lupu, D., Petrisor, M. B., Bercu, A., & Tofan, M. (2018). The impact of public expenditures on economic growth: A case study of Central and Eastern European countries. Emerging Markets Finance & Trade, 54(3), 552–570. https://doi.org/10.1080/1540496X.2017.1419127
- Mamatzakis, E. C. (2005). The dynamic responses of growth to tax structure for Greece. Applied Economics Letters, 12(3), 177–180. https://doi.org/10.1080/1350485042000318420
- Mehrara, M., Pahlavani, M., & Elyasi, Y. (2011). Government revenue and government expenditure nexus in Asian countries: Panel cointegration and causality. International Journal of Business & Social Science, 2(7), 199–207.
- Meltzer, A. H., & Richard, S. F. (1981). A rational theory of the size of government. Journal of Political Economy, 89(5), 914–927. https://doi.org/10.1086/261013
- Mendoza, E. G., Milesi-Ferretti, G. M., & Asea, P. (1997). On the ineffectiveness of tax policy in altering long-run growth: Harberger’s superneutrality conjecture. Journal of Public Economics, 66(1), 99–126. https://doi.org/10.1016/S0047-2727(97)00011-X
- Miller, S. M., & Russek, F. S. (1990). Co-integration and error-correction models: The temporal causality between government taxes and spending. Southern Economic Journal, 57(1), 221–229. https://doi.org/10.2307/1060491
- Mounts, W. S., Jr., & Sowell, C. (1995). A statistical note on possible institutional regimes in budget policy. Journal of Macroeconomics, 17(1), 149–160. https://doi.org/10.1016/0164-0704(95)80008-5
- Musgrave, R. A. (1966). Fiscal Systems. Yale University Press.
- Musgrave, R. A. (1985). A brief history of fiscal doctrine. In A. J. Auerbach & M. Feldstein (Eds.), Handbook of public economics (Vol. 1, pp. 1–59). North Holland, Amsterdam: Elsevier.
- Narayan, P. K., & Narayan, S. (2006). Government revenue and government expenditure nexus: Evidence from developing countries. Applied Economics, 38(3), 285–291. https://doi.org/10.1080/00036840500369209
- Nketiah-Amponsah, E. (2009). Public spending and economic growth: Evidence from Ghana (1970–2004). Development Southern Africa, 26(3), 477–497. https://doi.org/10.1080/03768350903086846
- Nkrumah-Boadu, B., Owusu Junior, P., Adam, A., & Asafo-Adjei, E. (2022). Safe haven, hedge and diversification for African stocks: Cryptocurrencies versus gold in time-frequency perspective. Cogent Economics & Finance, 10(1), 2114171. https://doi.org/10.1080/23322039.2022.2114171
- Nyarko-Asomani, A., Bhasin, V. K., & Aglobitse, P. B. (2019). Government capital expenditure, recurrent expenditure and economic growth in Ghana. Ghanaian Journal of Economics, 7(1), 44–70.
- Obeng, S. (2015). A causality test of the revenue-expenditure nexus in Ghana. African Journal of Economic Review, 3(2), 85–10.
- Odhiambo, N. M. (2015). Government expenditure and economic growth in South Africa: An empirical investigation. Atlantic Economic Journal, 43(3), 393–406. https://doi.org/10.1007/s11293-015-9466-2
- Ojede, A., & Yamarik, S. (2012). Tax policy and state economic growth: The long-run and short-run of it. Economics Letters, 116(2), 161–165. https://doi.org/10.1016/j.econlet.2012.02.023
- Okere, P. A., Uzowuru, L. N., & Amako, J. C. (2019). Government expenditure and economic growth in Nigeria. Int J Econ Financ Manag, 4(2), 29–41.
- Okoye, F. (2019). The influence of tax amnesty programme on tax compliance in Nigeria: The moderating role of political trust. Journal of Accounting and Taxation, 11(7), 120–129. https://doi.org/10.5897/JAT2019.0349
- Olayungbo, D. O., & Olayemi, O. F. (2018). Dynamic relationships among non-oil revenue, government spending and economic growth in an oil producing country: Evidence from Nigeria. Future Business Journal, 4(2), 246–260. https://doi.org/10.1016/j.fbj.2018.07.002
- Onifade, S. T., Çevik, S., Erdoğan, S., Asongu, S., & Bekun, F. V. (2020). An empirical retrospect of the impacts of government expenditures on economic growth: New evidence from the Nigerian economy. Journal of Economic Structures, 9(1), 1–13. https://doi.org/10.1186/s40008-020-0186-7
- Owoye, O. (1995). The causal relationship between taxes and expenditures in the G7 countries: Cointegration and error-correction models. Applied Economics Letters, 2(1), 19–22. https://doi.org/10.1080/135048595357744
- Owusu Junior, P., Adam, A. M., Asafo-Adjei, E., Boateng, E., Hamidu, Z., & Awotwe, E. (2021). Time-frequency domain analysis of investor fear and expectations in stock markets of BRIC economies. Heliyon, 7(10), e08211. https://doi.org/10.1016/j.heliyon.2021.e08211
- Pal, D., & Mitra, S. K. (2019). Hedging bitcoin with other financial assets. Finance Research Letters, 30, 30–36. https://doi.org/10.1016/j.frl.2019.03.034
- Payne, J. E. (2003). A survey of the international empirical evidence on the tax-spend debate. Public Finance Review, 31(3), 302–324.
- Peacock, A. T., & Wiseman, J. (1961). Front matter, the growth of public expenditure in the United Kingdom. In A. T. Peacock & J. Wiseman (Eds.), The growth of public expenditure in the United Kingdom (pp. 32–51). Princeton University Press.
- Peacock, A. T., & Wiseman, J. (1979). Approaches to the analysis of government expenditure growth. Public Finance Quarterly, 7(1), 3–23. https://doi.org/10.1177/109114217900700101
- Percival, D. B., & Walden, A. T. (2000). Wavelet Methods for Time Series Analysis. Cambridge University Press.
- Phiri, A. (2017). Nonlinearities in Wagner’s law: Further evidence from South Africa. International Journal of Sustainable Economy, 9(3), 231–249. https://doi.org/10.1504/IJSE.2017.085066
- Poku, K., Opoku, E., & Agyeiwaa Ennin, P. (2022). The influence of government expenditure on economic growth in Ghana: An Ardl approach. Cogent Economics & Finance, 10(1), 2160036. https://doi.org/10.1080/23322039.2022.2160036
- Provopoulos, G., & Zambaras, A. (1991). Testing for causality between government spending and taxation. Public Choice, 68(1), 277–282. https://doi.org/10.1007/BF00173835
- Ramsey, J. B., & Lampart, C. (1998). The decomposition of economic relationships by time scale using wavelets: Expenditure and income. Studies in Nonlinear Dynamics & Econometrics, 3(1), 23–42. https://doi.org/10.2202/1558-3708.1039
- Rasaily, A., & Paudel, S. (2019). Impact of government expenditures on economic growth: Case of Nepal. International European Extended Enablement in Science, Engineering & Management, 10(6), 167–174.
- Ray, S., Pal, K. M., & Ray, I. A. (2012). A Causality Analysis on Tax-Growth Nexus in India: 1950-51 to 2011-12. Journal of Expert Systems, 1(4), 104–114.
- Reddick, C. G. (2002). Canadian Provincial budget outcomes: A long–run and short–run perspective. Financial Accountability & Management, 18(4), 355–382. https://doi.org/10.1111/1468-0408.00157
- Richter, C., & Paparas, D. (2013). The validity of Wagner’s law in Greece during the last two centuries. Applied Economics Quarterly, 59(4), 331–360. https://doi.org/10.3790/aeq.59.4.331
- Roberts, R. D. (1987). Financing public goods. Journal of Political Economy, 95(2), 420–437. https://doi.org/10.1086/261463
- Romer, D. (1986). A simple general equilibrium version of the Baumol-Tobin model. Quarterly Journal of Economics, 101(4), 663–685. https://doi.org/10.2307/1884173
- Romer, C. D., & Romer, D. H. (2009). A narrative analysis of postwar tax changes. Unpublished paper, University of California, (June). https://eml.berkeley.edu/~dromer/papers/RomerandRomerAERJune2010.pdf
- Saqib, S., Ali, T., Riaz, M. F., Anwar, S., & Aslam, A. (2014). Taxation effects on economic activity in Pakistan. Journal of Finance and Economics, 2(6), 215–219. https://doi.org/10.12691/jfe-2-6-3
- Saunoris, J. W. (2015). The dynamics of the revenue–expenditure nexus: Evidence from US State government finances. Public Finance Review, 43(1), 108–134. https://doi.org/10.1177/1091142113515051
- Saunoris, J. W., & Payne, J. E. (2010). Tax more or spend less? Asymmetries in the UK revenue–expenditure nexus. Journal of Policy Modeling, 32(4), 478–487. https://doi.org/10.1016/j.jpolmod.2010.05.012
- Scully, G. W. (1996). Taxation and economic growth in New Zealand. Pacific Economic Review, 1(2), 169–177. https://doi.org/10.1111/j.1468-0106.1996.tb00182.x
- Scully, G. W. (2003). Optimal taxation, economic growth and income inequality. Public Choice, 115(3–4), 299–312. https://doi.org/10.1023/A:1024223916710
- Sedrakyan, G. S., & Varela-Candamio, L. (2019). Wagner’s law vs. Keynes’ hypothesis in very different countries (Armenia and Spain). Journal of Policy Modeling, 41(4), 747–762. https://doi.org/10.1016/j.jpolmod.2019.02.011
- Shi, S., Hurn, S., & Phillips, P. C. (2020). Causal change detection in possibly integrated systems: Revisiting the money–income relationship. Journal of Financial Econometrics, 18(1), 158–180. https://doi.org/10.1093/jjfinec/nbz004
- Shi, S., Phillips, P. C., & Hurn, S. (2018). Change detection and the causal impact of the yield curve. Journal of Time Series Analysis, 39(6), 966–987. https://doi.org/10.1111/jtsa.12427
- Solow, R. M. (1956). A contribution to the theory of economic growth. Quarterly Journal of Economics, 70(1), 65–94. https://doi.org/10.2307/1884513
- Taha, R., Nanthakumar, L., & Colombage, S. R. (2011). The effect of economic growth on taxation revenue: The case of a newly industrialized country. International Review of Business Research Papers, 7(1), 319–329.
- Takumah, W. (2014). Cointegration and causality between tax revenue and economic growth in Ghana. International Research Journal of Marketing and Economics, 1(6), 30–44.
- Tashevska, B., Trenovski, B., & Trpkova-Nestorovska, M. (2020). The government revenue–expenditure nexus in Southeast Europe: A bootstrap panel granger-causality approach. Eastern European Economics, 58(4), 309–326. https://doi.org/10.1080/00128775.2020.1724156
- Torrence, C., & Compo, G. P. (1998). A practical guide to wavelet analysis. Bulletin of the American Meteorological Society, 79(1), 61–78. https://doi.org/10.1175/1520-0477(1998)079<0061:APGTWA>2.0.CO;2
- Tosun, M. S., & Abizadeh, S. (2005). Economic growth and tax components: An analysis of tax changes in OECD. Applied Economics, 37(19), 2251–2263. https://doi.org/10.1080/00036840500293813
- Turan, T., & Karakas, M. (2018). Asymmetries in twin deficit hypothesis: Evidence from CEE countries. Ekonomicky casopis, 66(6), 580–597.
- Vamvoukas, G. A. (2012). Panel data modelling and the tax-spend controversy in the euro zone. Applied Economics, 44(31), 4073–4085. https://doi.org/10.1080/00036846.2011.587777
- Wagner, R. E. (1977). Economic manipulation for political profit: Macroeconomic consequences and constitutional implications. Kyklos, 30(3), 395–410. https://doi.org/10.1111/j.1467-6435.1977.tb02200.x
- Wang, X., & Wen, Y. (2019). Macroeconomic effects of government spending in China. Pacific Economic Review, 24(3), 416–446. https://doi.org/10.1111/1468-0106.12242
- Widmalm, F. (2001). Tax structure and growth: Are some taxes better than others? Public Choice, 107(3–4), 199–219. https://doi.org/10.1023/A:1010340017288
- Wildavsky, A. (1988). A cultural theory of budgeting. International Journal of Public Administration, 11(6), 651–677. https://doi.org/10.1080/01900698808524608
- Williams, O. D., & Abere, S. S. (2019). Effect of government expenditure on economic growth in Nigeria. Hallmark University: Ijebu-Itele.
- Wolde‐rufael, Y. (2008). The revenue–expenditure nexus: The experience of 13 African countries. African Development Review, 20(2), 273–283. https://doi.org/10.1111/j.1467-8268.2008.00185.x
- Yinusa, O. G., Aworinde, O. B., & Oseni, I. O. (2017). The revenue-expenditure nexus in Nigeria: Asymmetric cointegration approach. South-Eastern Europe Journal of Economics, 15(1), 47–61.
- Young, A. T. (2009). Tax-spend or fiscal illusion. The Cato Journal, 29(1), 469–485.
- Zapf, M., & Payne, J. E. (2009). Asymmetric modelling of the revenue-expenditure nexus: Evidence from aggregate state and local government in the US. Applied Economics Letters, 16(9), 871–876. https://doi.org/10.1080/13504850701222095
- Zeng, J., & Du, H. (2003). Allocation of tax revenue and growth effects of taxation. In Impulse response functions. National University of Singapore, Singapore. https://citeseerx.ist.psu.edu/document?repid=rep1&type=pdf&doi=6e34d1d6148a44c9ec954b4b612b7b83fdb4c80c