
 ?Mathematical formulae have been encoded as MathML and are displayed in this HTML version using MathJax in order to improve their display. Uncheck the box to turn MathJax off. This feature requires Javascript. Click on a formula to zoom.
Abstract
Even though the Paris Agreement and the Sustainable Development Goals say that low-carbon economic growth is essential, more research must be done to determine how the tourism sector affects carbon productivity. So, to see if increased energy usage, tourism, and economic growth jointly raise carbon productivity in Kuwait, this study uses a vector error correction strategy to look at the years 1995–2020. Predictions about how sustainable tourism will affect energy efficiency, and carbon productivity improvements are also an excellent way to learn more about this subject. As the amount of carbon dioxide in the air increases, tourism will go down by 0.13 percent. Inverse cointegration is the term for this phenomenon. However, the vector error correction model showed that carbon emissions go down as the economy grows and people pay more attention to how much energy they use. Nevertheless, Granger’s theory of cause and effect says that carbon emissions, energy use, and economic growth can only lead to more tourism in one way.
1. Introduction
With the Paris Agreement’s help, countries worldwide are working together to decarbonize their economies. Still, the goal of low-carbon growth is more challenging to reach than it seems because the world’s economies, proliferating and dependent on fossil fuels, are determined to speed up growth even if it hurts the environment. As tourism’s economic importance grows, so do academics’, economists’, and policymakers’ worries about how it might affect people. This industry is now seen as an essential part of global economies because it can help shape national economies and play a vital role in a country’s progress and prosperity. Shakouri et al (Shakouri, Yazdi, Nategian, et al., Citation2017). say tourism has become essential to the world economy. Even though people have been worried about how tourism affects the economy and the environment for a long time, the industry continues to grow. Even so, tourism is celebrated as a global engine of economic growth and job creation. Many academics and government officials have been interested in the concept of “sustainable tourism” over the past two decades (Hughes et al., Citation2015; Nepal et al., Citation2019; UNWTO, Citation2018).
In today’s globalized world, developed and developing countries see tourism as a viable source of GDP growth. The tourism industry has had a substantial impact on economic growth and is currently a fast-rising economic sector worldwide (A. M. Khan et al., Citation2022). The United Nations has designated 2017 as the International Year of Sustainable Tourism for Development. This implies that governments throughout the globe must reconsider the consequences of tourism and devise strategies to encourage sustainable travel, which will help the UN achieve its Sustainable Development Goals (SDG). Furthermore, the 17 individual SDG targets have given the tourism industry a renewed sense of urgency to deal with issues such as ending poverty (SDG-1), ensuring adequate food (SDG-2), and preventing environmental destruction (SDG-15), all of which contribute to the UN’s Sustainable Development Goals (SDG).
Tourism can bring in money from other countries, which can boost the economy, create more jobs, and improve the quality of life by paying for improvements to infrastructure and public services. It supports a country’s GDP in many ways, such as through direct and indirect spending, jobs, and tax revenue, helping the country’s economy grow in the long run. In the retail sector, the transportation sector, the entertainment sector, and the hospitality sector, customers can expect honest service. Exporting natural resources can bring in more money for a country, just as much as a strong tourism industry. Oil, gas, and mineral extraction industries use up natural resources. On the other hand, tourism can be renewable if it runs well (Tuncay & Ozcan, Citation2020). Cárdenas-Garca et al (Cárdenas-García et al., Citation2015). noted that in developed countries, tourism contributes to economic growth, while Figini and Vicio (Figini & Vici, Citation2010) noted that in developing countries, tourism does not boost economic growth.
The rapid growth of the tourism industry has been linked in several studies to an increase in global carbon dioxide emissions (Diamond, Citation2005; G. Zhang et al., Citation2018; Hossain, Citation2011; Q. Wang et al., Citation2016; Yu et al., Citation2012). However, the tourism industry’s continued growth has led to urbanization and industrialization, which has never been seen before (Schubert et al., Citation2011). Industrialization is likely to keep expanding. However, this is a tricky situation because, according to Schubert et al (Dogru & Bulut, Citation2018), this expansion will likely result in increased carbon emissions worldwide. In most cases, increasing tourism to a region’s hotspots is good for the economy (Akalpler & Hove, Citation2019; J. Zhang & Zhang, Citation2018; Nie et al., Citation2019; Zaman et al., Citation2016), but it also increases the region’s energy demand and greenhouse gas emissions. The governments of countries whose income comes from tourism know precisely what happens when tourists use too much energy.
Furthermore, Zaman et al (Zaman et al., Citation2016). contend that promoting tourism as part of the energy-environment nexus is critical for long-term economic growth. According to Ali et al (Ali et al., Citation2018), tourism complements a region’s GDP, GNP, employment rate, and public works investment. However, understanding the relevance of tourism for solid economic growth requires considering carbon emissions, climate change, environmental challenges, and the industry’s support for expansion. As a result, as the tourism sector expands, authorities will want assistance in addressing new issues about the most efficient ways of encouraging economic growth while reducing carbon emissions (Sharif et al., Citation2017b). If the positive economic impact of tourism is most evident, the negative environmental impact must be the most visible. In comparison to the economic benefit of tourism (Holden, Citation2003). As a result, one of the policy concerns for sustainable tourism is the relationship between tourism industry expansion, energy consumption, and environmental degradation.
Tourism-driven economic growth may have a variety of environmental consequences. If the Kuznets curve idea for the environment is accurate, then as wealth grows, the environment may initially deteriorate but will improve at a certain point. Nature has a great deal to say about tourism. The Kuznets curve hypothesis says that the trend of companies trying to attract tourists from all over the world could improve the quality of the environment. This may result in a move toward ecotourism, in which more trees are planted and natural beauty is protected. Carbon emissions and other environmental damage can be reduced through ecological systems. However, new road infrastructure and other hotel facilities may soon impact the ecosystem.
Little is written about how tourism has helped Kuwait’s economy grow. So, this study looks into what happens to Kuwait’s natural environment when the economy grows, more people visit, and more energy is used. The average high temperature in Kuwait is over 45 degrees Celsius for three months of the year. This makes it one of the hottest cities in the Gulf area during the summer. Its primary source of income comes from selling oil products. Fertilizers and crude oil are essential things it sends abroad. People believe that the Burgan field in Kuwait has more than 70 billion barrels of proven oil reserves. The 1991 oil fires in Kuwait resulted in more than 500 oil lakes with a total surface area of about 35.7 km2. The land in the east and southeast of Kuwait became polluted and unusable for cultivation due to the oil and soot that fell to the ground. Due to the buildup of sand and oil waste, vast areas of the Kuwaiti desert have taken on a semi-asphalt-like appearance. During the Gulf War, several oil leaks severely damaged Kuwait’s ecology.
Thus, the primary objective of this research is to elaborate on the connection between Carbon emissions, energy consumption, economic growth, and the expansion of the tourist industry in Kuwait. Also, if we look at how the above things work together, we might learn something valuable about Kuwait’s carbon emissions.
2. Literature review
Over the past few decades, environmental economists, policymakers, and academics have spent much time and money studying environmental degradation’s social and economic causes. Many studies have looked at how economic growth affects carbon emissions, but only a few have looked at how tourism affects the quality of the environment. Gossling (Gössling, Citation2002) says that there are five main ways that tourism hurts the environment: (i) ecological footprints on land use and land changes; (ii) energy-induced emissions; (iii) biodiversity loss; (iv) environmental health hazards; and (v) global perceptions of the psychological effects of tourism-induced emissions. Kreishan (Kreishan, Citation2011) did a real-world test of the tourism-led growth hypothesis (TLGH) from 1990 to 2014 using the autoregressive distributed lag (ARDL) model. He found that tourism in Bahrain was linked to the growth of the country’s gross domestic product (GDP), and he said this was a one-way Granger causal relationship. The economy of Bahrain is also significantly affected by this. An essential point that he made was that strategic tourism promotion could help Bahrain’s economy grow.
Lee and Bhahmasrene (Lee & Brahmasrene, Citation2013) looked at the role of tourism and foreign direct investment (FDI) in the link between carbon emissions and economic growth. They found a negative correlation between tourism and carbon emissions in the European Union. In contrast, Katircioglu et al (S. T. Katircioglu, Feridun, et al., Citation2014). conducted similar research using Cyprus as an example. Also, they discovered that tourism is a significant driver of energy consumption. León et al (León et al., Citation2014). used STIRPAT framework data from 1998–2006 to analyze the impact of tourism on reducing carbon dioxide emissions in 31 developing countries and 14 developed ones. This research showed that the adverse effects of tourism are more pronounced in economically advanced nations. Katircioglu (S. T. Katircioglu, Fethi, et al., Citation2014) found that Turkey’s tourism industry uses more energy and causes more pollution, which De Vita et al (De Vita et al., Citation2015). also found true. Katircioglu et al (S. Katircioglu et al., Citation2020). looked at the relationship between tourism and emissions in Northern Cyprus by using annual data from 1977 to 2015. Using the econometric method of autoregressive distributed lag (ARDL), the researchers found that an increase in tourism has a positive, significant, but inelastic effect on the country’s emissions (β = 0.351, p < 0.05). Pollution levels are also affected by how much energy is used and how much the economy grows. Katircioglu (S. T. Katircioglu, Fethi, et al., Citation2014) does similar research for Singapore. In contrast to what had been found before, he found that tourism lowers pollution into the air. His conclusion is backed up by a survey that shows how green energy investments in the tourism industry have paid off.
From 1988–2008, Ozturk et al (Ozturk et al., Citation2016). analyzed tourism-related emissions in 144 countries using the generalized method of moments (GMM). Tourist earnings in countries with high and upper-middle incomes were found to be correlated with environmental quality. The study also confirmed that the relationship between the ecological footprints of high- and upper-middle-income countries and specific growth factors is like an upside-down U. Paramati et al (Zaman et al., Citation2016). say that international travel between 1995 and 2012 in both developing and developed economies caused the environment to get worse faster. Sharif et al (Sharif et al., Citation2017a). looked at the relationship between carbon dioxide emissions and economic growth in Pakistan from 1972 to 2013, which was caused by tourism. The results of this study show that a country’s carbon dioxide emissions are linked to how many tourists it gets. The environmental impact of tourism in that country has been demonstrated. The effects of tourism on the environment in Turkey from 1990 to 2014 were examined by Eyuboglu and Uzar (Eyuboglu & Uzar, Citation2020); they found that the number of foreign tourists and carbon dioxide emissions increased. Khan et al (A. Khan et al., Citation2020). looked into the role of tourism and natural resources in reducing carbon dioxide emissions in 51 Belt and Road Initiative (BRI) countries between 1990 and 2016. They discovered evidence supporting the tourism push emission hypothesis. From 1975 to 2014, Nepal’s environmental situation deteriorated rapidly, which was confirmed by Nepal et al (Nepal et al., Citation2019), which suggests that the trajectory of tourism growth is linked to this. In 31 African countries, Ehigiamusoe (Ehigiamusoe, Citation2020) found that tourism and the environment have an inverted “U-shaped” relationship. At first, tourism improved the environment’s health, but as it expanded, it began to degrade the quality of the environment.
While investigating the long-term effects of tourism on environmental quality, Azam et al (Azam et al., Citation2018). showed the positive role of the tourism sector on environmental quality in Thailand and Singapore from 1990 to 2014. While researching the effect of tourism growth on carbon dioxide emissions in a few Asia-Pacific countries between 1995 and 2013, Shakouri et al (Shakouri, Yazdi, & Ghorchebigi, Citation2017). found that it was positive for environmental health. Kocak et al (Koçak et al., Citation2020). looked at the effects of tourist arrivals and spending on carbon dioxide emissions in the top 10 most visited countries using annual data from 1995 to 2014. This research found that while revenue from tourists helps reduce carbon dioxide emissions, their presence harms the environment. When Liu et al (Liu et al., Citation2019). looked at the changing relationship between carbon dioxide emissions, energy use, and international tourism in Pakistan from 1980 to 2016, they found that the number of tourists did not affect the quality of the environment. According to research by Katircioglu et al (S. Katircioglu et al., Citation2018), the top 10 tourist destinations experience less environmental impact as tourism grows. The relationship between tourism development and ecological footprint looks like an inverted U. Climate change is increasing the likelihood that people from other countries will travel to small island states like Cyprus and Malta, according to research by Katircioglu et al (S. Katircioglu et al., Citation2019).
Three Iranian researchers, Sadin, Jahandari, & Hosseini (Sadin et al., Citation2015), found that more tourism in rural areas hurts the environment in ways that should have been planned. The leading causes are using up too many resources, putting out more carbon dioxide, and running out of natural resources. Ozturk (Ozturk, Citation2016) looked at the relationship between energy and demand, carbon emissions, tourism indicators, health, and wealth in a panel of 34 countries. He did this by looking at time series data from 2005 to 2013. As the results show, carbon dioxide emissions also rose sharply along with the growth in tourism indicators, highlighting the need for sustainable tourism reforms in the area. Researchers Farmaki, Altinay, Botterill, and Hilke (Farmaki et al., Citation2015) looked at the political and economic factors that affected tourism growth in Cyprus in 2015. Islam (Islam, Citation2015) examined the various impacts of tourism expansion, including the depletion of natural resources, biodiversity loss, garbage disposal issues, and natural and environmental shifts.
Further, increased tourism affects water transportation, which harms Bangladesh’s marine and aquatic ecosystems. The effects of tourism transportation on GDP, energy consumption (EC), and carbon dioxide emissions (CEs) are studied by Zaman et al (Nie et al., Citation2019). The findings show that as GDP. per capita increases, so does the number of CEs and the rate of environmental degradation. The research shows that international tourism spending and income positively affect a country’s carbon dioxide emissions and GDP per capita.
Researchers like Lensen et al (Lensen et al., Citation2018), Quan et al (Quan et al., Citation2022), and Wang and Luo (H. Wang & Luo, Citation2022) attempted to calculate the number of carbon emissions that are associated with the tourism sector for 160 economies from 2009 to 2013. They found that tourism’s global carbon footprint has increased from 3.9 to 4.5 GtCO2e, four times more than previously estimated. They estimated that this increase accounts for approximately 8% of global greenhouse gas emissions. As a result, tourism, associated with high carbon intensity and continues to grow, will constitute an increasingly significant portion of greenhouse gas emissions. Transportation, shopping, and food supply are three of the biggest causes of carbon emissions that can be linked to tourism. High-income countries are responsible for most of this carbon footprint. As a result, the rate at which tourism is expanding is higher than the rate at which technology connected to tourism is becoming less carbon-intensive.
The economic effects of tourism are prominent and promising. Tourism can have positive effects, but it also has serious negative environmental consequences. For their analysis, Khan et al (Shakeel & Salam, Citation2020). used ARDL panels covering the years 1995–2019 to look at the effects of tourism on economic growth, energy use, oil consumption, and carbon emissions in 18 of the top 20 travel and tourism contributors countries. The panel ARDL result indicates −0.22 and −0.48% in the long and short runs, respectively, with a rate of adjustment of −0.52 in the direction of equilibrium, demonstrating that endogenous variables have a significant influence in both periods and a positive impact on environmental degradation, except for tourism. In the simultaneous quantile regression, the 50th and 75th percentiles of the distribution show that tourism has a negative effect. This is different from the results of the PMG.
Several types of research and economic indicators (Shakeel & Salam, Citation2020; Zeshan & Shakeel, Citation2020) have shown that energy and economic growth go hand in hand. For every 1% growth in GDP, there is a 0.323-point rise in energy consumption per person, which leads to a 0.447-point rise in pollution (U. Khan, Citation2020). By putting these two things together with tourism, important information could be found about how to cut carbon emissions in Kuwait. Research shows that tourism, economic growth, energy use, and greenhouse gas emissions are linked. This review of the literature includes discussions of a few of these investigations. We use the vector error correction method to look at data from concise time horizons to long time horizons to understand better how endogenous and exogenous factors in the economy of the country under study interact. This study adds to the existing literature by addressing pressing concerns from the vantage point of developing an environmentally responsible tourism policy.
3. Methodology
3.1. Data subsection
This model draws information from the World Development Indicators (WDI) and the British Petroleum (BP) Statistics. Statistics on primary energy consumption and carbon dioxide emissions from energy are from BP, while statistics on economic growth (in terms of GDP in current US dollars) and tourism growth (in terms of international tourism receipts) are from World Development Indicators. The study covers the years 1995–2020 because there needs to be more information in the database to go back in time. It should be sufficient to demonstrate the variables’ short- and long-term interrelationships.
3.2. Model specification
Carbon emissions, energy consumption, economic growth, and tourist numbers are just some of the study variables analyzed using econometric models used by other researchers before (A. M. Khan et al., Citation2022; Zeshan & Shakeel, Citation2020). The model can be formulated as follows:
For use in an econometric model, numerous studies (A. M. Khan et al., Citation2021; Murshed et al., Citation2022; U. Khan et al., Citation2022) have advocated normalizing data series first. A natural logarithmic transformation of all the variables in our study could help keep measurements consistent across all variables, avoiding problems with distributional properties and may cause stationarity in the series of variables. This is especially true for carbon dioxide emissions from energy and primary energy consumption, measured as indices, and other variables, measured in different units. Thus, all the variables are used in a real term and transformed into a logarithmic function:
This can also be characterized in a log-linear econometric format:
Where β0: is the constant term, β1: is the coefficient of the variable (energy consumption), β2 is the coefficient of variables (economic growth), β3 is the coefficient of variables (tourism growth), t: The time trend and ɛt: The random error term assumed to be normal, identically and independently distributed.
Stationarity tests are used to find out the order in which each variable in a system integrates. Many stationary tests are used in analytical and empirical research to determine the order of variables that consider all the different factors. The ADF test and the PP test are going to be utilized in our empirical study of stationery. Both of these tests are going to be carried out.
The following regression estimates the general form of the A.D.F. test:
The following regression estimates the general form of the P.P. test
Where Δ is the first difference operator, y is a time series, t is a linear time trend, is a constant, is the optimum number of lags in the dependent variable, and
is the random error term.
The rule says that the ADF and PP statistical tests must be better than the critical value at different levels for each variable. At the same time, this variable’s probability must be lower than 5%. This rule applies to these two tests. In this case, the variable in question is stationary at the level and order of integration given.
Two phases use cointegration analysis. The first step is to figure out how many lags our model has. The second step is to use cointegration tests to look for interactions between variables that are cointegrated.
A set of information criteria, including the AIC, SC, HQ, LR, and FPE, is expected to determine the number of lags in our estimate. We will use the SC criterion in this case because it has been used in several empirical studies. The SC criteria indicate that the number of lags in the estimated sets of variables is equal to two. Thus, we proceed to the following stage. It uses the cointegration test to figure out how many cointegration relationships are between the different variables.
In order to count the number of cointegrating vectors, we first need to know the order of integration, which we do by calculating two statistics called trace statistics s () and maximal Eigenvalues (
). This V.A.R. is calculated using trace statistics.
On the other hand, in maximum Eigenvalue, the following V.A.R. is estimated:
Where the vector of the variables involved in the model, and
is in the order of autoregression. In Johansen’s cointegration test, the null hypothesis states there is no cointegrating vector (r = 0), and the alternate hypothesis makes an indication of one or more cointegrating vectors (r > 1)
The econometric guideline for this test says that a cointegration link can be confirmed if the trace statistic is larger than the critical value and has a probability of less than 5%. Because the variables were cointegrated, we used the error correction model to determine their short-term and long-term effects.
Long run Model can be expressed as:
Short run Model can be expressed as:
Where;
lnc = log value of carbon dioxide emission from energy
lng = log value of Economic Growth measured in terms of GDP (current US$)
lnen = log value of primary energy consumption
lnr = log value of tourism growth
k-1 = the optimal lag length is reduced by 1
= short-run dynamic coefficients of the model’s adjustment long-run equilibrium
λi = speed of adjustment parameter with a negative sign
ECTt-1 = the error correction term is the lagged value of the residuals obtained from the cointegration regression of the dependent variable on the regressors. Contains long-run information derived from the long-run cointegrating relationship.
= residuals in the equations
Using the Granger causality test, we can examine the alternative hypothesis that y does cause c. To achieve this, we examine direct and indirect relationships among our variables. The first step is to select the lags of y to utilize in a univariate autoregressive model.
The autoregression is then improved by incorporating lagged x values:
Any statistically significant lag value of y is retained in this regression analysis if it contributes to the overall predictive ability of the F-test (where the null hypothesis has no explanatory power). In the above-improved regression equation, the lagged value of y is only crucial between P and q, which are the minimum and maximum lag lengths.
4. Results
4.1. Descriptive statistics & correlation matrix
In Table , which shows log data correlation analysis and descriptive statistics, the results of the econometric analysis are shown and talked about. Carbon emissions from energy have to mean, median, maximum, and minimum values of 4.228, 4.34, 4.642, and 3.51; primary energy consumption has these values as well: 0.104, 0.19, 0.546, and −0.62; economic growth has these values as well: 25.07, 25.4, 25.88, and 23.98; and tourism growth has these values as well: 20.08, 20.1, 20.9, and 19.47. All pass the Jarque-Bera test for normality and stability. Also shown in Table is the correlation matrix, demonstrating that all the variables are highly correlated.
Table 1. Descriptive statistics with the correlation matrix
4.2. Stationarity test
Using the Augmented Dickey-Fuller and Phillips-Perron unit tests described in Table , the stationarity test comes after the basic statistics test is performed. At the second order of integration, the dependent variable and one of the independent variables became stationary as per the ADF test. In contrast, the Phillips-Perrons test indicates that all the variables became stable at the first order of integration. Thus, the investigator decided to go with the second order of integration and stopped at the I (2) level, where all variables stayed stationary. Hence, it paved the way to use the Johansen cointegration test for further analysis.
Table 2. Unit root test by augmented dickey fuller & Phillips Perron
4.3. Cointegrationanalysis
The results of the Johansen cointegration test are shown in Table . Both primary energy consumption (LNEN) and economic growth (LNG) had a positive effect on carbon emissions from energy (LNC) over the long term. On the other hand, tourism growth (LNR) has reciprocity in its findings during long-run convergence. Even though the factors are statistically significant, the model’s null assumption of no cointegration is wrong compared to the alternative that there is a cointegration link at a lag of 1.
Table 3. Johansen cointegration test for CARBON EMISSION as a dependent variable
The short-run and long-run equations connecting carbon dioxide emissions from energy, primary energy consumption, economic growth, and tourism revenues are supported by the cointegration test result at the 0.05 level. The following is a form of the normalized cointegrating coefficient that describes this phenomenon:
Our goal is a long-term change in carbon dioxide emissions from energy, and primary energy consumption has a positive and statistically significant effect on this variable. When primary energy consumption rises by one percent, carbon dioxide emissions from power plants rise by 1.02 percent. Economic growth also has a comparable impact, with a 0.04 percentage point rise in energy-related carbon dioxide emissions for every percentage point of growth in GDP. However, carbon dioxide emissions from energy are negatively correlated with tourism growth. Johansen’s cointegration test shows that every variable is cointegrated; hence, we need to employ the VECM to conduct an additional hypothesis test. The ECT indicates how quickly the model will make corrections to return to equilibrium after being perturbed. It is possible to express the ECT coefficients in terms of:
Short-run dynamics converge to long-run equilibrium, as shown by the negative and statistically significant ECT coefficients for carbon dioxide emissions from energy, primary energy consumption, and tourism growth. In a long-term disequilibrium, the corresponding adjustment coefficients were 0.68%, 0.37%, and 4.55%. While for economic growth, the adjustment coefficient is positive and modest, indicating no significant corrections to the deviating path from long-run equilibrium. The following notation can be used to express the short-run equation model:
With a negative ECT, we can assume that primary energy use, growth in tourism, and carbon emissions from energy use all cause each other in the long run. A negative sign for the coefficient indicates the ability to return to equilibrium. When marked with a plus sign, economic expansion deviates from equilibrium. The short-run coefficient shows that carbon emissions increased from the previous year. Carbon emissions are expected to rise by 2.92 percent. As primary energy consumption rises, carbon emissions from power plants fall by 2.76 percent. For every percentage point of economic growth, carbon emissions from the energy sector go down by 0.12%, which is a good sign for keeping the promise made in the Paris Agreement. However, they go up by 0.03% for every percentage point of tourism growth.
4.4. Granger causality test
Table shows the results of the pairwise Granger causality test, where sign ≠ means no causal relationship among the variables and sign →means one-way causation exist among the variable, which shows that carbon dioxide emissions from energy, primary energy consumption, and economic growth all led to tourism growth in one direction.
Table 4. Granger causality pairwise tests
4.5. Impulse response function
To ensure that the Impulse Response Function (IRF) was well within the 95% confidence interval, we ran 999 iterations of the standard percentile bootstrap. We measured LNC’s sensitivity to a one-standard-deviation shock (Figure ). A sharp increase over periods 1 and 2 on an IRF graph indicated rapid growth in the short term but a levelling off in the long term. This means that the temporary increase in LNC caused by the spike in carbon dioxide emissions from energy-related LNC will not significantly impact global temperatures. The LNC and LNEN looked very similar on an IRF graph. This indicates that LNC will respond favourably to LNEN shortly. The graph shows that GDP growth over the short, medium, and long terms for periods 1, 2, and 3 rises, peaks, and then remain constant. These results show that LNG is preferable to LNC. However, stability appears in the medium term. The short-term impact of tourism growth on LNC was negative during the first two periods, positive during the third, and stable by the fourth.
Figure 1. Impulse response function.
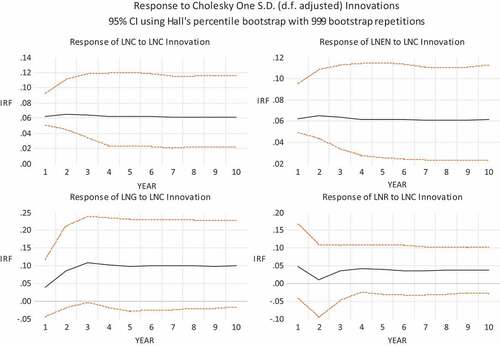
Figure depicts the impulse response function (IRF). The IRF of carbon emission with itself is shown in a), the IRF of energy consumption to carbon consumption is shown in b), the IRF of economic growth to carbon emissions is shown in c), and the IRF of tourism growth to carbon emissions is shown in d).
4.6. Variance decomposition analysis
The variance decomposition is shown in Table . We find that shocks account for the total variation in carbon emissions in the first year, but their effectiveness diminishes over time. Energy consumption accounts for less than a 5% variation in carbon emissions except in the 3rd, fourth, and fifth years. In comparison, energy consumption accounts for 5.04%, 5.48%, and 5.22% variations in carbon emissions in the 3rd, fourth, and fifth years, respectively. Economic growth is responsible for a continuous increase in carbon emissions, beginning at 4.59% in the second year and reaching 19.04% in the tenth year. On the other hand, tourism accounts for 1.65%, 7.29%, 13.5%, 16.56%, 17.59%, 18.04%, 18.44%, 18.81%, and 19.1% of carbon variation. Tourism accounts for more variation in carbon in the model, other than economic growth. Tourism and economic growth contribute more to emissions in the countries looked at.
Table 5. Variance decomposition of carbon emissions
4.7. Stability and residual tests
The results of the diagnostic tests are shown in Table and Figure . The Breusch-Godfrey serial correlation LM test, the Breusch-Pagan-Godfrey heteroscedasticity test, the Jarque-Bera normality test, and the CUSUM and CUSUM square tests are all significant. This means there is no serial correlation and homoscedasticity, and the series is normally distributed.
Figure 2. Plot of CUSUM and CUSUM square test.
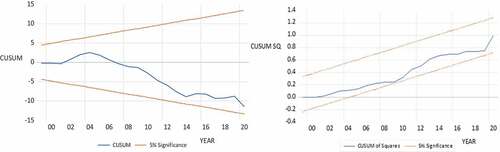
Table 6. Summary of diagnostics test
Figure represents the CUSUM plot and shows that the variables are within the 95 percentile. This is shown by the blue line, a long way below the red line representing the 95 percentile. Similarly, the blue line of the CUSUM square falls comfortably in the middle of the 95 percentile range’s two red lines.
5. Conclusion & suggestions
This study looked at the long-term, causal, and cross-temporal links between tourism, energy use, economic growth, and carbon emissions in Kuwait using data from 1995 to 2020. The Johansen cointegration shows a positive relationship between energy consumption and GDP growth, but an increase in tourism harms carbon emissions. As the amount of carbon dioxide in the air increases, tourism growth will slow by 0.13 percent. This is called “inverse cointegration.” The short-run coefficient shows that carbon emissions have increased since last year, which is what the vector error correction model shows. People think that carbon emissions will go up by 2.92 percent. When the amount of primary energy used goes up, carbon dioxide emissions from power plants go down by 2.76 percent. Carbon emissions from the energy sector go down by 0.12% for every percentage point of economic growth. This could be because of the Paris agreement and the Sustainable Development Goals. However, carbon emissions rise by 0.03% for every percentage point that tourism grows, and other researchers (Nie et al., Citation2019; Ozturk et al., Citation2016; S. Katircioglu et al., Citation2020; Shakeel & Salam, Citation2020; Sharif et al., Citation2017a) back up this finding.
On the other hand, Granger’s theory of causality says that carbon emissions, energy use, and economic growth all lead to more tourism, but only in one direction. The impulse response function shows that in the short term, say 1–2 periods, all variables show increasing trends but gradually started to be stable in the long run, except for tourism growth, which shows a decline in 1–2 periods and then started increasing trends until five periods and then became stable. Based on variance decomposition analysis, economic growth is the cause of a steady rise in carbon emissions, from 4.59 percent in the second year to 19.04 percent in the tenth year. On the other hand, tourism accounts for 1.65%, 7.29%, 13.5%, 16.56%, 17.59%, 18.04%, 18.44%, 18.81%, and 19.1% of carbon variation other than economic growth. Tourism and economic growth contribute more to emissions in the countries looked at than energy consumption. The new insight that a negative link between tourism growth and environmental damage backs up Kuwait’s current policies in favour of sustainable tourism practices. After the results are released, a few policy suggestions for developing the tourism industry can be made, focusing on policies that align with the full implementation of sustainability. Several plans can then be developed to keep low-carbon tourism models running efficiently. First, the government should take the initiative to spread information about ecotourism among the general public.
Nevertheless, in places where carbon emissions are a big problem, governments should develop intelligent rules about using natural resources in tourist areas in a way that is good for the environment. They should also devise other plans to get enough money to invest in a high-tech tourism model that uses less carbon. Carbon taxes help reduce environmental damage and protect natural resources in tourist hotspots. The current study can only partially explain what is happening because it only looks at a small part of the world. Future research can fix this using larger panel datasets and more advanced econometric methods.
Acknowledgments
Thanks to the Managing editor, guest editors and reviewers.
Disclosure statement
No potential conflict of interest was reported by the authors.
Data availability statement
The data will be available on the World Bank data website at https://data.worldbank.org/
Additional information
Funding
References
- Akalpler, E., & Hove, S. (2019). Carbon emissions, energy use, real G.D.P. per capita and trade matrix in the Indian economy-an ARDL approach. Energy, 168, 1081–17. https://doi.org/10.1016/j.energy.2018.12.012
- Ali, Q., Khan, M. T. I., & Khan, M. N. I. (2018). Dynamics between financial development, tourism, sanitation, renewable energy, trade and total reserves in 19 Asia cooperation dialogue members. Journal of Cleaner Production, 179, 114–131. https://doi.org/10.1016/j.jclepro.2018.01.066
- Azam, M., Mahmudul Alam, M., & Haroon Hafeez, M. (2018). Effect of tourism on environmental pollution: Further evidence from Malaysia, Singapore and Thailand. Journal of Cleaner Production, 190, 330–338. https://doi.org/10.1016/j.jclepro.2018.04.168
- Cárdenas-García, P. J., Sánchez-Rivero, M., & Pulido-Fernández, J. I. (2015). Does tourism growth infuence economic development? Journal of Travel Research, 54(2), 206–221. https://doi.org/10.1177/0047287513514297
- De Vita, G., Katircioglu, S., Altinay, L., Fethi, S., & Mercan, M. (2015). Revisiting the environmental Kuznets curve hypothesis in a tourism development context. Environmental Science & Pollution Research, 22(21), 16652–16663. https://doi.org/10.1007/s11356-015-4861-4
- Diamond, J. (2005). Tourism’s role in economic development: The case re-examined. Economic Development & Cultural Change, 25(3), 539–553. https://doi.org/10.1086/450969
- Dogru, T., & Bulut, U. (2018). Is tourism an engine for economic recovery? Theory and empirical evidence. Tourism Management, 67, 425–434. https://doi.org/10.1016/j.tourman.2017.06.014
- Ehigiamusoe, K. U. (2020). Tourism, growth and environment: Analysis of non-linear and moderating effects. Journal of Sustainable Tourism, 28(8), 1174–1192. https://doi.org/10.1080/09669582.2020.1729164
- Eyuboglu, K., & Uzar, U. (2020). The impact of tourism on CO2 emission in Turkey. Current Issues in Tourism, 23(13), 1631–1645. https://doi.org/10.1080/13683500.2019.1636006
- Farmaki, A., Altinay, L., Botterill, D., & Hilke, S. (2015). Politics and sustainable tourism: The case of Cyprus. Tourism Management, 47, 178–190. https://doi.org/10.1016/j.tourman.2014.09.019
- Figini, P., & Vici, L. (2010). Tourism and growth in a cross section of countries. Tour Econ, 16(4), 789–805. https://doi.org/10.5367/te.2010.0009
- Gössling, S. (2002). Global environmental consequences of tourism. Global Environmental Change, 12(4), 283–302. https://doi.org/10.1016/S0959-3780(02)00044-4
- Holden, A. (2003). In need of new environmental ethics for tourism? Annals of Tourism Research, 30(1), 94–108. https://doi.org/10.1016/S0160-7383(02)00030-0
- Hossain, S. (2011). Panel estimation for CO2 emissions, energy consumption, economic growth, trade openness and urbanization of newly industrialized countries. Energy Policy, 39(11), 6991–6999. https://doi.org/10.1016/j.enpol.2011.07.042
- Hughes, M., Weaver, D., & Pforr, C. (2015, The practice of sustainable tourism: Resolving the paradox. Routledge. http://Saarinen J (2006). Traditions of sustainability in tourism studies. Ann Tour Res, 33(4), 1121–1140. https://doi.org/10.1016/j.annals. 2006.06.007).
- Islam, M. S. (2015). Study on factors influencing tourism: Way forward for sustainable tourism in Bangladesh. Journal of Tourism, Hospitality and Sports, 6, 1–13.
- Katircioglu, S., Cizreliogullari, M. N., & Katircioglu, S. (2019). Estimating the role of climate changes on international tourist flows: Evidence from Mediterranean Island States. Environmental Science & Pollution Research, 26(14), 14393–14399. https://doi.org/10.1007/s11356-019-04750-w
- Katircioglu, S. T., Feridun, M., & Kilinc, C. (2014). Estimating tourism-induced energy consumption and CO2 emissions: The case of Cyprus. Renewable & Sustainable Energy Reviews, 29, 634–640. https://doi.org/10.1016/j.rser.2013.09.004
- Katircioglu, S. T., Fethi, S., Kalmaz, D. B., Caglar, D., & Taspinar, N. (2014). Energy consumption, international trade, and real income in the USA: An empirical investigation using conditional error correction models. Journal of Renewable and Sustainable Energy, 6(6), 063116. https://doi.org/10.1063/1.4904433
- Katircioglu, S., Gokmenoglu, K. K., & Eren, B. M. (2018). Testing the role of tourism development in ecological footprint quality: Evidence from top 10 tourist destinations. Environmental Science & Pollution Research, 25(33), 33611–33619. https://doi.org/10.1007/s11356-018-3324-0
- Katircioglu, S., Saqib, N., Katircioglu, S., Kilinc, C. C., & Gul, H. (2020). Estimating the effects of tourism growth on emission pollutants: Empirical evidence from a small island, Cyprus. Air Quality, Atmosphere & Health, 13(4), 391–397. https://doi.org/10.1007/s11869-020-00803-z
- Khan, U. (2020). Does tourism boost economic growth? Evidence from Italy. International Journal of Economics & Business Administration, 8(4), 214–222. https://doi.org/10.35808/ijeba/581
- Khan, A. M., Basit, A., Khan, U., & Khan, M. K. (2022). The progressive correlation between carbon emission, economic growth, energy use, and oil consumption by the most prominent contributors to travel and tourism G.D.P.s. Frontiers in Environmental Science, 10. https://doi.org/10.3389/fenvs.2022.945648
- Khan, A., Chenggang, Y., Hussain, J., Bano, S., & Nawaz, A. (2020). Natural resources, tourism development, and energy-growth-CO2 emission nexus: A simultaneity modeling analysis of B.R.I. countries. Resources Policy, 68, 101751. https://doi.org/10.1016/j.resourpol.2020.101751
- Khan, U., Khan, A. M, Khan, M. S., Ahmed, P., Haque, A., & Parvin, R. A. (2022). Are the impacts of renewable energy use on load capacity factors homogeneous for developed and developing nations? Evidence from the G7 and E7 nations. Environmental Science & Pollution Research, 30(9), 24629–24640. https://doi.org/10.1007/s11356-022-24002-8
- Khan, A. M., Naseem, S., & Khan, U. (2021). Tourism-growth nexus on individual cum dynamic panel approach for five G.C.C. Countries International Journal of Entrepreneurship, 25, S (1. https://www.abacademies.org/articles/tourism-industry-and-its-impact-on-the-economic-growth-of-five-gcc-countries.pdf
- Koçak, E., Ulucak, R., & Ulucak, Z. Ş. (2020). The impact of tourism developments on CO2 emissions: An advanced panel data estimation. Tourism Management Perspectives, 33, 100611. https://doi.org/10.1016/j.tmp.2019.100611
- Kreishan, F. M. (2011). Empirical study of tourism and economic growth of Bahrain: An ARDL bounds testing approach. International Journal of Economics and Finance, 7(11), 1–9. https://doi.org/10.5539/ijef.v7n11p1
- Lee, J. W., & Brahmasrene, T. (2013). Investigating the influence of tourism on economic growth and carbon emissions: Evidence from panel analysis of the European Union. Tourism Management, 38, 69–76. https://doi.org/10.1016/j.tourman.2013.02.016
- Lensen, M., Sun, Y. Y., Faturay, F., Ting, Y. P., Geschke, A., & Malik, A. (2018). The carbon footprint of global tourism. Nature Climate Change, 8(6), 522. https://doi.org/10.1038/s41558-018-0141-x
- León, C. J., Arana, J. E., & Alemán, A. H. (2014). CO2 emissions and tourism in developed and less developed countries. Applied Economics Letters, 21(16), 1169–1173. https://doi.org/10.1080/13504851.2014.916376
- Liu, Y., Kumail, T., Ali, W., & Sadiq, F. (2019). The dynamic relationship between CO2 emission, international tourism and energy consumption in Pakistan: A cointegration approach. Tourism Review, 74(4), 761–779. https://doi.org/10.1108/TR-01-2019-0006
- Murshed, M., Khan, U., Khan, A. M., & Ozturk, I. (2022). Can energy productivity gains harness the carbon dioxide inhibiting agenda of the next 11 countries? Implications for achieving sustainable development, sustainable development. Sustainable Development, 31(1), 307–320. https://doi.org/10.1002/sd.2393
- Nepal, R., Irsyad, M. I. A., & Nepal, S. K. (2019). Tourist arrivals, energy consumption and pollutant emissions in a developing economy– implications for sustainable tourism. Tourism Management, 72, 145–154. https://doi.org/10.1016/j.tourman.2018.08.025
- Nie, Y., Li, Q., Wang, E., & Zhang, T. (2019). Study of the nonlinear relations between economic growth and carbon dioxide emissions in the Eastern, central and western regions of China. Journal of Cleaner Production, 219, 713–722. https://doi.org/10.1016/j.jclepro.2019.01.164
- Ozturk, I. (2016). The relationships among tourism development, energy demand, and growth factors in developed and developing countries. International Journal of Sustainable Development & World Ecology, 23(2), 122–131. https://doi.org/10.1080/13504509.2015.1092000
- Ozturk, I., Al-Mulali, U., & Saboori, B. (2016). Investigating the environmental Kuznets curve hypothesis: The role of tourism and ecological footprint. Environmental Science & Pollution Research, 23(2), 1916–1928. https://doi.org/10.1007/s11356-015-5447-x
- Quan, Q., Liang, W., Yan, D., & Lei, J. (2022). Influences of joint action of natural and social factors on atmospheric process of hydrological cycle in inner Mongolia, China. Urban Climate, 41, 101043. https://doi.org/10.1016/j.uclim.2021.101043
- Sadin, H., Jahandari, H., & Hosseini, S. N. (2015). Economical, social & environmental effects & consequences of development of rural tourism. International Journal of Modern Management and Foresight, 2(2), 76–81.
- Schubert, S. F., Brida, J. G., & Risso, W. A. (2011). The impacts of international tourism demand on economic growth of small economies dependent on tourism. Tourism Management, 32(2), 377–385. https://doi.org/10.1016/j.tourman.2010.03.007
- Shakeel, M., & Salam, A. (2020). Energy-GDP-exports nexus and energy conservation: Evidence from Pakistan and South Asia. Environmental Science & Pollution Research, 27(22), 27807–27818. https://doi.org/10.1007/s11356-020-08932-9
- Shakouri, B., Yazdi, S. K., & Ghorchebigi, E. (2017). Does tourism development promote CO2 emissions? Anatolia, 28(3), 444–452. https://doi.org/10.1080/13032917.2017.1335648
- Shakouri, B., Yazdi, S. K., Nategian, N., & Shikhrezaei, N. (2017). The relation between international tourism and economic growth. Journal of Tourism & Hospitality, 6(4), 1–7. https://doi.org/10.4172/2167-0269.1000295
- Sharif, A., Afshan, S., & Nisha, N. (2017a). Impact of tourism on CO2 emission: Evidence from Pakistan. Asia Pacific Journal of Tourism Research, 22(4), 408–421. https://doi.org/10.1080/10941665.2016.1273960/
- Sharif, A., Afshan, S., & Nisha, N. (2017b). Impact of tourism on CO2 emission: Evidence from Pakistan. Asia Pacific Journal of Tourism Research, 22(4), 408–421. https://doi.org/10.1080/10941665.2016.1273960
- Tuncay, N., & Ozcan, C. C. (2020). The effect of Dutch disease in the tourism sector: The case of Mediterranean Countries. Tourism and Hospitality Management, 26(1), 99–114. https://doi.org/10.20867/thm.26.1.6
- UNWTO. (2018). Tourism for Development – Volume I. Key Areas for Action. https://doi.org/10.18111/9789284419722
- Wang, H., & Luo, Q. (2022). Can a colonial legacy explain the pollution haven hypothesis? A city-level panel analysis struct. Change Economics Dynamics, 60, 482–495. https://doi.org/10.1016/j.strueco.2022.01.004
- Wang, Q., Wu, S., Zeng, Y., & Wu, B. (2016). Exploring the relationship between urbanization, energy consumption, and CO2 emissions in different provinces of China. Renewable Sustainable Energy Review, 54, 1563–1579. https://doi.org/10.1016/j.rser.2015.10.090
- Yu, W., Pagani, R., & Huang, L. (2012). CO2 emission inventories for Chinese cities in highly urbanized areas compared with European cities. Energy Policy, 47, 298–308. https://doi.org/10.1016/j.enpol.2012.04.071
- Zaman, K., Shahbaz, M., Loganathan, N., & Raza, S. A. (2016). Tourism development, energy consumption and Environmental Kuznets Curve: Trivariate analysis in the panel of developed and developing countries. Tourism Management, 54, 275–283. https://doi.org/10.1016/j.tourman.2015.12.001
- Zeshan, M., & Shakeel, M. (2020). Adaptations and mitigation policies to climate change: A dynamic CGE-WE model. The Singapore Economic Review, 18, 1–25. https://doi.org/10.1142/S0217590820500654
- Zhang, J., & Zhang, Y. (2018). Annals of tourism research carbon tax, tourism CO2 emissions and economic welfare. Annals of Tourism Research, 69, 18–30. https://doi.org/10.1016/j.annals.2017.12.009
- Zhang, G., Zhang, N., & Liao, W. (2018). How do population and land urbanization affect CO2 emissions under gravity center change? A spatial econometric analysis. Journal of Cleaner Production, 202, 510–523. https://doi.org/10.1016/j.jclepro.2018.08.146