
 ?Mathematical formulae have been encoded as MathML and are displayed in this HTML version using MathJax in order to improve their display. Uncheck the box to turn MathJax off. This feature requires Javascript. Click on a formula to zoom.
ABSTRACT
The study examines whether the long-run validity of PPP holds in some major advanced and developing economies. The study employed the smooth time-varying cointegration (TVC) and time-varying detrended fluctuation analysis (DFA) methodology, and we are not aware of any study that has applied TVC and DFA to investigate the long-run validity and determinants of the PPP. Using both the US and Japan as base countries, the empirical results from the univariate unit root tests show that PPP does not hold and thus invalidates PPP. The study finds strong evidence for both the VAR model and the TVC. Our results show that PPP can be used for determining equilibrium exchange rates for these 15 countries, under both methods. The results of DFA and the Hurst exponents for real exchange rates (RERs) in absolute values showed that the Hurst exponent is greater than 0.5 in any country, thus persistent and not mean-reverting but in a rolling window form RERs provide mixed results about the validity of PPP in these countries. These results might be different from earlier works due to different techniques applied and also the long period of data used in this study.
Public Interest Statement
This paper analyses the long-run validity of PPP in some major advanced and emerging economies from 1 January 1980 to 31 December 2018 in a smooth time-varying cointegration model and the time-varying detrended fluctuation analysis framework. The results of various specification tests indicate that data in developed and developing countries favourable to the VAR method and the time-varying cointegration approach. However, the time-varying detrended fluctuation analysis methodology has mixed results. These results have risen due to different techniques apply and also the long period of data used in this study. This study will be of public interest as it provides insight into the long-run validity of PPP can be used to determine the equilibrium exchange in most of the countries in this study based on the VAR method and the time-varying cointegration technique. If PPP holds and thus the differential inflation rate between countries is precisely offset by exchange rate changes, countries’ competitive position in the world export market will not be thoroughly affected by exchange rate variations. Nevertheless, if there are deviations from PPP changes in nominal exchange rates cause variations in the real exchange rates upsetting the international competitive position of countries.
1. Introduction
Purchasing power parity (PPP) is based on an economic theory that compares the purchasing power of numerous world currencies to one another. PPP is an economic theory that states that the prices of goods and services should be the same between countries, as one of the main theories in macroeconomics and international economic models. It also postulates a theoretical exchange rate that allows people to purchase the same amount of goods and services everywhere globally. PPP originated after World War I. Following World War I, the Swedish economist Cassel (Citation1918, Citation1922) proposed multiplying each currency’s pre-war value by its inflation rate to form the new parity. Hence, that formed the basis for today’s PPP. PPP is positioned on the law of one price. The law of one price is an economic proposition that claims that a basket of goods must sell for the same price in each country. Intuitively, this law is initiated from the concept of the inevitable removal of all arbitrage. One primary source for model misspecification is parameter instability. The parameter unpredictability can be significant in cointegrated models since they explain long-run relationships. It is estimated using data whose life span is typically lengthy. A long-run equilibrium level of the real exchange rate is an essential circumstance for the long-run absolute PPP to hold.
The purpose of this study is to provide an overview of existing and newly developed methodologies, a time-varying cointegration (TVC) model due to C. Park and Park (Citation2015), Y. J. Park and Hahn (Citation1999) and detrended fluctuation analysis (DFA) by C.-K. Peng et al. (Citation1994) to investigate on the long-run validity of the PPP theory. Over the past decades, researchers have used different methodologies to examine the long-run validity and determinants of the PPP. Many techniques and econometric tools have been used to investigate the long-run validity of PPP. A major limitation of conventional unit root tests such as the Augmented Dickey–Fuller (ADF) test has low power in validating PPP and this has resulted in the use of unit root tests based on linear and nonlinear models to examine the PPP. While other engaged panel unit root tests have been involved in the literature in testing the long-run validity of PPP. Despite a substantial body of research, no consensus has been reached regarding the model to use.
PPP is expected to hold in the long run, but nominal exchange rates may not reflect the domestic and foreign price differences in the short run. The current paper aims to examine the long-run validity of PPP in the major developed and major developing economy relationships that fluctuate smoothly over time, similar to Y. J. Park and Hahn (Citation1999) using the smooth time-varying cointegration (TVC) model and time-varying detrended fluctuation analysis (DFA) methodology. The important feature of this method is developments in terms of Chebyshev time polynomials. Our innovation of the current study is the use of two newly developed methodologies, that is. TVC model and DFA approach. An advantage of using these countries is that it is global and it reflects activity in such major developed and major African emerging economies.
The purpose of the study is three folds. First, this paper aims to test the long-run validity of PPP in the major developed and major developing economies using a time-varying cointegration (TVC) model due to C. Park and Park (Citation2015) and Y. J. Park and Hahn (Citation1999). The time-varying cointegration (TVC) model detects the measurement error caused by the instability of parameters in a conventional time-invariant cointegration model established by Engle and Granger (Citation1987). This unpredictability may be caused by discrete regime shifts, which may be running to slow changes in the long-run relationship. Y. Chang et al. (Citation2014) show that in the case of time-varying long-run coefficients, the standard cointegrating regressions would be biased even in amalgamation with a rolling methodology. One advantage of the TVC method is that it allows for works devoid of additional unit-root or cointegration tests for the diverse sub-samples. Previous studies focus on either the short-run or long-run and used either major developed economies or major developing economies. Our study will investigate the long-run validity of PPP in both developed and developing economies for a specific country. The long-term approach also allows us to examine real exchange rate adjustment for the major developed and some developing economies using time-varying cointegration (TVC) techniques. The model will capture the dynamic information provided by the speed of adjustment toward the long-run equilibrium. A novelty of our model is to estimate the nature of the adjustment towards the long-run equilibrium.
Second, we used time-varying detrended fluctuation analysis (DFA) to estimate Hurst’s exponents to discover whether RERs are stationary and mean-reverting. The DFA is a scaling analysis method used to investigate long-range in the estimation of Hurst exponents. Hu et al. (Citation2001) used Hurst’s analysis (R/S analysis) and show that the DFA is a superior method to quantify the scaling behaviour of noisy signals. The DFA was essentially designed to investigate long-range in stationary and non-stationary time series (C.-K. Peng et al., Citation1994; Hu et al., Citation2001; Z. Chen et al., Citation2002). The DFA technique has been effectively pragmatic in research fields in economics and finance. The estimated Hurst exponent has values 0 and 1 for DFA. When the RER has a Hurst exponent close to 0, the RER is mean-reverting and should be stationary and mean-reverting; hence, PPP holds when the real exchange rate is a stationary process. When the calculated RER has a Hurst exponent greater than 0.5, PPP does not hold. When the estimated RER has a Hurst exponent close to 1, it means that the RER is not stationary and mean-reverting. In other words, H comes close to 1 and explains a signal of smooth appearance, typically denoting those high values are followed by high values. Using the US as a base country, we plot Hurst exponents from the three window lengths of 178, 268 and 358 for RERs throughout the sample period for each country and yielded inconclusively. One advantage of the DFA method is that it accepts the detection of long-range power-law correlations in noisy signals with entrenched polynomial trends that can mask the valid correlations in the fluctuations of a movement. It also shuns the spurious detection of apparently long-range correlations that are the object of non-stationarity (Yue et al., Citation2010). Among various prevailing techniques to estimate the self-similarity and scaling property in fractal signals, detrended fluctuation analysis is one of the most fashionable (Arsac & Deschodt-Arsac, Citation2018).
Third, we used parametric tests, such as the Augmented Dickey—Fuller (ADF) test and non-parametric tests, such as the Phillips and Perron (PP) test and the VAR model, to explore the validity of PPP in these advanced and developing countries. Finally, earlier works have applied TVC and DFA methodologies to investigate PPP in different settings. However, we are not aware of any study that has applied TVC and DFA to investigate the long-run validity and determinants of the PPP. Hence, our paper extends the application of this quantitative method to investigate the long-run validity and determinants of the PPP in some major advanced and African emerging countries.
The paper is organized as follows. Section 2 briefly presents the literature review. Section 3 provides a discussion of the econometric methodologies of the smooth time-varying cointegration (TVC) model. The time-varying detrended fluctuation analysis (DFA) methodology and the data. Section 4 reports the empirical results of the study. Section 5 presents the discussion. Section 6 concludes the study.
2. Literature review
One of the key theories that describe exchange rate determination is PPP. By convention, two hypotheses are usually used to explain PPP. In the absolute version of the PPP, the bilateral exchange rate would be the ratio of the price levels between countries. The second theory explains the relative version of the PPP as a change in the nominal exchange rate equalizing with the inflation differential in the relative change in prices of the two countries. Among the two central concepts associated with such a phenomenon (PPP), we usually used the relative version of PPP in empirical studies owing to the complex structure of the economy and dissimilarities between countries. A vast majority of empirical studies has found it extremely difficult to use the absolute method. This absolute PPP method has created many difficulties supporting the hypothesis of long-run PPP using floating rate period data (T. Y. Chang et al., Citation2012).
Some studies have used nonlinear techniques to test for PPP and estimate the speed of adjustment toward the long-run equilibrium based on these tests. Enders and Chumrusphonlert (Citation2004); Oh et al. (Citation2018) have proved that these tests have more power than the conventional Engle and Granger (Citation1987) test when there are asymmetric adjustments toward equilibrium. Oh et al. (Citation2018) amend the threshold cointegration tests to increase the testing power. They follow the approach developed by Lee and Lee (Citation2015) and augment the original testing regressions with stationary covariates, which are readily available. Oh et al. (Citation2018) found that their test tends to enhance the testing power. The simulation results indicate that the tests increase the power of the current threshold cointegration tests. Enders and Chumrusphonlert (Citation2004) used a threshold cointegration approach to examine the long-run PPP in Pacific countries. They report that symmetric or asymmetric adjustment with a zero rate for the threshold; two-sided tests of long-run PPP normally reject long-run PPP. Zayed et al. (Citation2018) using Johansen’s long-run cointegration test, document that there exists a long-run relationship among the variables, thus preventing PPP to hold in the long run in Bangladesh. Nevertheless, Yıldırım (Citation2017)stated that the use of nonlinear unit root tests produces stronger evidence in support of PPP, which is contrary to the non-rejection of unit roots obtained from a standard Dickey—Fuller test. However, the rejection of the PPP assumption does not invalidate the unit root method. It only probably causes the problem of under-specification to the standard unit roots obtained from a standard Dickey—Fuller test.
Nonetheless, with asymmetric adjustment, a consistent estimate of a threshold, long-run PPP holds between Japan and five countries. Furthermore, using the USA as the base country, they find evidence of long-run PPP for all nations except Japan. Vo and Vo (Citation2022) also find that PPP holds in the long-run equilibrium adjustments. C. W. Su et al. (Citation2012) and H. F. Peng et al. (Citation2017) study the PPP in BRICS countries to determine whether PPP holds in these countries. They find that PPP holds in all the countries. C. Park and Park (Citation2015) used time-varying cointegration models. They show that the time-varying PPP outperforms models based on constant cointegration coefficients when forecasting future exchange rate deviations in the long run. Lee and Lee (Citation2015) proposed a straightforward modification of the Engle and Granger (Citation1987) test to increase its testing power. The asymptotic distribution of the modified Engle and Granger (Citation1987) test is analogous to that of the unit root test with stationary covariates. The modified tests improve the power properties of the Engle and Granger (Citation1987) cointegration test considerably. Using the cointegration test, Zayed and Zahan (Citation2017) investigate the Korea–US exchange rate and prices and the Bangladesh economy. They find that a long-run relationship exists between the exchange rate and inflation. In estimating the PPP, if a specific measurement error is made in one country can impact entire series of poverty estimates, as well as other countries, since those errors are transmissible. Notwithstanding the important role of PPP, by the formation of the PPP rates, any measurement errors in one country influence the PPP estimate of all other countries (Moatsos, Citation2020).
Based on the Dickey–Fuller (DF) test, which is found to be little support for PPP. J. J. Su et al. (Citation2014) add their voice to the debate. To overcome this problem, J. J. Su et al. (Citation2014) used wild‐bootstrapped nonlinear unit root tests of KSS (2003) and demonstrated that their new evidence provides strong support against PPP. Furthermore, using unit root testing techniques: ADF, PP and KPSS, Musa et al. (Citation2021) investigated the existence of long-run PPP in Naira real exchange rates against the Chinese Yuan, British Pound and US Dollar. The study finds that the real exchange rates are not stationary, signifying that the series are not cointegrated in the long run, thus disproving the reality of PPP. Using ADF and PP tests, Al-Gasaymeh and Kasem (Citation2015) test nonstationary RERs between Jordan and its major trading partners specifically, Japan, the United Kingdom, Turkey, and the United States. These authors find that the nonstationary RERs in each country cannot be rejected. This infers that the long-run PPP invalidate any country. Ma et al. (Citation2017) found that the validity of the PPP holds in three countries. Bahmani-Oskooee et al. (Citation2015) found strong support for the validity of the PPP hypothesis in the 11 emerging market economies. One strand of the literature investigates time-varying coefficient models with stationary regressors (B. Chen & Hong, Citation2012; Giraitis et al., Citation2014; Z. Zhou & Wu, Citation2010; Zhang & Wu, Citation2012) and may be viewed as an extension of that work to adapt non-stationary and trending regressor components. Previous studies used univariate unit root tests, multivariate cointegration, panel unit root tests, and panel cointegration tests. When performing a cointegration analysis of time series, it is essential to have a model of whether the underlying process is stationary. Many of the techniques used on a time series to estimate unit root tests make assumptions about whether the process is stationary or non-stationary.
It has been argued that, in theory, perpetual shifts in volatility can seriously upset linear unit root conclusions and unlimited samples asymptotically. Under these circumstances, if the assumptions linked with the estimation method do not hold, then decisions based on the results may be inaccurate. Macroeconomic variables are cautiously significant since a finding of stationarity signifies those shocks to the variable have an enduring influence on the future path of the variable (Kyei-Mensah, Citation2019). Hence, these factors have motivated us to study the accounts for latent long-run PPP tests in major developed and major developing countries’ exchange rates. Using the panel unit root test, Huang and Yang (Citation2015) find weaker evidence for PPP following the Euro launch in European countries. Behera (Citation2019) finds empirical backing for strong PPP. The study also reports tremendous support for the long-run PPP during the period 1980–1990, but the speed of adjustment in the real exchange rate return to equilibrium is comparatively slow. Likewise, Arize et al. (Citation2010) find strong validation that PPP holds in the long run in the high inflation African countries; thus, statistically significant long-run equilibrium association among nominal exchange rates, domestic prices and foreign prices. T. Chang et al. (Citation2011) revisited the long-run PPP hypothesis with asymmetric adjustment for G7 countries using the threshold cointegration tests. They reported convincing support for the long-run PPP hypothesis in G7 countries, except Canada. Morley and Lo (Citation2015) used the Bayesian technique and find that the exchange rate from the G7 countries indicates the overall support for nonlinearity in the exchange rate. Jiang et al. (Citation2016) apply a nonlinear threshold unit root test to examine the validity of PPP and find it holds for seven Central Eastern European countries. One method to answering the PPP perplexes rests in permitting nonlinear dynamics in real exchange rate adjustment. Several new features in the literature seek to address nonlinear dynamics in real exchange rate adjustment. As evident from earlier works, a record number of empirical scholars that study PPP theory used nonlinear models such as T. Y. Chang et al. (Citation2012); S. Zhou and Kutan (Citation2014); Apergis (Citation2015); Jiang et al. (Citation2016); Yıldırım (Citation2017).
3. Econometric methodology
3.1 Purchasing power parity formulation
The real exchange rate of a country defines as the relative price levels of the foreign and domestic economy, which is defined as follows
where is the real exchange rate;
is the nominal exchange rate in terms of national currency per unit of the foreign currency (i.e. in the US and Japan);
is the consumer price index (CPI) indices for the domestic country and
is the consumer price index (CPI) for the foreign country. Taking logarithms of both sides of Equationequation 1
(1)
(1) and rearranging the terms we obtained:
From Equationequation (2)(2)
(2) , the nominal exchange rate, domestic price and foreign price indices are typically ordered one I (1). The nominal exchange rate, domestic price, and foreign price must be stationary under the PPP. They can be cointegrated with a cointegration vector (1, −1, 1). Therefore, the long-run PPP may be validated if a cointegration vector (1, −1, 1) establishes the nominal exchange rate and domestic and foreign price indices. If the long-run PPP holds, then deviations from the PPP in the short run are temporary.
The PPP relationship can be tested using an unrestricted equation as follows:
where is the logarithm of the nominal exchange rate,
is constant,
and
are two positive parameters, where
and
are the logarithm of domestic and foreign price, respectively, and
is a stochastic error term capturing deviations from PPP. The relative version of PPP requires that
= 1 and
= −1. Similarly, the absolute version of PPP obliges that
= 0. This relative version of PPP reflects the positive and negative dynamic relationship between the exchange rate and price in Dornbusch’s (Citation1976) overshooting model of the exchange rate. This highlights the changes between money growth and prices in the short-run adjustment and long-run equilibrium relationship.
From the unrestricted Equationequation (3)(3)
(3) , the values of
and
are supposed not to vary proportionately in the presence of measurement errors in prices (M. Taylor Citation1988). As long as
EquationEq. (3)
(3)
(3) is stationary, there is an existent long-run equilibrium between the nominal exchange rate and relative prices.
3.2 Econometric methodologies of time-varying Cointegration
The time-varying cointegration (TVC) model detects the measurement error caused by the instability of parameters in a conventional time-invariant cointegration model established by Engle and Granger (Citation1987). This instability might produce by discrete regime shifts, leading to slow fluctuations in the long-run relationship. When the regressors are cointegrated, a global rotation method is requested to split out the stationary and non-stationary components, which carry the related signals in kernel estimation with opposing strengths (Li et al., Citation2017).
When fluctuations in the coefficients are slow, time-varying coefficients can be produced by a smooth parallel function. Y. J. Park and Hahn (Citation1999) presume polynomials and trigonometric functions and concentrate on the single cointegration relation.
EquationEquation (3)(3)
(3) can be written as a PPP relationship based on the time-varying cointegration coefficient,
where is the cointegration coefficient, which varies smoothly over time, capturing the effect of slow adjustments in the economic situation on the PPP relationship?
Following Y. J. Park and Hahn (Citation1999) and C. Park and Park (Citation2015) and adopt the time-varying coefficient cointegration to modelled the nonlinear long-run validity of PPP. Assume that the following time-varying cointegration association holds between
, and
where and are the time-varying cointegration coefficients and
denote the cointegration residuals.
Define smooth functions and
on them (0, 1) such that
and, where
is the sample size. Y. J. Park and Hahn (Citation1999) assume trigonometric functions. Under the assumption that
and are smooth sufficient to be approximated by a series of polynomials and trigonometric functions, EquationEquation (5)
(5)
(5) is written by C. Park and Park (Citation2015) as follows.
where, we assume that and
are the corresponding series of functions that can be approximated by
and
as
an
increase (Y. J. Park & Hahn, Citation1999)
, and
Then, and
are non-stationary. To achieve valuable estimators and a suitable inferential source for the parameters in the TVC model, we utilize the canonical cointegrating regression (CCR) developed by J. Y. Park (Citation1992) and which was extended by Y. J. Park and Hahn (Citation1999). EquationEquation (6)
(6)
(6) was transformed by Y. J. Park and Hahn (Citation1999); hence, we obtain
where
And the superscript + represents CCC transformed variables. We obtained the OLS estimators for
and
in Equationequation (7)
(7)
(7) . We can approximate
and
by and
in that order. We approximate
and
use Fourier Flexible Form (FFF) series functions, incorporating polynomials and trigonometric functions.
From the ongoing discussion and evidence before us, we conduct a time-varying cointegration method for the PPP and perform a model specification test put forward by Y. J. Park and Hahn (Citation1999). To determine whether can use major developed and developing countries’ data with the time-varying cointegration methodology. For further detail and explanation, see Y. J. Park and Hahn (Citation1999) and C. Park and Park (Citation2015).
3.3 Detrended fluctuation analysis
The Detrended fluctuation analysis (DFA) denotes a valuable tool for understanding patterns in long-range autocorrelations in non-stationary time series with distributed data. The DFA was an approach essentially invented to explore long-range correlation in non-stationary time series (C.-K. Peng et al., Citation1994; Hu et al., Citation2001). The main interest of the DFA is to look at the long-run validity of PPP. The DFA method can also help examine the long-range and short-range correlation in non-stationary and stationary processes. The technique is momentous and supersedes other methods. Hu et al. (Citation2001) stated that “the advantages of DFA over many methods are that it permits the detection of long-range correlations embedded in seemingly non-stationary time series and avoids the spurious detection of apparent long-range correlations are an artefact of non-stationarity”. The DFA is a straightforward mathematical approach; however, highly effective in examining long-range correlations of non-stationary time series (Marton et al., Citation2014).
We followed C.-K. Peng et al. (Citation1994), who proposed the DFA methodology
The DFA approach has become a used method to determine a fractal scaling property and the detection of long-range correlations in stationary and non-stationary time series. DFA is a simple mathematical approach nonetheless incredibly proficient to examine the power law of long-term correlations of non-stationary time series (Marton et al., Citation2014).
We used DFA in computing the Hurst exponent, H, of the RERs in absolute form and through time in a rolling window method. Using the US as a base country, we plot Hurst exponents from the three window lengths of 178, 268 and 358 for the RERs throughout the sample period for each of the countries.
The time series to be analyzed Y(i) with N samples; i = 1 … N is first integrated with a standard deviation of 1. The integrated time series is divided into boxes of even length, n. In each segmentation, the integrated least-squares line is fit to the data locally, typically, the linear trend in that segment. The ordinary least-squares approach is used to assess the trend in each block. The Y coordinate of the straight-line segments is denoted by Yn(i). We detrend the integrated time series, Y(i), by subtracting the local trend, Yn(i), in each box. We calculate the root-mean-square fluctuation of this integrated and detrended time series is found by:
We repeat this procedure for different box sizes (different scales) and to estimate the Hurst exponent, which provides a relationship, and indicates the presence of scaling property:
α
(9)
The parameter α, called the scaling exponent or fluctuation exponent, symbolizes the correlation properties of the data. Equation (9) can be written as:
Logα
(10)
The linear relationship between and
, If power-law scaling is present then a double logarithmic in the
plot. This technique tests for self-similarity (fractal properties) as it performs a measure at different window sizes. The slope of the linear relationship represents the estimation of the Hurst exponent. A scaling exponent a can be estimated from ordinary least-squares fit. This scaling exponent a is a measure of correlation in stationary and non-stationary time series and is simply an estimate of the Hurst exponent H. For a further detailed explanation of the DFA method, see, e.g. Yue et al. (Citation2010); Marton et al. (Citation2014); Arsac and Deschodt-Arsac (Citation2018).
3.4 Data
This study examines the long-run purchasing power parity (PPP) in major developed and developing countries. The monthly data for the nominal exchange rates against the US dollar, Japanese yen and consumer price indices (CPI) for Canada, Denmark, the Euro area, Japan, Norway, Sweden, Switzerland, the UK, Algeria, Cote d’Ivoire, Egypt, Mauritius, Morocco, Nigeria and South Africa for our empirical analyses from NaN Invalid Date to NaN Invalid Date as the entire sample period. The available monthly data for the Euro area was between NaN Invalid Date to NaN Invalid Date . The introduction of the Euro by the European Central Bank (ECB) increased its direct interventions on the foreign exchange market to achieve a severe fall of the Euro against the major currencies, the British pound, the US dollar and the Japanese yen. All the data are obtained from the International Financial Statistics of the International Monetary Fund Web site. The price indices used are the consumer price index (CPI) in these countries. In all cases, the US and Japan are considered the base countries. All the series are transformed into natural logarithms before performing the econometric analysis.
4. Empirical results
4.1 Coefficient of variation
Table shows the coefficient of variations (CV) of the real exchange rate, the nominal exchange rate, the domestic price, the price ratio and the skewness, the kurtosis and the Jarque-Bera statistic for real exchange rates. Panel A of Table , using the US as a base country, the real exchange rates reveal evidence of significant and widespread inconsistency and substantial deviation from normality. The results are consistent with Arize et al. (Citation2010). The coefficient of variations of the nominal exchange rates is generally more significant than the domestic price and the price ratio. Similarly, the domestic price is mostly larger than that of the price ratios. Skewness is primarily positive and significant for the sample period. Only Japan, Sweden and Cote d’Ivoire have negative and insignificant for the sample period. Excess kurtosis is significant (p-value ≤0.10) during the period under review. Most kurtosis is less than 3; the distribution is flat (platykurtic) relative to the normal distribution. Overall, the presence of kurtosis presents testimony for volatility clustering and fat-tailedness (see Joseph et al., Citation2020). Based on those determines, it is not shocking that the Jarque-bera statistic is highly significant except for Cote d’Ivoire, which is insignificant.
Table 1. Coefficient of variation of the variables
Comparative values for Panel B of Table , using Japan as a base country, the real exchange rates show testimony of significant and extensive variation and considerable abnormality from normality. The real exchange rates are most highly significant than real exchange rates using the US as a base country. The coefficient of variation of the real exchange rates is mostly bigger than that of the domestic and price ratios. The domestic prices are generally bigger than the price ratios. The coefficients of variation of the real exchange rate and the nominal exchange rate for Cote d’Ivoire are negative. Skewness is positive and significant except for the Euro area, which is negative and significant. Kurtosis is always positive and significant. The Jarque-bera statistics reject the normality test of all the series at the 1% significance level. The real exchange rates during the sample period indicate substantial proof of exchange rate pass-through as prices adjust (M. Chen & Hu, Citation2018) to economic reforms in most countries, especially African countries, a region in the world that academic researchers over the years have ignored. The region has experienced unprecedented overvalued exchange rates, high nominal exchange rate changeability, record increased volatility of real exchange rates and depreciation of the national currency, high inflation and macro-economic instability. An indication of overvalued currency is one for which the ratio of price indices exceeds the exchange rate. Using the US as a base country, Nigeria has been consistently overvalued throughout the period. However, using Japan as the base country, Cote d’Ivoire and Egypt have been consistently overvalued during the sample period. In the long-run over-valuation could have some implications on these economies because an over-valuation of these currencies indicates that importation of goods becomes cheaper. This hurts the local industries as consumers shift from the consumption of local goods to foreign goods. With the overvalued syndrome, it is not understandable that there is a tendency for deviations to vanish anytime soon.
4.2 Stationarity test
We used Augmented Dickey–Fuller (ADF) test, and the Phillips Perron (PP) test for both constant and constant trend are used to analyze the hypothesis that each country’s real exchange rate series have a unit root. We incorporated the appropriate lag structures of the dependent variable in ADF and PP tests. We select the appropriate lag structures for the Schwartz Information Criterion (SIC) for ADF and Newey West using the Bartlett kernel for the PP test. The unit root test of ADF and PP are shown in Table .
Table 2. ADF and PP Unit Root Test for Mean stationery of RERs of 468 Obs
Panel A of Table uses the US as a base country. The univariate unit root of ADF and PP tests fail to reject the null of non-stationarity of the real exchange rate for all the 15 countries except Morocco, thus supporting the PPP. Panel B of Table , using Japan as a base country, ADF and PP tests fail to reject the null of a unit root of non-stationarity of the real exchange rate for all the 14 countries, constant and constant and trend but for the result of Denmark. Empirical tests for the stationarity of time series, notably macroeconomic variables, are cautiously significant since the finding of stationarity means that shocks to the variable have a long-lasting effect on the future path of the variable. We show that RERs have a unit root and all the series in the analysis are non-stationary except Morocco and Denmark. Thus, the series contains a unit root, and economic shocks permanently affect the data-generating process. This finding is consistent with J. J. Su et al. (Citation2014) and Al-Gasaymeh and Kasem (Citation2015).
Critical values of the ADF constant test are −3.450, −2.870 and −2.571 at 1%, 5% and 10% significance levels, respectively. Critical values of the ADF constant and trend test are −3.986, −3.423 and −3.135 at 1%, 5% and 10% significance levels, respectively.
Critical values of the PP constant test are −3.450, −2.870 and −2.571 at 1%, 5% and 10% significance levels, respectively.
Critical values of the PP constant and trend test are-3.986, −3.423 and −3.135 at 1%, 5% and 10% significance levels, respectively.
4.3 Cointegration test
Before analyzing our time-varying cointegration, we used a vector autoregression (VAR) model to investigate the validity of the [1, −1, 1] cointegration vector among the nominal exchange rate, and domestic and foreign price levels. All the variables in Equationequation 1(1)
(1) , the nominal exchange rate and domestic and foreign price levels are assumed to be endogenous since they are all ordered one I(1). We used the optimal lag structure of the equation for the VAR based on the Akaike Information Criterion (AIC). We can test the validity of the PPP in the long run by using the cointegration methodology. Johansen’s (1988; 1990) multivariate cointegration methodology tests the existence of a long-run cointegration relationship between nominal exchange rate, and domestic and foreign price levels. This test permits the testing of a restricted version of the cointegrating vector(s) and the speed of adjustment parameters. The Johansen test relies on several cointegrating vectors and is conducted using two test statistics, that is, trace statistics and maximum eigenvalue statistics.
Whenever a long-run PPP holds, the VAR model can examine the movement of variables to the long-run equilibrium relationship. The cointegration test results with the US and Japan as the base countries are reported in and , respectively. In using the US as the base country, the null hypothesis of no cointegrating vector is rejected for any country at the 1% and 5% significance for trace and maximum eigenvalue tests. The nominal exchange rate and domestic and foreign price levels for these countries are cointegrated when Johansen’s maximum likelihood technique is used.
Table 3. Estimation results of Time Varying-Cointegration Coefficients for CPI
Table 4. Estimation results of Time Varying-Cointegration Coefficients
Table 5. Hurst exponents of the real exchange rate in absolute form
Table 6. Johansen’s trace and maximal eigenvalue test statistics for the cointegration of countries in the study using the US as a base
Table 7. Johansen’s trace and maximal eigenvalue test statistics for the cointegration of countries in the study using Japan as a base
In Table using Japan as the base country, the hypothesis of no cointegrating vector is rejected at the 1% and 5% levels of significance for Canada, Denmark, Euro area, Norway, Sweden, Switzerland, UK, Algeria, Cote d’Ivoire, Egypt, Mauritius, Morocco and South Africa based on the trace and maximum eigenvalue tests. We cannot find any cointegrating vectors for Nigeria at the 1% and 5% significance levels for the maximum eigenvalue test. Nevertheless, the hypothesis of no cointegrating vector is rejected at the 1% and 5% levels of significance for Nigeria based on the trace test.
4.4 Time-varying cointegration
Table reports the estimated results of the time-varying cointegration (TVC) coefficient. We follow Y. J. Park and Hahn (Citation1999) and C. Park and Park (Citation2015) and adopt the time-varying cointegration coefficient to modelled the nonlinear long-run validity of PPP. To achieve valuable estimators and a suitable inferential source for the parameters in the TVC model, we utilize the canonical cointegrating regression (CCR) developed by J. Y. Park (Citation1992) and which was extended by Y. J. Park and Hahn (Citation1999). The null hypothesis is that there exists a time-varying cointegration relationship, whilst the alternative hypothesis is that there is no cointegration
Panel A of Table is the CPI, using the US as a base country, the null hypothesis of the TVC coefficient at 5% levels of statistical significance is rejected for every country. Panel B of Table is the corresponding CPI, using Japan as a base, the results show that the test statistics of all the countries are bigger than their critical values. This means that the null hypothesis of the TVC coefficient at 5% level of statistical significance is rejected for all the countries. Regardless of whether the US or Japan is the base country, the null hypothesis of the TVC coefficient at 5% levels of statistical significance is rejected for all the countries and these observations validate PPP in these countries
The 5% critical value of 9.49 according to Table in Y. J. Park and Hahn (Citation1999)
Panel A of Table is the exchange rate, using the US as a base country, the null hypothesis of the TVC coefficient at 5% levels of statistical significance is rejected for eleven countries, precisely Canada, Denmark, the Euro area, Japan, Norway, Sweden, Switzerland, the UK, Morocco, Nigeria and South Africa. The null hypothesis of the TVC coefficient cannot be rejected at 5% levels of statistical significance for Algeria, Cote d’Ivoire, Egypt and Mauritius Panel B of Table is the corresponding exchange rate, using Japan as a base country, the results show that the null hypothesis of the TVC coefficient at 5% levels of statistical significance is rejected for 12 countries, namely Canada, Denmark, Norway, Sweden, Switzerland, the UK, Algeria, Cote d’Ivoire, Mauritius, Morocco, Nigeria and South Africa. We cannot find any TVC coefficient for both the Euro area and Egypt at the 5% levels of significance.
The 5% critical value of 9.49 according to Table in Y. J. Park and Hahn (Citation1999)
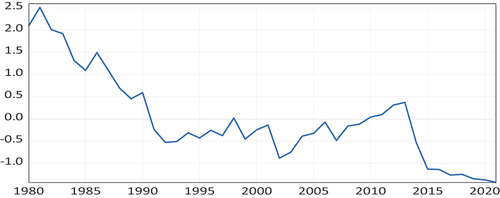
Figures
Figure 1. Time-varying cointegration coefficient on the CPI using the US as a base country.
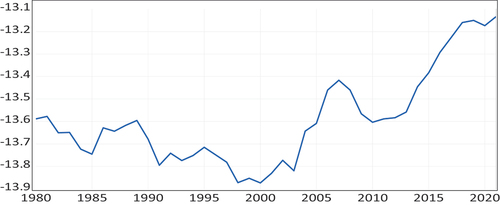
Figure 2. Time-varying cointegration coefficient on a foreign exchange using the US as a base country.
We estimate the TVC parameters with the 95% confidence bands under the PPP with the approach of Y. J. Park and Hahn (Citation1999). These estimations reveal that the long-run PPP varies considerably over time. Using the US as the base country, the results are reported in Figures . Figure captures the collapse in the consumer price index (CPI). The time-varying coefficients of CPI had a downward trend until 2000, when they started upwards. CPI designates an overall flat rate of inflation, consistent with low and moderate CPI in some major advanced and developing countries from 1980 to 2018. The periods between 1980 and 2000 when the time-varying coefficients CPI seems to flatten out in line with weaknesses in these countries. Using the US as a base country, we also estimate the TVC parameters of the real exchange rate and the results are reported in Figure The upward-sloping trend in the time-varying coefficient indicates a depreciation of the real exchange rate leading to a slowdown in major advanced and developing countries with a peak of approximately 2013 and 2018.
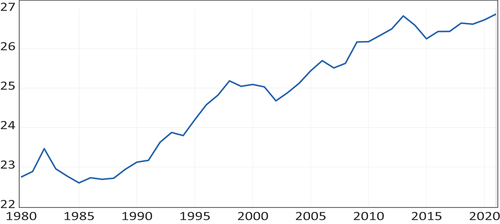
Using Japan as the base country, we also show the results in Figures . Figure is the TVC parameter of the consumer price index (CPI). From 1980: 01 to 2018: 12, the time-varying coefficients of CPI experienced an upwards and downward trend, demonstrating that the flat rate of inflation is weak in these countries. Notwithstanding the slow upward trend of the CPI in the 1990s, the relative upsurge against the export prices continued. The global financial crisis of 2007–2009 and the Eurozone crisis of 2010–2018 denote economic uncertainty with financial linkages. We estimate the TVC parameters of the real exchange rate and the result is shown in Figure It captures the collapse of a foreign exchange rate. It falls from 1980 to 1992 and then rises before it fell again in 2001. From then onward, it has an upward trend until 2013 when it had a downward slope. Between 1995 and 1996, the interest rate cuts in Japan stopped the yen’s appreciation and created economic growth in Japan. These figures show that the time-varying cointegration regressions seem to be stable and stationary in the restricted cointegration vectors. This finding is consistent with Table .
Figure 3. Time-varying cointegration coefficient on the CPI using Japan as a base country.
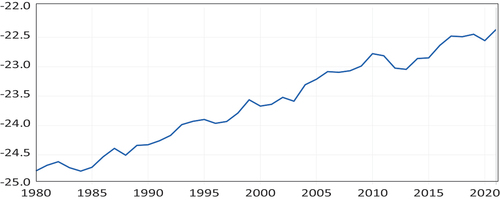
Figure 4. Time-varying cointegration coefficient on a foreign exchange using Japan as a base country.
4.5 Detrended fluctuation analysis
Table shows the result of the time-varying detrended fluctuation analysis (DFA). The Hurst exponents for real exchange rates in absolute values using the US as the base country indicated that the Hurst exponent is greater than 0.5 in any country, thus persistent and not mean-reverting. The null hypothesis is firmly rejected in all countries universally. The real exchange rates do not return to equilibrium after an exogenous shock. The PPP did not hold for these 15 countries during the sample period.
Hurst exponents for real exchange rates using the US and Japan as a base. When H > 0.5, thus persistence; PPP is thus rejected.
The real exchange rates do not return to equilibrium after an exogenous shock. PPP does not hold.
The corresponding results for using Japan as a base country show no difference. The Hurst exponents for real exchange rates in absolute values show that the calculated value of Hurst exponents is greater than 0.5 in all the countries used in this study; thus, PPP is persistent and not mean-reverting.
5. Discussion
The results of Panel A of Table imply that we cannot reject the unit root null hypothesis of the ADF and PP test series are non-stationary for constant and constant trends for those 14 countries except Morocco. The corresponding results from Panel B of Table show that ADF and PP test series are non-stationary for constant and constant and trend and cannot reject unit roots in all series but is significant for Denmark for constant and constant and the trend. These results have risen due to the low power of conventional tests in validating PPP and the volatile and flexible exchange rate schemes in these advanced and African emerging countries. The results in Table show that the RERs have a unit root using ADF and PP tests except for Morocco and Denmark. These findings are consistent with J. J. Su et al. (Citation2014) and Al-Gasaymeh and Kasem (Citation2015), who provide strong evidence against PPP and Kim (Citation2011) also indicate that the ADF test does not reject the null of non-stationarity for any country. Overall, these results keenly indicate that all the series under the PPP can typically be considered to be integrated of order one.
The results in Table indicate that the null hypothesis of no cointegrating vector is rejected for any country at the 1% and 5% significance for trace and maximum eigenvalue tests. The results show that there is cointegration between nominal exchange rates and relative prices and similar cointegration between nominal exchange rates, US CPI, Japan CPI and the CPI of each of the 14 countries. This finding is strong validation that PPP holds in the long run in these countries, thus, statistically significant long-run equilibrium association among nominal exchange rates and domestic and foreign price levels. Overall, the PPP with the restriction on the cointegration vector [1, −1, 1] has some backing from the data in its power to explain the exchange rate.
In Table , the hypothesis of no cointegrating vector is rejected at the 1% and 5% levels of significance for 13 out of 14 countries based on the trace and maximum eigenvalue tests. The result implies that one deviation from the PPP of the 14 individual countries is persistent. The results of this study are similar to the empirical results provided by Enders and Chumrusphonlert (Citation2004), who show that long-run PPP holds for most Asian countries. There is more evidence supporting PPP using both the US and Japan as the base countries. Johansen’s trace test displays more robustness to cointegrating relationships than Johansen’s maximum eigenvalue test. We obtained a piece of evidence in favour of the valid existence of long-run PPP for both developed and developing countries, but PPP invalidate for Nigeria at the 1% and 5% significance levels for the maximum eigenvalue test. The results in Tables are consistent with the findings of Morley and Lo (Citation2015); H. F. Peng et al. (Citation2017); Zayed et al. (Citation2018); Behera (Citation2019); Vo and Vo (Citation2022) who documented that PPP holds in the long run.
Panel A and Panel B of Table show the consumer price index (CPI). The results of the null hypothesis of the TVC coefficient at 5% of statistical significance are rejected for all the countries, both developed and developing countries. Thus, the results of the TVC coefficient always have positive coefficients and are significant regardless of the US as a base or regardless of Japan as a base. Hence, these countries have a long-run association ship or move together. This implies that the US CPI, Japan CPI and the CPI of each of the 14 countries move toward long-run equilibrium over time. This result is similar to Vo and Vo (Citation2022) who find that PPP holds in the long-run adjustments. Moreover, according to Rogoff (Citation1996), PPP is more likely to hold in countries with higher inflation. But most African countries have two-digit inflation. The positive coefficient of the TVC sign shows movement away from equilibrium conditions. It appears evident that the data strongly support the cointegrated model with TVC. The goodness-of-fit measured by the adjusted R2 is very high. The time-varying long-run equilibrium relationship may be due to unpredictable parameters in the PPP relationship.
Panel A of Table , the null hypothesis of the TVC coefficient at 5% levels of statistical significance is rejected for eleven countries and these observations validate PPP in these countries. Therefore, the nominal exchange rate and domestic and foreign price levels in these eleven countries have a long-run association ship or move together. In four countries, explicitly Algeria, Cote d’Ivoire, Egypt and Mauritius, the TVC coefficient of the nominal exchange rate, and domestic and foreign price levels have a unit root, which invalidates PPP. This means that we cannot reject the null hypothesis of TVC at 5%. The alternative hypothesis is that there is no TVC coefficient relationship for Algeria, Cote d’Ivoire, Egypt and Mauritius. The goodness-of-fit measured by the adjusted R2 in most cases is pretty high. Hence, using a time-varying approach in analyzing the validity and determinants of the PPP theory so that we can scrutinize the dynamic forces of the RERs over time.
Panel B of Table , the null hypothesis is rejected at the 5% level for 12 countries. Twelve of these countries are TVC, and these observations validate PPP in these countries. In the Euro area and Egypt, we cannot reject the null hypothesis of TVC at 5%. The empirical results of the TVC relationship between the nominal exchange rates and domestic and foreign price levels, using Japan as the base country, outperformed using the US as the base country. A tentative explanation is that the Bank of Japan has managed a lot of foreign exchange market interference throughout the entire sample period, which might have helped improve the TVC relationship. The positive coefficient of the TVC sign indicates movement away from equilibrium conditions. It is pretty to suggest that the speed of adjustment towards long-run equilibrium is quicker for the US than for Japan.
Using the US as a base country, TVC results show that deviations from PPP for 4 of 15 countries are prolonged. Also, using Japan as a base country, TCV results show that deviation from PPP for 2 out of 14 countries is persistent. Even though we cannot reject the null hypothesis of TVC at 5%, that is, there was no TVC between nominal exchange rates and domestic and foreign price levels, there was a long-run effect of relative prices on the exchange rates in these developed and developing countries.
The results from Table strongly show that PPP is invalid as the Hurst exponents of RERs in absolute forms are higher than 0.5 which means persistent. These observations invalidate PPP in these countries. These findings are in line with those reported by Gyamfi and Appiah (Citation2018) for Hurst exponents for real exchange rates in the absolute form are greater than 0.5 in any country.
Indeed, DFA detachment data over a wide-ranging range through different window sizes and then executes the plots within the segmentation windows. To do this, using the US as a base country, we plot Hurst exponents from the three window lengths of 178, 268 and 358 for RERs throughout the sample period for each of the countries and yielded mixed results. These results are not shown but are obtainable upon request. The PPP, therefore, might be strong in some countries but weak in others, resulting in misleading results. In some cases, PPP holds, and in some cases, PPP does not hold. For instance, Canada, Denmark, the Euro area, Japan, Norway, Sweden, Switzerland, the UK, Cote d’Ivoire, Mauritius, Morocco, Nigeria and South Africa upward and downward movement of RERs throughout the sample period.
In these countries, as mentioned above, a careful look at the plots of RERs throughout the sample period for the individual window lengths indicates that PPP does not hold from the start of the period when the RER has a Hurst exponent greater than 0.5, then PPP holds in the middle of the period when the Hurst exponent close to 0, and PPP does not hold at the end of the period when the RER has a Hurst exponent close to 1. When the Hurst exponent comes close to 1 this explains a signal of smooth appearance, typically denoting those high values are followed by high values. Given the evidence before us, we can say that PPP is improbable to hold unceasingly through time. If you remove the trend from a time series, patterns such as cyclical ones are removed. So, you cannot compare the results of detrended data with those of data that are not detrended. However, using the Akaike Information Criterion (AIC) to determine a better fit, the Detrended fluctuation analysis (DFA) model is better. We suggest that detrending the data is preferred and that future research should use detrended data in your setting, or at least as a benchmark for other tests.
In addition, the segmentation windows plot for Algeria and Egypt exhibited persistence throughout the sample period; hence, PPP did not hold for these countries. A long-run equilibrium level of the real exchange rate is an essential circumstance for long-run absolute PPP to hold. However, the absolute PPP method has created many difficulties supporting the hypothesis of long-run PPP using floating rate period data (T. Y. Chang et al., Citation2012).
Overall, these findings are strong validation that PPP holds in the long run in most of these countries. These findings are in line with the findings of Bahmani-Oskooee et al. (Citation2015); Morley and Lo (Citation2015); H. F. Peng et al. (Citation2017); Zayed et al. (Citation2018); Behera (Citation2019) and Vo and Vo (Citation2022) but differ from the findings of Ma et al. (Citation2017) and Huang and Yang (Citation2015).
6. Conclusion
This paper analyses the long-run validity of PPP in some major advanced and African emerging economies from NaN Invalid Date to NaN Invalid Date in a smooth time-varying cointegration model, and the time-varying detrended fluctuation analysis framework has not been used in any research paper regarding the long-run validity of PPP. Using data for the nominal exchange rates against the US dollar and Japan yen and consumer price indices for 14 countries. Using both the US and Japan as base countries, the results from the univariate unit root tests show that RERs have a unit root and that all the series in the analysis are non-stationary except Morocco and Denmark. Thus, the observation invalidates PPP in these countries but for Morocco and Denmark.
The Johansen approach shows that all the null hypothesis of no cointegrating vector is rejected for any country at the 1% and 5% levels of significance for trace and maximum eigenvalue tests. The results show that there is cointegration between nominal exchange rates and relative prices and similar cointegration between nominal exchange rates, US CPI, Japan CPI and the CPI of each of the 14 countries. This finding has strong validation that PPP holds in the long run in these countries. The TVC coefficient shows that most countries there exit the TVC relationship between them and these observations validate PPP in these countries. This result is consistent with Oh et al. (Citation2018), who find that the null hypothesis is rejected for every country in which long-run PPP holds. Also, Vo and Vo (Citation2022) indicate that ‘’In the long run, PPP holds with a greater degree of certainty as exchange rate changes are more likely to move in tandem with economic fundamentals. The DFA results show that the results are inconclusive in 13 countries, whilst PPP does not hold in Algeria and Egypt. We conclude that the long-run validity of PPP can be used to determine the equilibrium exchange in most of the countries in this study based on the VAR method and the time-varying cointegration technique. The results of various specification tests indicate that data in developed and developing countries favourable to the VAR method and time-varying cointegration approach. However, the time-varying detrended fluctuation analysis methodology has mixed results. These results have risen due to different techniques apply and also the long period of data used in this study.
Imagine, for instance, whether PPP holds or not has significant implications for international trade. If PPP holds and thus the differential inflation rate between countries is precisely offset by exchange rate changes, countries’ competitive position in the world export market will not be thoroughly affected by exchange rate variations. Nevertheless, if there are deviations from PPP changes in nominal exchange rates cause variations in the real exchange rates upsetting the international competitive position of countries. Thus, one of the significant implications of this study is that our results show that PPP can be used for determining equilibrium exchange rates for these 15 countries, under the TVC method, while under the Hurst method, the PPP cannot be used to determine the equilibrium exchange rates for some of these 15 countries. Therefore, we rely on the results of TVC more in favour of validating PPP than the results of the Hurst approach. Again, a simple idea is that the Hurst exponent may grow too quickly or slowly for the FX rates of certain countries. This may be an issue for FX rates in some developed or some developing countries. This gives an idea whether the state of economic development has a material effect on the size of the economies in the Hurst approach.
Acknowledgments
We would like to thank David McMillan (Senior Editor) and two anonymous referees of this journal for their very valuable comments. All remaining errors are ours.
Disclosure statement
No potential conflict of interest was reported by the author.
Additional information
Funding
Notes on contributors
Justice Kyei-Mensah
Justice Kyei-Mensah is a Senior Lecturer at Ghana Institute of Management and Public Administration (GIMPA), Ghana. He holds a PhD in Finance from Aston Business School, Aston University, England, He also holds MBA in International Banking and Finance from Birmingham Business School, University of Birmingham, England and a BA (Hons) International Business and Management Studies, Amsterdam School of Business, the Netherlands. He has a strong research interest in risk management, bank financial performance, and market efficiency (in general). His works have been published in some of the most respected academic journals, including the Investment Management and Financial Innovations Journal, Journal of Economic Research, Journal of Applied Business and Economics, and Journal of Academy of Business and Economics
References
- Al-Gasaymeh, A., & Kasem, J. (2015). Strong and weak form of purchasing power parity: The case of Jordan and its major trading partners. Journal of International Business and Economics, 3(1), 93–26. https://doi.org/10.15640/jibe.v3n1a11
- Apergis, N. Asymmetric real exchange rate pass-through and poverty in China: Evidence from a nonlinearmodel. (2015). Applied Economics Letters, 22(12), 951–954. 2014. https://doi.org/10.1080/13504851:
- Arize, C. A., Malindretos, J., & Nam, K. (2010). Cointegration, dynamic structure, and the validity of purchasing power parity in African countries. International Review of Economics & Finance, 19(4), 755–768. https://doi.org/10.1016/j.iref.2010.04.004
- Arsac, M. L., & Deschodt-Arsac, V. (2018). Detrended fluctuation analysis in a simple spreadsheet as a tool for teaching fractal physiology. Adv Physiol Education, 42(3), 493–499. https://doi.org/10.1152/advan.00181.2017
- Bahmani-Oskooee, M., Chang, T., & Lee, K. (2015). Purchasing power parity in emerging markets: A panel stationarity tests with both sharp and smooth breaks. Journal of Economic Systems, 40(3), 453–460. https://doi.org/10.1016/j.ecosys.2015.12.002
- Behera, R. S. (2019). Purchasing power parity tests in cointegrated panels’ evidence from newly industrialised countries. Journal of Economic Development, 44(Number 1), 69–95. https://doi.org/10.35866/caujed.2019.44.1.004
- Cassel, G. (1918). Abnormal deviations in international exchanges. The Economic Journal, 28(112), 413‐415. https://doi.org/10.2307/2223329
- Cassel, G. (1922). Money and foreign exchange after 1914. Macmillan.
- Chang, Y., Kim, C. S., Miller, J. I., Park, J. Y., & Park, S. (2014). Time-varying long-run income and output elasticities of electricity demand with an application to Korea. Energy Economics, 46, 334–347. https://doi.org/10.1016/j.eneco.2014.10.003
- Chang, T., Lee, C., Chou, P., & Tang, D. (2011). Revisiting long-run purchasing power parity with asymmetric adjustment for G-7 countries. Japan and the World Economy, 23(4), 259–264. https://doi.org/10.1016/j.japwor.2011.09.001
- Chang, T. Y., Su, C. W., & Lee, C. H. (2012). Purchasing power parity nonlinear threshold unit root test for East- Asian countries. Applied Economic Letters, 19(10), 975–979. https://doi.org/10.1080/13504851.2011.608641
- Chen, Z., Ch, P., Ivanov, K. H., & Stanley, E. H. (2002). Effect of nonstationarities on detrended fluctuation analysis. Physical Review E, 65(4), 041107–1. https://doi.org/10.1103/PhysRevE.65.041107
- Chen, B., & Hong, Y. (2012). Testing for smooth structural changes in time series models via nonparametric regression. Econometrica, 80, 1157–1183. https://do.org/103982/ECTA7990
- Chen, M., & Hu, X. (2018). Linkage between consumer price index and purchasing power parity: Theoretic and empirical study. The Journal of International Trade & Economic Development, 27(7), 729–760. https://doi.org/10.1080/09638199.2018.143
- Dornbusch, R. (1976). Expectations and exchange rate dynamics. Journal of Political Economy, 84(6), 1161–1176. https://doi.org/10.1086/260506
- Enders, W., & Chumrusphonlert, K. (2004). Threshold cointegration and purchasing power parity in the Pacific nations. Applied Economics, 36(9), 889–896. https://doi.org/10.1080/0003684042000233104
- Engle, F. R., & Granger, C. W. J. (1987). Co-integration and error correction: Representation, estimation, and testing. Econometrica, 55 (2), 251–276. https://doi.org/10.2307/1913236
- Giraitis, L., Kapetanios, G., & Yates, T. (2014). Inference on stochastic time-varying coefficient models. Journal of Econometrics, 179(1), 46–65. https://doi.org/10.1016/j.jeconom.2013.10.009
- Gyamfi, E. N., & Appiah, E. F. (2018). Further evidence on the validity of purchasing power parity in selected African countries. Journal of Economics & Finance, 37(2), 330–343. https://doi.org/10.1007/s12197-018-9449-7
- Huang, C. H., & Yang, C. H. (2015). European exchange rate regimes and purchasing power parity: An empirical study on eleven Eurozone countries. International Review of Economics & Finance, 35, 100–109. https://doi.org/10.1016/j.iref.2014.09.008
- Hu, K., Ivanov, P. C., & Chen, Z., P. Carpena, P., Eugene Stanley, H. (2001). Effect of trends on detrended fluctuation analysis. Physical Review E, 64(1), ID 0111114. https://doi.org/10.1103/PhysRevE.64.011114
- Jiang, C., Jian, N., Liu, T. Y., & Su, C. W. (2016). Purchasing power parity and real exchange rate in central-eastern European countries. International Review of Economics & Finance, 44, 349–358. https://doi.org/10.1016/j.iref.2016.02.006
- Joseph, L. N., Vo, A. T. T., Mobarek, A., & Mollah, S. (2020). Volatility and asymmetric dependence in Central and East European stock markets. Review of Quantitative Finance & Accounting, 55(4), 1241–1303. https://doi.org/10.1007/s11156-020-00874
- Kim, H., 2011. VECM Estimations of the PPP Reversion Rate Revisited: The conventional role of relative price adjustment restored. Working Paper - MPRA
- Kyei-Mensah, J. (2019). Purchasing power parity in some African countries using a nonlinear panel unit root test. The Journal of Applied Business and Economics, 21(7), 2019. https://doi.org/10.33423/jabe.v21i7.2549
- Lee, H., & Lee, J. (2015). More powerful Engle-Granger cointegration tests. Journal of Statistical Computation and Simulation, 85(15), 3154–3171. https://doi.org/10.1080/00949655.2014.957206
- Li, D., Phillips, C. B. P., & Gao, J. 2017. Kernel-based inference in time-varying coefficient cointegrating regression Discussion Paper 3009.
- Ma, W., Li, H., & Park, S. Y. (2017). Empirical conditional quantile test for purchasing power parity: Evidence from East Asian countries. International Review of Economics & Finance, 49, 211–222. https://doi.org/10.1016/j.iref.2017.01.029
- Marton, L. F., Brassai, S. T., Bako, L., & Losonczi, L. (2014). Detrended fluctuation analysis of EEG signal. Procedia Technology, 12, 125–132. https://doi.org/10.1016/j.protcy.2013.12.465
- Moatsos, M. 2020. Why PPP exchange rates should be avoided in global poverty estimates. Working Paper
- Morley, T., & Lo, M. C. (2015). Bayesian analysis of nonlinear exchange rate dynamics and the purchasing power persistent puzzle. Journal of International Money & Finance, 51, 285–302. https://doi.org/10.1016/j.jimonfin.2014.12.003
- Musa, N., Ngozi, T. I. A., Blessing, A. G., & Ngozi, V. A. (2021). Purchasing power parity approach to exchange rate misalignment in Nigeria. CBN Journal of Applied Statistics, 12(1), 45–75. https://doi.org/10.33429/Cjas.12121.3/6
- Oh, D.-Y., Lee, H., & Meng, M. (2018). More powerful threshold cointegration tests. Empirical Economics, 54(3), 887–911. https://doi.org/10.1007/s00181-017-1243-4
- Park, J. Y. (1992). Canonical cointegrating regressions. Econometrica: Journal of the Econometric Society, 60(1), 119–143. https://doi.org/10.2307/2951679
- Park, Y. J., & Hahn, B. S. (1999). Cointegrating regression with time-varying coefficients. Econometric Theory, 15(5), 664–703. https://doi.org/10.1017/S0266466699155026
- Park, C., & Park, S. (2015). Time-varying cointegration models and exchange rate predictability in Korea. KDI Journal of Economic Policy, 37(4), 1–20. https://doi.org/10.23895/kdijep.2015.37.4.1
- Peng, C.-K., Buldyrev, S. V., Havlin, S., Simons, M., Stanley, H. E., & Goldberger, A. L. (1994). Mosaic organisation of DNA nucleotides. Physical Review E, 49(2), 1685–1689. https://doi.org/10.1103/PhysRevE.49.1685
- Peng, H. F., Liu, Z. J., & Chang, T. Y. (2017). Revisiting purchasing power parity in BRICs countries using more powerful quantile unit root tests with stationary covariates. Communication in Statistic-Theory and Methods, 46(20), 10051–10057. https://doi.org/10.1080/03610926.2016.1228968
- Rogoff, K. (1996). The purchasing power parity puzzle. Journal of Economic Literature, 34, 647–668. http://www.e-jel.org/archive/june1996/Rogoff.pdf
- Su, C. W., Chang, H. L., Chang, T. Y., & Lee, C. H. (2012). Purchasing power parity for BRICs: Linear and nonlinear unit root tests with stationary covariates. Applied Economic Letters, 19(16), 1587–1591. https://doi.org/10.1080/13504851.2011.639732
- Su, J. J., Cheung, A., & Roca, E. (2014). Does purchasing power parity hold? New evidence from wild‐bootstrapped nonlinear unit root tests in the presence of heteroskedasticity. Economic Modelling, 36, 161–171. https://doi.org/10.1016/j.econmod.2013.09.029
- Taylor, M. (1988). An empirical examination of long run purchasing power parity using cointegration techniques. Applied Economics, 20(10), 1369–1381. https://doi.org/10.1080/00036848800000107
- Vo, H. L., & Vo, D. H. (2022). The purchasing power parity and exchange-rate economics half a century on. Journal of Economic Surveys, 1–33. https://doi.org/10.1111/joes.12504
- Yıldırım, D. (2017). Empirical investigation of purchasing power parity for Turkey: Evidence from recent nonlinear unit root tests. Central Bank Review, 17(2), 39–45. https://doi.org/10.1016/j.cbrev.2017.03.001
- Yue, J., Zhao, X., & Shang, P. (2010). Effect of trends on detrended fluctuation analysis of precipitation series. HindawiPublishing Corporation, Article, ID 749894, 15. https://doi.org/10.1155/2010/749894
- Zayed, N. M., Chowdhury, F. N., & Hasan, R. K. B. M. (2018). Testing the Balassa-Samuelson model to examine purchasing power parity of Bangladesh with reference to 1972-2016. Academy of Accounting & Financial Studies Journal, 22(Number 1). 1528-2635-22-1-139.
- Zayed, N. M., & Zahan, N. A. (2017). An analysis of purchasing power parity using the Ricardian model regarding real exchange rate, inflation and import of Bangladesh. Australian Academy of Accounting and Finance Review, 3, 111–118.
- Zhang, T., & Wu, W. B. (2012). Inference of time-varying regression models. Annals of Statistics, 40(3), 1376–1402. https://doi.org/10.1214/12-AOS1010
- Zhou, S., & Kutan, A. M. (2014). Smooth structural breaks and the stationarity of the Yen real exchange rates. Applied Economics, 46(10), 1150–1159. https://doi.org/10.1080/00036846.2013.868587
- Zhou, Z., & Wu, W. B. (2010). Simultaneous inference of linear models with time-varying coefficients. Journal of the Royal Statistical Society, 72(4), 513–531. https://doi.org/10.1111/j.1467-9868.2010.00743.x