
 ?Mathematical formulae have been encoded as MathML and are displayed in this HTML version using MathJax in order to improve their display. Uncheck the box to turn MathJax off. This feature requires Javascript. Click on a formula to zoom.
Abstract
In this paper, we explore how asset returns used as a proxy to detect interconnectedness of systemic risk in the financial system. Our sample employs a mixture of Indonesian banks’ public and prudential data over the 2012–2019 period. Using the Principal Component Analysis and Granger causality the core banks in the network could explain the variance, risk co-movement, and show shocks propagation. Further, the results are also in line with Basel indicator-based to score the interconnectedness. The dominance of big size banks in the centrality measures raises issue of substitutability. This paper outstretched theories and their application provides a basis for policy makers to develop supervision frameworks to mitigate systemic risk.
1. Introduction
Network model application to study systemic risk gain popularity as it allows researchers to highlight market infrastructure oversight with different data and statistical methods. The importance of systemic risk study using network model draw attention and highlighted by The European Central Bank discussed the advanced methods employed in network analysis (ECB, Citation2009b). The avenue to explore the correlated exposure within the network of financial institutions started far before the 2007–2008 Global Financial Crises. Seminal papers by Allen and Gale (Citation2000) discuss the possibility of contagion and risk allocation structure, and Eisenberg and Noe (Citation2001) in their effort modelled the cyclical interdependence using clearing vectors. The curiosity accentuates when we consider the outcomes compared to the Basel indicator-based method. Basel Systemically Important Banks (SIBs) is a guideline for all Basel Committee and Banking Supervision (BCBS) member countries including Indonesia and a reference for the bank supervisors (BCBS, Citation2018). Despite growing number of papers discussed systemic risk using network model, none of the above manuscripts empirically investigate systemic banks use network model and Basel indicator-based method simultaneously. Several reasons for this can be tracked to the research constraint and technical issues to access restricted prudential data. The absence raises questions how assets returns could indicate risk escalation and identify important banks that could trigger systemic risk in the Indonesia banking network. It is also appealing to know how the results based on the public data compare to the Basel that employs prudential dataset. The gaps motivate us to conduct research which is robust and incorporate the theoretical and practical application of systemic risk in the banking system.
We hypothesise that number of banks could explain variance volatility within the market when they are highly interconnected. Our hypothesis based on the importance degree of asset returns interconnectedness ordered in orthogonal factor highlights the systemic banks within the system. The hypothesis explores the interconnectedness employs several centrality values and compare the result with the Basel. The essence of knowing the intercorrelated exposures is crucial for policy maker and supervisor to forecast and mitigate future crises.
The conceptual framework of this study is to observe simultaneously co-movement of financial time series and inter relation. Theoretically, financial institutions interactions create complex network that could trigger systemic failure through interconnectedness. Intercorrelated exposures within the banking system and its impact to the economy provide the base for policy maker and scholars to develop network model of systemic risk. After the pioneer study of Allen and Gale (Citation2000) and Eisenberg and Noe (Citation2001), Gai and Kapadia (Citation2010) exhibits financial system feature robust-yet-fragile tendency. Another sample proponents of systemic risk study using network model such as Krause and Giansante (Citation2012), Elsinger et al. (Citation2006a), Billio et al. (Citation2012), and Chan Lau (Citation2010). The application of network model research on emerging economy evidence like Cont, Moussa, and Santos (Citation2013), Chan Lau (Citation2010), Fang et al. (Citation2018), and Das (Citation2016). Furthermore, systemic risk study useing Indonesia banking datasets is quite restricted. Recent paper by Rizan et al. (2022) investigated how the macroeconomics variables integration into the technical calculation systemic risk assessment using CoVaR, MES, and SRISK. Asafo-Adjei et al. (Citation2021) used CoVaR, MES, and SRISK, Koesrindartoto and Aini (Citation2020) employ VaR, MESh, MESdcc, and LRMES, Raz (Citation2018) employ z-score and Delta-CoVaR, and Ayomi and Hermanto (Bengtsson et al., Citation2013) used CoVaR. Others like Muhajir et al. (Citation2020) employed the copula approach, and Wibowo (Citation2017) used distance to default. The causal effect of series to other series in the context of systemic risk resembles the potential of systemic risk in the financial system (Billio et al., Citation2012). The conceptual framework of this study to observe simultaneously co-movement of financial time series and inter relation.
This paper follows empirical approach as Billio et al. (Citation2012) take on Principal Component Analysis (PCA) to measure the institution’s risk commonality returns and direction. PCA offers advantage to reduce data dimension, increasing interpretability, and minimizing information loss (Jolliffe & Cadima, Citation2016). The use of PCA could detect the downside risk of large financial institutions failure (Baek et al., Citation2015; Billio et al., Citation2012). We also employ Granger causality to examine the systemically important banks within the banking network. Granger causalities fill the need of systemic risk scholars to map institutions could possibly trigger the systemic risk within the financial network (Balboa et al., Citation2015; Billio et al., Citation2012; Mazzarisi et al., Citation2020; Zheng & Song, Citation2018). Further in analysis, the systemic banks score also calculated refer to Basel interconnectedness with purpose to contrast to the former method. Basel standards are the guidelines for the BIS member countries including Indonesia. The adoption of Basel accords shapes the comparability and widely acknowledged for prudential regulations.
Our approach uses Indonesian banking data of which the largest economy in the ASEAN and one of the G20 member countries. The Indonesian banks diversity also engaging for investigation with more than 100 commercial banks operate so this will add insights of the interaction over periods. Outcomes from this research will be valuable to enhance our grasp on systemic risk study in particular risk co-movement and interconnectedness, systemic bank within banking network and the results stands compared to the Basel guideline. The results also beneficial for the bank supervisor concerning to assess the overall risk of the financial system and to identify the important bank in the financial system wide.
The study finds that stock market data could be used as a proxy to identify returns co-movements which indicate the interconnectedness in the banking system. We discover the first three principal components of PCA to seize the significant portion of the variance. It envisages the increase of risk commonality and persistent intercorrelated exposures within sample. Our paper also discovers that Granger centrality method recognizes the core banks in Indonesia banking network as they are dominated by big banks. The outcome raises issue of substitutability because of big size banks dominant factor. Further, the supreme of big size banks also inline vis-à-vis the Basel indicator based as employed by policy maker.
This manuscript contributes to existing studies to gauge the systemic banks based on robust statistical methods using market data and compare it to the Basel interconnectedness results derived from prudential bank granular. The results are also applicable to shape supervision framework beyond banking entities. It is also a pioneer study in the Indonesia banking context to estimate systemic risk utilize network model approach. As discussion progresses, the paper is structured as follows: Section II discusses on literature review where contain previous studies and highlight the importance network model approach on systemic risk avenue. Section III contains data and methodology framework used. Section IV presents the analytical results and interpretation and the Section V accommodates conclusion and policy recommendation.
2. Literature review
2.1. Theoretical approaches
Policy makers the FSB, IMF and BIS (Citation2009) define systemic risk as a risk of disruption to financial services that caused an impairment of all or parts of the financial system and has the potential to have serious negative consequences for the real economy, ECB (Citation2009a) defines systemic risk as to the risk of financial instability that impairs the functioning of a financial system where economic growth and welfare suffer significantly. Bank Indonesia (Citation2014) as the macro-prudential regulator of Indonesia’s define systemic risk as to the potential instability to financial system-wide as the result of exaggerating procyclicality actions of financial institutions. No uniformity of systemic risk definition reflects the complexity of factors surrounding systemic risk study. Nevertheless, though no consensus of definition, the catastrophic effect of systemic failure is clearly more unanimous in expense.
The economic cost of the latest 2008 banking crises was catastrophic and raise the critique of society considering the amount of bailout and the further impact on the economy. The output losses associated with the crises range from several trillion to over $10 trillion. Research by (Boyd et al., Citation2005) indicate that the more persistent effect of the crises prior to 2007, indicate that output losses reached more than 100 percent of pre-crises GDP. The financial crises also impacted unemployment, household wealth, and number of foreclosures. Basel Committee on Banking Supervision (2010) reported the cost of the banking crises using the approach of the GDP trend shifting after the crises compare to pre-crises GDP trend where the cumulative losses of the crises could be bigger if the losses are estimated in the long run.
Survey papers by De Bandt and Hartmann (Citation2000) define systemic risk as a systemic event that affects a considerable number of financial institutions or markets in a strong sense, thereby severely impairing the general well-functioning of the financial system. Some approach attach the definition to the researches variable like intercorrelated exposures (V. V. Acharya et al., Citation2017), set of circumstances that threatens the stability of public confidence in the financial system (Billio et al. (Citation2012). Shortly, various indicators should be taken into account by regulators and researchers to assess the complexity of systemic risk (Bengtsson et al., Citation2013).
Taxonomy researches on SIBs and systemic risk are classified based on the statistics estimation, variables, methodologies, and intercorrelated interactions known as network model. Bisias et al. (Citation2012) classify the study by supervisory scope, research methodology, data employ in the manuscripts and offer definitions for the risks measurement to include required inputs, expected outputs, and data condition. Still based on the same paper, direction of systemic risk papers could be classified into five major categories; First, probability distribution using cross section data, such as Adrian and Brunnermeier (Citation2016) proposed CoVaR to calculate the VaR of banks and its risk effect on other banks when the financial system is under stress. Other by (V. Acharya et al., Citation2012); Acharya (Citation2009); V. V. Acharya et al. (Citation2017) introduced marginal and systemic expected shortfall (MES-SES) with purposes to measure financial institutions expected losses when the market falls below some predefined threshold over a given time horizon. Another by Brownlees and Engle (Citation2017) introduced Systemic Risk Measure (SRISK) to capture the expected capital shortage of a firm given its degree of leverage and marginal expected shortfall as the expected loss an equity investor in a financial firm would experience if the overall market declined substantially. Second, contingent claims and default and liquidity, estimate the probability of default of each institution and their link to financial system-wide through joint distribution. Sample papers under this category like A. Jobst and Gray (Citation2013), A. A. Jobst (Citation2014). Third, network analysis method measures the connectedness between the banks and its failure impact on other banks and financial system. Samples under this category are Allen and Gale (Citation2000), Eisenberg and Noe (Citation2001), Gai and Kapadia (Citation2010), Gai et al. (Citation2011). Fourth for others, like extreme value theory (EVT) to investigate the contagion risk such as Rocco (Citation2014), Dias (Citation2014), Akhter and Daly (Citation2017), and Daly et al. (Citation2019), co-movement Idun et al. (Citation2022).
Sample of systemic risk study on emerging economies like Roengpitya and Rungcharoenkitkul (Citation2011) on the study of systemic risk using Thailand banking system data find that bigger bank contributes more to the systemic risk; however the size is far from being the dominant factor. Using monthly banking supervision data, they applied the concept of CoVaR as introduced by Adrian and Brunnermeier (Citation2016) to measure the financial linkages and revealed institutions which are more financially linked affect more the systemic risk in the banking system. Cont, Moussa, and Santos (Citation2013) apply mutual exposures and capital level of Brazil banks. They find that interbank network exhibit a complex heterogeneous structure and concentrated on ad few nodes, balance sheet size alone is not a good indicator for systemic importance, and propose the contagion index. Chan Lau (Citation2010) use balance sheet-based network from direct exposures in Chile. They suggest financial surveillance is better focused on the linkages of domestic banks with foreign banks and non-bank financial institutions. Fang et al. (Citation2018) use China banks datasets compare five popular systemic risk banking. They combine the systemic risk measure based on principal component analysis provides a reliable ranking. Another such Das (Citation2016) take on India banking propose systemic risk approach based on the level of nodes vulnerability. They developed system-wide score with new aggregate score, normalized, fragility. It also considers the risk decomposition and spillover risk.
From Indonesia context, the studies on banking systemic risk are quite limited. Recent paper by Asafo-Adjei, Adam, et al. (Citation2022) investigated how the macroeconomics variables integration into the technical calculation systemic risk assessment using CoVaR, MES, and SRISK. Using fixed and random effect, finite mixture model, and GARCH they show that stock beta, market index, and exchange rate amplify systemic risk. Asafo-Adjei et al. (Citation2021) modelled Indonesia systemic banks using CoVaR, MES, and SRISK. They exhibit the intertheoretical model correlation and approximate its ranking results concordance to Basel indicator-based methodology as applied by the policy maker. Paper by Koesrindartoto and Aini (Citation2020) regressed bank characteristic to systemic risk employ VaR, MESh, MESdcc, and LRMES, Muhajir et al. (Citation2020) develop joint default probability index using the copula approach, Wibowo (Citation2017) used Merton’s distance to default measure the effect of bank capital buffer and leverage to systemic risk. Raz (Citation2018) employs z-score and Delta-CoVaR to estimate the idiosyncratic and systemic risk, and Bengtsson et al. (Citation2013) applied the Merton model to identify the probability of default over 30 banks in Indonesia during the period of 2002–2013.
2.2. Network model method
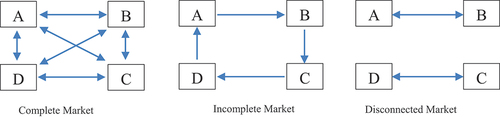
Network theory as branch of systemic risk gained popularity to model the financial institutions failure far before the 2007–2008 financial crises. Allen and Gale (Citation2000) in their seminal paper of systemic risk study show how the structure of market could affect the systemic risk impact. They found that complete structure of proof more robust than incomplete one. The robustness as the consequence of risk allocation to each participant in the financial market. The type of market structure elaborated by Allen and Gale (Citation2000) is displayed in Figure .
Figure 1. Market structure banking system structure play important role to contain the systemic risk. Heterogenous market make banking system sounder to financial shocks.
Eisenberg and Noe (Citation2001) modelled the cyclical interdependence using a mechanism that shows how clearing vectors exist, multidimensional and depends on several aspects. Another strand of systemic risk researches imposed on network models such as Gai and Kapadia (Citation2010) exhibits how financial system features robust-yet-fragile tendency where the probability of systemic failure might be low but the impact could be severe when occur.
Similar strands of studies as Cont, Moussa, and Santos (Citation2013) when analyzed the Brazil individual banks balance sheet and network structure in 2007–2008 and the failed banks contribution to systemic risk. Using a metric for the systemic importance of institutions named the Contagion Index they measured the expected loss to the network triggered by the default of an institution in a macroeconomic stress scenario. Another study from Krause and Giansante (Citation2012) developed a model of interbank loans given and received by banks of different sizes. In their findings the size of the failing bank has limited impact on the number of banks affected by contagion. They concluded the bank’s network structure has much more significant impact on systemic risk. Also under this method are papers from Elsinger et al. (Citation2006a) on the extended model used by Eisenberg and Noe (Citation2001) to include uncertainty to quantify the correlated exposure and domino effect, and Elsinger et al. (Citation2006b) which analyzed the network analysis correlated exposure and mutual credit relation that may cause domino effect. For the analysis part we follow Billio et al. (Citation2012) when analyze US financial institutions proposed PCA and Granger causality network to measure the interconnectedness of hedge fuds, banks, brokers/dealers, and insurance companies. The methods could identify and quantify the predictive power of interconnectedness among sectors. Other sample use of PCA and Granger causality for systemic risk and spillover detection also adopted by Hong et al. (Citation2009), Balboa et al. (Citation2015), and Fang et al. (Citation2018).
2.3. Basel indicator-based guideline
The first guideline to identify systemic bank was issued by Basel in 2011 as the response of 2007–2008 global financial crises (BCBS, Citation2011). The background was harmful failure effect of large institutions transmitted shock across border. The negative externalities encompassed economic crises, corporate bankruptcies, GDP losses, unemployment) (BCBS, Citation2012). The Basel G-SIBs guideline evaluate banks number into five categories consist of 13 indicators: cross-jurisdictional activity, size, interconnectedness, substitutability, and complexity. The score calculation relatively simple where the weight proportion is equally divided into 12 indicators from the data which are compiled from the micro level or bank balance sheet data.
Basel provide room of discretion for the local bank authority to adjust indicators in order to better capture domestic banks characteristics and specific of the local economy (BCBS, Citation2012). For our dataset, we adjust the formulae composition and re-arrange the indicators following POJK No. 2/POJK.03/2018 (OJK, Citation2018). OJK as the banking supervisor simplified the guideline into three categories consist of size, interconnectedness, and complexity with total eight equal weight indicators. The newest Basel then introduce trading volume indicator, change of percentage weights for the substitutability, and extension to insurance subsidiaries (BCBS, Citation2018).
Apart of numbers systemic risk study none of the above manuscripts empirically investigate systemic banks simultaneously using the network model and Basel guideline methodology. This paper fills space by employs PCA and Granger causality (Billio et al., Citation2012) to spot the systemic banks based on market data and compare it to the Basel interconnectedness results built on micro prudential bank data BCBS (Citation2018). The results will be fruitful for regulatory bodies to monitor the risk escalation to impede systemic risk as this study also a pioneer to estimate systemic risk adopting network model approach in the Indonesia context.
3. Data and methodology
3.1. Source of data
We use all the commercial banks listed in the Indonesia Stock Exchange (JSX) during the period 2012–2019. The chosen particular time frame in line with the Indonesia SIBs regulations issued by OJK (OJK, Citation2015) and it also more current and improves the information made available to the regulator. The samples are 33 banks then reduce to 27 banks because of inactive trading or data missing. Shares price, outstanding shares, JSX index, and market capitalization of Indonesia banks are in daily frequency. For the total assets and total equity, the data are in quarterly. All market data are sourced from Eikon Thomson Reuters databases.
In addition, for the Basel interconnectedness calculation we gather the monthly balance sheet reports submitted to OJK. It encompasses all 115–120 Indonesia commercial banks. The number are varying because of mergers and acquisition, and license revoked during the model estimation period. For each category of Basel method, we also need details of the data accounts also like intra-financial assets, intra-financial liabilities, and securities outstanding. Moreover, structure of data requires us also to compile second tier of balance sheet detail i.e., secured debt, senior unsecured debt, subordinated debt, and equity market capitalization. To compare PCA and Granger causality results with the Basel method we tick it to 2016–2018.
3.2. Model estimation
Our paper use three methods to test the hypothesis. First, we adopt principal component analysis (PCA) to measure the interconnectedness of asset returns of Indonesia banks. PCA offers advantage to reduce data dimension, increasing interpretability, and minimizing information loss (Jolliffe & Cadima, Citation2016). The use of PCA could detect the downside risk of large financial institutions failure (Baek et al., Citation2015; Billio et al., Citation2012). Second, we employ Granger causality to evaluate the risk spread direction among banks. It consists of several network indicators: degree of causality, number of connections, closeness, and eigenvector centrality. Granger causalities fill the need of systemic risk scholars to map institutions could possibly trigger the systemic risk within the financial network (Balboa et al., Citation2015; Billio et al., Citation2012; Mazzarisi et al., Citation2020; Zheng & Song, Citation2018). For the PCA and Granger causality we follow Billio et al. (Citation2012). Third, follow the Basel indicator-based methodology to calculate the systemic risk ranking in Indonesia banking environment. Basel standards are the guidelines for the BIS member countries including Indonesia. The adoption of Basel accords shapes the comparability and widely acknowledged for prudential regulations.
3.3. Principal component analysis
High frequency data and use of PCA as an adaptive descriptive statistic is applied in many research fields. The implementation of PCA to analyse systemic risk as Billio et al. (Citation2012); Fang et al. (Citation2018), and Baek et al. (Citation2015). We conform Billio et al. (Citation2012) to measure the degree of interconnectedness asset returns of financial institutions into orthogonal factors of decreasing explanatory power.
= stock return of institutions i, i = 1, … .,N, system aggregate return
,
and Var[
to have
with is the standardized return of institutions k and
is the variance of the system. If we put
the k-th eigenvalue with N zero mean uncorrelated variables
where is a factor loading for
for an institutions i. Then we have
focus on subset n < N where this set seize most of the volatility during the crises and indicate the increase of interconnectedness among the banks. If total risk of the system defines as and
the risk associated with the first principal components
. The contribution of PCAi,n of institution i to the risk of system
3.4. Granger causality
Linkage of network model approach with the Granger causality build on its ability to predict the forecast of value based on other time series past information. In the capital market where frictions are existing the Granger causality appear in the assets return based on other institutions returns indicate the spill over risk (Balboa et al., Citation2015; Billio et al., Citation2012; Mazzarisi et al., Citation2020; Zheng & Song, Citation2018). To evaluate the direction of risk spreading in the financial system during the crises we use Granger causality. Please refer to Billio et al. (Citation2012) for complete formula description.
The interconnectedness measures consist of:
a. Degree of Granger causality (DGC) measure the association of N(N-1) pairs of N banks:
3.4.1. Number of connections to capture the importance of banks during the systemic event:
where S: system, #Out: number of banks Granger-caused by institution j, and #In: number of banks Granger-cause institution j, and #In+Out: the sum.
3.4.2. Sector-conditional connections is used to analyse types of banks KBMI affect the other classes:
where M: banks KBMI 1–4, #Out-to-Other: number of banks KBMI Granger-caused by institution j, and #In-from-Other: number of banks KBMI Granger-cause institution j, and #In+Out-Other: the sum of two.
3.4.3. Closeness to estimate the shortest edges between financial institutions defined as
3.4.4. Eigenvector centrality is the signal of bank significance within the network based on their connection to other banks
3.5. Basel-indicator based
The discussion of systemic risk methods nowadays mostly using publicly available data and create gaps how the results connect to the Basel outcome. The connection is crucial as the Basel indicator-based method is the guideline currently used by the central bank and bank supervisor to shortlist the SIBs. BCBS (Citation2018) indicator-based approach to value the institution size, interconnectedness, substitutability, global cross-jurisdictional activity, and complexity. Basel allow departure from guideline asserted by BCBS (Citation2012) with the purpose to better capture specific Domestic Systemically Important Banks (D-SIBs) characters and country externalities. For our dataset, we adjust the formulae composition and re-arrange the indicators following POJK No. 2/POJK.03/2018. The SIBs assessment indicators after country adjustment as in Table .
Table 1. Basel adjusted indicators. Basel allow domestic policy maker to adjust the indicators to capture country banks characteristics
To get the score value for a given indicator, we follow BCBS (Citation2014) where the bank’s value is divided by the total of banking system where the results conveyed in basis points. (bps)
For Basel network map we focus on the interconnectedness score category only. It is the average of intra-financial assets, intra-financial liabilities, and securities outstanding.
4. Results
4.1. Statistics summary
The datasets are classified following OJK (Citation2021) where the banks are grouped into four classes of KBMI based on their core capital. The classes determined bank business network and activities where the most complex activities were licensed for banks classified in KBMI 4, while KBMI 1 only permitted to offer basic banking services. The excel worksheet compile shares price, market capitalization, total assets, total equity, and sample groups. Share prices, market capitalization, JSX LQ45 excess return, and JSX financial sector excess return are provided in a daily basis. Others, like total assets and total equity are in a quarterly basis. The sample banks are listed in Table .
Table 2. Sample banks the banks are classified based on core capital of which determine its operational activities
In total there are 1,864 daily observations for each variable range from 2012–2019. To estimate the PCA and Granger causality we use Belluzo (Citation2020) Matlab code for systemic risk. Based on analysis of mean daily return as shown in Table , MAYA and BNI confer the highest with 0.18%, 0.14% followed by MEGA, BACA, and CCBI with 0.1%. The results showcase that the most profitable banking shares returns during 2012–2019 if an investor invested their money by buying MAYA and BNI shares.
Table 3. Summary statistic daily returns. The results derived by STATA using daily share price data
BNI return distribution curve positively skewed and left leaning from the mean. During the same period investors will suffer losses if invest their money in the BBKP, MNC, Maybank, and BAG with losses estimated at −0.03%, −0.02%, −0.01% respectively. Though BBNI offered one of the highest paybacks its deviation also high enough with 4.59% followed by MAYA with 4.53%. Moreover, the return correlation discloses that BRI—BMRI have the strongest association with 65.89% followed by BMRI—BCA and BRI—BCA with 49.89% and 49.79% respectively. We can interpret this as there are indications of co-movement across the banking shares and reflect the exposures interconnectedness in their banking activities. Others than that there is quite strong interrelation also for BTN—BCA, BJTM—BJBR, BDMN—BRI, BDMN—BMRI, and BNI—BRI as can be seen in Table . The correlation mostly dominated for banks under KBMI 4 and KBMI 3. However, we should be aware that news (Nguyen et al., Citation2021; Ponziani, Citation2022), shock transmission (Asafo-Adjei, Emmanuel, Agyei, et al. Citation2022), frequency-dependent dynamics (Asafo-Adjei, Adam, et al., Citation2022), products types (Hati et al., Citation2022) also might impact the stock returns at industry and firm level.
Table 4. Returns correlation reflect the co-movement of share price and early indication of interconnectedness in the system
4.2. Empirical analysis
4.2.1. Principal component analysis
As discussed in section III. B. when small number of institutions principal component variance could explain the volatility within the market then the system is highly interconnected stated in the condition as . As Billio et al. (Citation2012) to assess the time variation of
we could detect accumulation of interconnectedness or correlation and integration that contribute to the systemic risk. The cumulative risk fraction represented by eigenvalues are exhibit in Figure .
Figure 2. Principal component analysis.
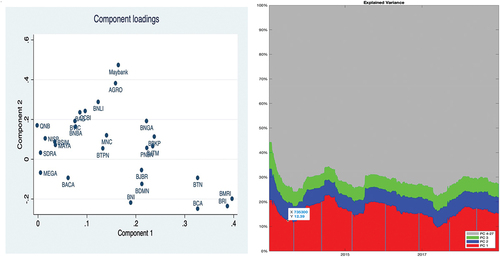
The first three components in the sample represented as PC1, PC2, and PC3 could seize significant portion of the variance. The escalation proportion convey the information that intercorrelated exposures within sample banks also getting higher and persistent. The highest linkage was in the early 2012 with PC1-PC3 represents around 44% of return variation then followed in the end of 2014 with 35%. Additionally, the eigenvalue (component loading plotting shows the explained variance centered around 3–4 banks groups. BRI-BMRI-BCA-BTN grouped in the same section of right side of plotting picture. These outcomes could give indication that some banks have closer interconnectedness through inter-financial assets or inter-financial liabilities exposures. Bank supervisor could also classify the grouping and adjust it for their routine banks monthly report analysis. There are also noticeable patterns of movements along the curve: PC1-PC3 have co-movement return. It will be interesting to gather more data for longer window observation time covering the period of 2007–2008 global financial crises and COVID-19 crises.
Referring to Table for eigenvalue we can spot in Comp1-Comp3 work toward the same direction of what Figure has. For instances in the Comp1 three biggest contributors are BCA-BRI-BMRI with 32.69%, 38.79%, and 39.75% all under KBMI 4. The Comp2 convey Maybank and BNLI with 47.1% and 28.75%. Moreover, in the Comp3 the NISP, SDRA, and MAYA estimated at 43.26%, 34.08%, and 32.59%. The Comp1-Comp3 benefactor arguably come from big banks (KBMI 4 and KBMI 3) with exception of SDRA (KBMI 2) in Comp3. As Billio et al. (Citation2012) bigger PCA score hints the interconnectedness risk build up within the banking system. Specifically, since the big banks domination the bank policy maker will be beneficial to scrutinize the correlated exposures among them. The dominance of big banks is alluring for next research to explore use of balance sheet variables such as total assets and total equity.
Table 5. Principal component (Eigenvectors) − 15 components escalation proportion delivers intercorrelated exposures. The table exhibit the dominance of big banks in the Indonesia financial system
4.3. Granger causality
The Granger causality offers several measures of correlated exposure of financial institutions to capture specific character of edges (Balboa et al., Citation2015; Billio et al., Citation2012; Mazzarisi et al., Citation2020). To detect whether a bank Granger cause by institution j or banks Granger cause institution j, where the r1t and r2t represent the returns. Following AR(1) model then,
where and
uncorrelated white noise processes and
are model coefficients.
To choose the most fit lag of VAR model we run the lag order pre-estimation analysis and find the best is 1 lag under Akaike information criterion (AIC) and final prediction error (FPE) while likelihood ratio (LR) is model with eight lagged. Some outcome samples of Granger causality test for all samples are displayed in Table .
Table 6. Granger causality lag (1) and (8) sample. Describe the interactions across different time lags (full results available upon request)
The output of several centrality measures in Figure delivers important key information:
Figure 3. Centrality measures. Picture of banks network centrality across different measures.
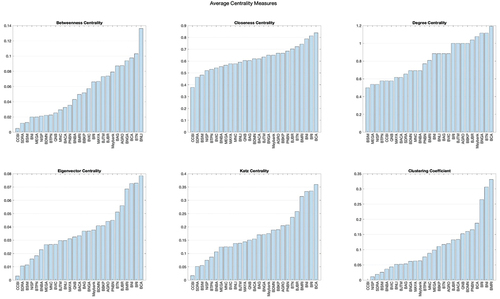
Degree Granger centrality, represent number of edges point to a node. Based on the picture BCA is the key player in Indonesia banking in terms of network adjacency with 1.19. It is followed by BTN and BNGA sharing the same score 1.11, and Maybank at 1.07. Number of edges indicate the importance of that bank within the banking system. The importance could also lead to the substitutability issues of which become one the Basel attention (BCBS, Citation2018). This could contemplate also on the banks network is significant to facilitate the other financial institutions transactions need such as clearing, RTGS, billing payment, etc.
Closeness centrality, reflect the average shortest edges to reach nodes interconnectedness is through BCA, BRI, BNI, BMRI, and BTN. We can translate this context as BCA with score 0.84 and BRI at 0.81 collapse is catastrophic or vital compared to other banks failure in terms to start trigger Indonesia systemic crises.
Eigenvector centrality translated as not only number of edges but also how many that really counts or matters. The key player in Indonesia banking system is BCA with 0.08 followed by BRI and BNI with 0.07. Next important bank is BMRI with score of 0.06. The score indicates how connected them to the banking system wide.
Betweenness centrality depict the shortest path of information in the banking system network. In terms of this study, it articulates the speed of systemic risk effects to disperse (Kuzubaş et al., Citation2014). Using this measure the three top banks are BNLI with 0.13, BTN at 0.1, and BCA that score 0.09.
Katz centrality measure not only the path distance but also consider the first-degree nodes connected to the systemic risk source. Moreover, this centrality also measures the second-degree nodes connected to the first-degree. Our empirical results show that BCA, BRI, BNI, BMRI are the key player in Indonesia banking network as their influence go deep to the second layer of banks connecting to them.
Clustering coefficient resembles the tendencies of nodes in the system wide to congregate together. Using Matlab analysis, we find that BMRI and BNI have closer interconnectedness for banks under KBMI 4 with score 0.33 and 0.31. The cluster followed by the BRI and BCA with 0.26 and 0.19. This measure statistically classifies banks based on other centrality measures and highlight the banks stand out in the systemic risk mitigation.
Although number of banks variation appears in the list, they are all Indonesia big banks under KBMI 4 and KBMI 3 groups. The results pinpoint the importance of network method in the systemic risk study applies publicly available data.
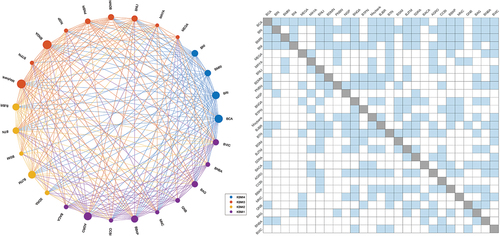
Further analysis using the network matrix in Figure , BCA interconnectedness dominance in Indonesia banking network is profound with only five banks have no connection. Further, altogether with BRI, BMRI and BNI also empirically proven as the core bank in Indonesia banking system. This results in line with the Granger centrality measures as discussed above and give hints for banks analysis by policy maker to build on publicly available data or in our case stock market data and their returns correlation. Still based on the same network matrix the periphery banks in the system are BVIC, BNBA, CCBI, SDRA, and BSIM. All of them are classified as KBMI 2 or small banks. The outcome reinforces the PCA results and interesting to explore in the future research.
Figure 4. Network matrix and interconnectedness. Show a bank importance and connection to other banks in the system wide.
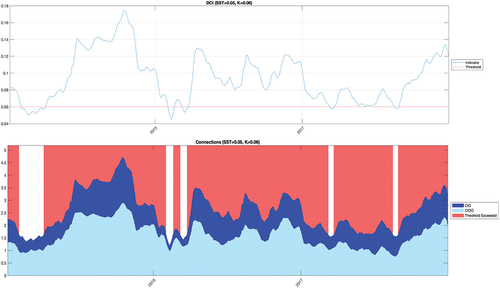
As Billio et al. (Citation2012) the risk direction within systemic event is predicted using Connection In+Out (CIO). It refers as the number of other banks significantly Granger caused by, and Granger cause other neighbor banks. On the other hand, Connection In+Out—Other (CIOO) is the sum of the two. Figure displays most of the CIO connection is coming within banks KBMI peer. In the practical application this convey information how big banks in Indonesia mostly do transactions between them. Exposures among dominant banks could increase the systemic shocks severity if they fail at the same time. The highest Granger caused by is in the end of 2014 approximated index at 4.6. The trend going upward in the end of 2019 susceptible of COVID-19 cases start to emerge in some countries (Rizwan et al., Citation2020).
Figure 5. Connection indicator. The graph produced using Matlab software where reflects the connection coming from banks peer.
Further, if we check using Diebold and Yılmaz (Citation2014) for different perspective of spillover risk between banks in the system-wide then BMRI and BRI are the two most connected banks in Indonesia (see Table ). Though BCA is not in the top of the list however it still in the top five most connected banks in the system (see APPENDIX—ROBUSTNESS TEST 1).
Table 7. Spillover 5 Banks. It shows the magnitude and risk direction over time
Other alternative way to investigate the interbank transaction is to use detail balance sheet data as collected by the regulatory bodies. Gai and Kapadia (Citation2010) proposed a model that will suit bank supervisor to map bank network linkage exposition using detail bank granular data.
4.4. Basel indicator based
Basel methodology is simple to calculate as per prudential data is gather and submitted by the banks. Despite its simplicity Basel claims is more robust than the approaches that rely on market variables (BCBS, Citation2018). Consider the secrecy of bank detail balance sheet data we code the banks ID to specific number but keep it traceable for our analysis purposes. This section focus on interconnectedness category of Basel indicator based methodology adjusted to country need (OJK, Citation2018). Basel indicator-based under all categories stress more on the proportion bank i size to the total banking system in the analysis (see APPENDIX—ROBUSTNESS TEST 2). Interconnectedness category under Basel method provide no information on how the overlapping exposure disperse and trigger the systemic risk.
Our calculation streamlined to focus on 2016–2018 period and sorted according to their importance score of interconnectedness. We know that the interconnectedness is the average of interbank assets, interbank liabilities, and securities outstanding.
Table results confer information that what is considered as “central bank” per market data estimation is not that dominant if compared to Basel outcome. Though BCA superiority is not fully portrayed in the Basel size intense calculation still the bank appeared in the top five of Indonesia systemically important banks (SIBs). Moreover, BMRI, BRI, BNI, and BTN also appear interchangeably during the estimation window. This end results give indication that capital market data could also resemble Basel interconnectedness if not the overall SIBs ranking in Indonesia context. Our findings consistent to Salim and Daly (Citation2021) in their recent paper to model the SIBs using market data vis-à-vis the Basel prudential guideline.
Table 8. Basel indicator-based (Top ten banks). Results are sorted by the interconnectedness score
5. Conclusion and policies implication
This paper investigates how publicly available capital market data and asset returns could be used to analyze the interconnectedness within financial system. Our datasets reflect on Indonesia banking over period 2012–2019 employ Billio et al. (Citation2012) Principal Component Analysis and Granger causality. The analysis process also uses the Basel indicator-based guideline to compare the interconnectedness scores. The findings show that returns co-movements exist in Indonesia banking system which indicate the interconnectedness. Eigenvalue plotting of PCA method exhibits how first three principal components could seize the significant portion of the variance. The outcome envisages the increase of risk commonality and interconnection in financial system. Further, the finding confirms the main benefactor contributor to the principal dominated by banks under KBMI 4 and KBMI 3.
Other measure employed in the paper, Granger causality, iterate the importance of intercorrelated exposure to SIBs identification and trace how risk might spread in the system wide. The degree Granger, closeness, and eigenvector centrality shows BCA, BRI, BNI, BMRI and BTN as the core bank in Indonesia banking network where their collapse would be catastrophic. Using the same centrality measures the results also reveal most of KBMI 2 banks are in the network periphery. Moreover, the outcome raises issue of substitutability because of big size banks dominant factor.
As our research objective we also compare the model results with the Basel interconnectedness score that use prudential balance sheet data. The supreme of KBMI 4 and KBMI 3 banks also inline vis-à-vis the Basel indicator-based that use prudential data as employed by policy maker (OJK, Citation2018). Our findings are consistent to recent Salim and Daly (Citation2021) study of modelling the SIBs. This manuscript contributes to existing studies to gauge the systemic banks based on robust statistical methods using market data and compare it to the Basel interconnectedness results derived from prudential bank granular. Moreover, it is also a pioneer study in the Indonesia banking context to estimate systemic risk utilize network model approach.
However, our study results limited to specific country that could be impacted by the country adjustment made to the Basel indicator-based method. Suggestion for future research by extend the estimation period to cover 2007–2008 global financial crises and post 2019 to see the impact of COVID-19 on systemic risk. It is also appealing to explore more on balance sheet details or mapping wavelet techniques (Asafo-Adjei et al., Citation2021; Boateng et al., Citation2022) or multi VaR model (Owusu Junior et al., Citation2022) to see interconnection using multi countries datasets. Finally, the findings suggest bank supervisor could monitor risk escalation and risk mapping using capital market and asset returns data. The outcome will be beneficial also for policy maker to monitor interconnectedness among core banking network that could trigger systemic risk.
Acknowledgments
This paper presents the authors’ views and will not be thought of as those of Indonesia’s Financial Services Authority. We would like to thank Kevin Daly and Linda Wu (Western Sydney University), two anonymous reviewers during the writing process of this paper. This paper also gain benefit coming from discussant/participants of The 15th BMEB conference and Magnum editing for their valuable proofread and editing services.
Disclosure statement
No potential conflict of interest was reported by the author(s).
References
- Acharya,V. (2009). A theory of systemic risk and design of prudential bank regulation. Journal of Financial Stability, 5(3), 224–32. https://doi.org/10.1016/j.jfs.2009.02.001
- Acharya, V., Engle, R., & Richardson, M. (2012). Capital Shortfall: A new approach to ranking and regulating systemic risks. The American Economic Review, 102(3), 59–64. https://doi.org/10.1257/aer.102.3.59
- Acharya, V., Pedersen, L. H., Philippon, T., & Richardson, M. (2017). Measuring systemic risk. The Review of Financial Studies, 30(1), 2–47. https://doi.org/10.1093/rfs/://WOS:000397233800002>hhw088<
- Adrian, T., & Brunnermeier, M. K. (2016). CoVaR. The American Economic Review, 106(7), 1705–1741. https://doi.org/10.1257/aer.20120555
- Akhter, S., & Daly, K. (2017). Contagion risk for Australian banks from global systemically important banks: Evidence from extreme events. Economic Modelling, 63, 191–205. https://doi.org/10.1016/j.econmod.2016.11.018
- Allen, F., & Gale, D. (2000). Financial contagion. Journal of Political Economy, 108(1), 1–33. https://doi.org/10.1086/262109
- Asafo-Adjei, E., Adam, A. M., Arthur, C. L., Seidu, B. A., & Gyasi, R. M. (2022). Similarities among equities returns in multi-frequencies: Insights from sustainable responsible investing. Journal of Sustainable Finance & Investment, 1–23. https://doi.org/10.1080/20430795.2022.2112141
- Asafo-Adjei, E., Agyei, S. K., Adam, A. M., Bossman, A., & Gherghina, Ş. C. (2022). On the nexus between constituents and global energy commodities: An asymmetric analysis. Applied Economics Letters, 1–9. https://doi.org/10.1080/13504851.2022.2140753
- Asafo-Adjei, E., Boateng, E., Isshaq, Z., Idun, A. A., Owusu Junior, P., & Adam, A. M. (2021). Financial sector and economic growth amid external uncertainty shocks: Insights into emerging economies. PLoS One, 16(11), e0259303. https://doi.org/10.1371/journal.pone.0259303
- Baek, S., Cursio, J. D., & Cha, S. Y. (2015). Nonparametric factor analytic risk measurement in common stocks in financial firms: Evidence from korean firms. Asia-Pacific Journal of Financial Studies, 44(4), 497–536. https://doi.org/10.1111/ajfs.12098
- Balboa, M., López-Espinosa, G., & Rubia, A. (2015). Granger causality and systemic risk. Finance Research Letters, 15, 49–58. https://doi.org/10.1016/j.frl.2015.08.003
- BCBS. (2011). Global systemically important banks: Assessment methodology and the additional loss absorbency requirement. Bank for International Settlements. April 29, 2018
- BCBS. (2012). A framework for dealing with domestic systemically important banks. Bank for International Settlements. April 29, 2018
- BCBS. (2014). The G-SIB assessment methodology - score calculation. Bank for International Settlements. May 20, 2018
- BCBS. (2018). Global systemically important banks: Revised assessment methodology and the higher loss absorbency requirement. Bank for International Settlements. October 12, 2018
- Belluzo, T. 2020, Systemic Risk. 3.0.0 edn, Gitviewed June 2019, <https://github.com/TommasoBelluzzo/SystemicRisk>.
- Bengtsson, E., Holmberg, U., & Jonsson, K. (2013). Identifying systemically important banks in Sweden - what do quantitative indicators tell us? Sveriges Riksbank Economic Review, 2. 29 April 2019. veriges Riksbank, Stockholm Sweden: <http://archive.riksbank.se/Documents/Rapporter/POV/2013/2013_2/rap_pov_artikel_3_130918_eng.pdf>
- Billio, M., Getmansky, M., Lo, A. W., & Pelizzon, L. (2012). Econometric measures of connectedness and systemic risk in the finance and insurance sectors. Journal of Financial Economics, 104(3), 535–559. https://doi.org/10.1016/j.jfineco.2011.12.010
- Bisias, D., Flood, M., Lo, A. W., & Valavanis, S. (2012). A survey of systemic risk analytics. Annual Review of Financial Economics, 4(1), 255–296. https://doi.org/10.1146/annurev-financial-110311-101754
- Boateng, E., Asafo-Adjei, E., Addison, A., Quaicoe, S., Yusuf, M. A., Abeka, M. J., & Adam, A. M. (2022). Interconnectedness among commodities, the real sector of Ghana and external shocks. Resources Policy, 75, 102511. https://doi.org/10.1016/j.resourpol.2021.102511
- Boyd, J. H., Kwak, S., & Smith, B. (2005). The real output losses associated with modern banking crises. Journal of Money, Credit, and Banking, 37(6), 977–999. https://doi.org/10.1353/mcb.2006.0002
- Brownlees, C., & Engle, R. F. (2017). SRISK: A conditional capital shortfall measure of systemic risk. The Review of Financial Studies, 30(1), 48–79. https://doi.org/10.1093/rfs/hhw060
- Chan Lau, J. A. 2010, Balance sheet network analysis of too-connected-to-fail risk in global and domestic banking systems. Working Paper WP/10/107, International Monetary Fund, DC United States, September 9, 2019, https://papers.ssrn.com/sol3/papers.cfm?abstract_id=1566442
- Cont, R., Moussa, A., & Santos, E. B. (2013). Network structure and systemic risk in banking systems. In J.-P. Fouque & J. Langsam (Eds.), Handbook on systemic risk (pp. 327–368). Cambridge University Press. https://doi.org/10.1017/CBO9781139151184.018
- Daly, K., Batten, J. A., Mishra, A. V., & Choudhury, T. (2019). Contagion risk in global banking sector. Journal of International Financial Markets, Institutions and Money, 63, 101136. https://doi.org/10.1016/j.intfin.2019.101136
- Das, S. R. (2016). Matrix metrics: Network-based systemic risk scoring. Journal of Alternative Investments, 18(4), 33–51. https://doi.org/10.3905/jai.2016.18.4.033
- De Bandt, O., & Hartmann, P. 2000, Systemic risk: A survey. Working Paper No. 35, European Central Bank, August 8, 2018, https://www.ecb.europa.eu/pub/pdf/scpwps/ecbwp035.pdf
- Dias, A. (2014). Semiparametric estimation of multi-asset portfolio tail risk. Journal of Banking and Finance, 49, 398–408. https://doi.org/10.1016/j.jbankfin.2014.05.033
- Diebold, F. X., & Yılmaz, K. (2014). On the network topology of variance decompositions: Measuring the connectedness of financial firms. Journal of Econometrics, 182(1), 119–134. https://doi.org/10.1016/j.jeconom.2014.04.012
- ECB. 2009a, Financial stability review. European Central Bank: Frankfurt Germany, pp. 134–142, <https://www.ecb.europa.eu/pub/fsr/shared/pdf/ivbfinancialstabilityreview200912en.pdf?a3fef6891f874a3bd40cd00aef38c64f>.
- ECB. 2009b, Recent advances in modelling systemic risk using network analysis. Recent Advances in Modelling Systemic Risk Using Network Analysis, European Central Bank, viewed March 27, 2018, <https://www.ecb.europa.eu/pub/pdf/other/modellingsystemicrisk012010en.pdf?047d3a5f47aaf23c25ea0681cc2d7b81>.
- Eisenberg, L., & Noe, T. H. (2001). Systemic risk in financial systems. Management Science, 47(2), 236–249. https://doi.org/10.1287/mnsc.47.2.236.9835
- Elsinger, H., Lehar, A., & Summer, M. (2006a). Risk assessment for banking systems. Management Science, 52(9), 1301–1314. <http://www.jstor.org.ezproxy.uws.edu.au/stable/20110606>
- Elsinger, H., Lehar, A., & Summer, M. (2006b). Using market information for banking system risk assessment. International Journal of Central Banking, 2(1). <https://EconPapers.repec.org/RePEc:ijc:ijcjou:y:2006:q:1:a:4>
- Fang, L., Xiao, B., Yu, H., & You, Q. (2018). A stable systemic risk ranking in China’s banking sector: Based on principal component analysis. Physica A Statistical Mechanics & Its Applications, 492, 1997–2009. https://doi.org/10.1016/j.physa.2017.11.115
- FSB, IMF & BIS. (2009). Guidance to Assess the systemic importance of financial institutions, markets and instruments: Initial considerations, report to the G-20 finance ministers and central bank governors, international monetary fund, bank for international settlements, and financial stability board. <https://www.imf.org/external/np/g20/pdf/100109.pdf>.
- Gai, P., Haldane, A., & Kapadia, S. (2011). Complexity, concentration and contagion. Journal of Monetary Economics, 58(5), 453–470. https://doi.org/10.1016/j.jmoneco.2011.05.005
- Gai, P., & Kapadia, S. (2010). Contagion in financial networks. Proceedings of the Royal Society A: Mathematical, Physical and Engineering Sciences, 466(2120), 2401–2423. https://doi.org/10.1098/rspa.2009.0410
- Hati, S. R. H., Prasetyo, M. B., & Hendranastiti, N. D. (2022). Sharia vs non-sharia compliant: Which gives much higher financial-based brand equity to the companies listed in the Indonesian stock market? Journal of Islamic Marketing. https://doi.org/10.1108/jima-08-2021-0251
- Hong, Y., Liu, Y., & Wang, S. (2009). Granger causality in risk and detection of extreme risk spillover between financial markets. Journal of Econometrics, 150(2), 271–287. https://doi.org/10.1016/j.jeconom.2008.12.013
- Idun, A.-A., Asafo-Adjei, E., Adam, A. M., & Isshaq, Z. (2022). Dynamic connectedness between indicators of the ghana stock exchange returns and macroeconomic fundamentals. Risks, 10(11). https://doi.org/10.3390/risks10110215
- Indonesia, B. 2014, PBI No.16/11/PBI/2014 tentang Pengaturan dan Pengawasan Makroprudensial. July 18, 2019, <https://www.bi.go.id/id/publikasi/peraturan/Pages/PBI_161114.aspx>.
- Jobst, A. A. (2014). Measuring systemic risk-adjusted liquidity (SRL)—A model approach. Journal of Banking and Finance, 45, 270–287. https://doi.org/10.1016/j.jbankfin.2014.04.013
- Jobst, A., & Gray, D. 2013, Systemic contingent claims analysis – estimating market-implied systemic risk. Working Paper WP/13/54, International Monetary Fund, DC United States, December 4, 2018, https://papers.ssrn.com/sol3/papers.cfm?abstract_id=2233756
- Jolliffe, I. T., & Cadima, J. (2016). Principal component analysis: A review and recent developments. Philosophical Transactions Series A Mathematical Physical and Engineering Sciences, 374(2065), 20150202. https://doi.org/10.1098/rsta.2015.0202
- Koesrindartoto, D. P., & Aini, M. (2020). The determinants of systemic risk: Evidence from Indonesian commercial banks. Buletin Ekonomi Moneter dan Perbankan, 23(1), 101–120. https://doi.org/10.21098/bemp.v23i1.1084
- Krause, A., & Giansante, S. (2012). Interbank lending and the spread of bank failures: A network model of systemic risk. Journal of Economic Behavior and Organization, 83(3), 583–608. https://doi.org/10.1016/j.jebo.2012.05.015
- Kuzubaş, T. U., Ömercikoğlu, I., & Saltoğlu, B. (2014). Network centrality measures and systemic risk: An application to the Turkish financial crisis. Physica A Statistical Mechanics & Its Applications, 405, 203–215. https://doi.org/10.1016/j.physa.2014.03.006
- Mazzarisi, P., Zaoli, S., Campajola, C., & Lillo, F. (2020). Tail Granger causalities and where to find them: Extreme risk spillovers vs spurious linkages. Journal of Economic Dynamics and Control, 121. https://doi.org/10.1016/j.jedc.2020.104022
- Muhajir, M. H., Arief, U., Prasetyo, M. B., Wibowo, S. S., & Husodo, Z. A. (2020). Estimating a joint probability of default index for Indonesian Banks: A copula approach. Buletin Ekonomi Moneter dan Perbankan, 23(3), 389–412. https://doi.org/10.21098/bemp.v23i3.1358
- Nguyen, D. T., Phan, D. H. B., Anglingkusumo, R., & Sasongko, A. (2021). US government shutdowns and Indonesian stock market. Pacific-Basin Finance Journal, 67. https://doi.org/10.1016/j.pacfin.2021.101521
- OJK. 2015, Determination of systemically important banks and capital surcharges. POJK No. 46/POJK.03/2015, Jakarta Indonesia, April 1, 2018, <https://www.ojk.go.id/id/kanal/perbankan/regulasi/peraturan-ojk/Pages/POJK-46-PENETAPAN-SIB-CAPITAL-SURCHARGE.aspx>.
- OJK. 2018, Systemically important banks and capital surcharges. POJK No. 2/POJK.03/2018, Jakarta Indonesia, April 15, 2018, <https://www.ojk.go.id/id/regulasi/Documents/Pages/Penetapan-Bank-Sistemik-dan-Capital-Surcharge/POJK%202-2018.pdf>.
- OJK. (2021). Commercial banks. POJK No. 12/POJK.03/2021, Jakarta Indonesia, <https://www.ojk.go.id/id/regulasi/Documents/Pages/Bank-Umum/POJK%2012%20-%2003%20-2021.pdf>
- Owusu Junior, P., Tiwari, A. K., Tweneboah, G., & Asafo-Adjei, E. (2022). GAS and GARCH based value-at-risk modeling of precious metals. Resources Policy, 75. https://doi.org/10.1016/j.resourpol.2021.102456
- Ponziani, R. M. (2022). Modeling the returns volatility of Indonesian stock indices: The case of SRI-KEHATI and LQ45. Jurnal Ekonomi Modernisasi, 18(1), 13–21. https://doi.org/10.21067/jem.v18i1.6411
- Raz, A. F. (2018). Risk and capital in Indonesia Large Bank. Journal of Financial Economic Policy, 10(1), 165–184. viewed 10 March 2020. https://doi.org/10.1108/JFEP-06-2017-0055.
- Rizwan, M. S., Ahmad, G., & Ashraf, D. (2020). Systemic risk: The impact of COVID-19. Finance Research Letters, 36, 101682. https://doi.org/10.1016/j.frl.2020.101682
- Rocco, M. (2014). Extreme value theory in finance: A Survey. Journal of Economic Surveys, 28(1), 82–108. https://doi.org/10.1111/j.1467-6419.2012.00744.x
- Roengpitya, R., & Rungcharoenkitkul, P. 2011, Measuring systemic risk and financial linkages in the thai banking system, federal reserve bank of St. Louis, St. Louis United States, June 2, 2020, https://papers.ssrn.com/sol3/papers.cfm?abstract_id=1773208
- Wibowo, B. (2017). Systemic risk, bank’s capital buffer, and leverage. Economic Journal of Emerging Markets, 9(2), 150–158. https://doi.org/10.20885/ejem.vol9.iss2.art4
- Zheng, Q., & Song, L. (2018). Dynamic contagion of systemic risks on global main equity markets based on granger causality networks. Discrete Dynamics in Nature & Society, 2018, 1–13. https://doi.org/10.1155/2018/9461870
Appendix
1. Classical Test
Lag-order selection criteriaSample: 01 jan 2012 thru 31 dec 2019Number of obs = 1,856
Endogenous: BCA BRI BMRI BNI MEGA MAYA BNLI BDMN PNBN NISP BNGA BTPN Maybank BJBR BTN BSIM BJTM SDRA BACA AGRO CCBI BBKP MNC QNB BAG BNBA BVIC
Exogenous: _cons
Dickey–Fuller test for unit rootH0: Random walk without drift, d = 0
2. Variance Decomposition
Diebold and Yılmaz (2014) define pairwise direction connectedness from j to i where
. Net pairwise
analogous to bilateral interbank balances. Off-diagonal row labeled ‘from’ and column as ‘to’ in the connectedness table.
Table
define total directional connectedness from others to i as j
and the opposite of total directional connectedness to others from j as i
The grand total off-diagonal entries equivalent of the sum ‘from’ and ‘to’ measures total connect-edness
3. Basel Indicator-Based
Illustration - Interconnectedness (Securities outstanding)
Bank A securities outstanding score is the result for each component compared to whole banking system in the country:
Secured debt (2,000) + Senior unsecured (4,000) + Subordinated (1,000) + Equity market cap (2,500)/Total in banking wide (127,500) = 745Domestic Indicators
Systemic Score
Bank A final systemic score is derived from:
Size (1,732 × 33.3%) + Interconnectedness (937 × 33.3%) + Complexity (705 × 33.3%) = 1,125
