
 ?Mathematical formulae have been encoded as MathML and are displayed in this HTML version using MathJax in order to improve their display. Uncheck the box to turn MathJax off. This feature requires Javascript. Click on a formula to zoom.
Abstract
Rules-based portfolio sorts are commonplace for the evaluation of style anomalies. An unfortunate consequence of constructing portfolios on a target style is the unintended loading on non-target factors. A plausible approach is the application of optimisation to maintain target factor loading while minimising non-target factor exposures. We test this methodology on an emerging market bourse, the Johannesburg Stock Exchange, via quintile portfolios sorted on momentum, value and size. We find that value and momentum benefit most from optimisation in terms of nominal and risk-adjusted performance. From an emerging market perspective, we show that optimisation is a viable alternative when independent sorts are infeasible.
Keywords:
1. Introduction
Rules-based style investing,Footnote1 analysis and attribution typically require the creation of portfolios that can isolate target long-only style and zero-cost, long-short factor (premium) performance. Liu (Citation2017) considers the implication of unintended exposure to non-target factors when sorting portfolios on a target style. This paper empirically investigates the methods put forth in Liu (Citation2017) to isolate target styles using equity data from the Johannesburg Stock Exchange (“JSE” hereafter) over the period 1 January 2000 to 31 October 2021. A central benefit of Liu’s (Citation2017) proposed method is the ability to retain target style exposure while neutralising non-target factor loadings within a long-only portfolio framework. The JSE serves as a proxy for emerging market bourses given its relatively limited investable universe due to both liquidity constraints and a lower number of available share constituents. The proposed method therefore offers a plausible alternative to both independent sorts and regression-based long-short factor premium estimation when conducting asset pricing research or developing style-based investment products for emerging market exchanges.
The basis of quantile sorts is well documented in both international and local literature for factor identification and evaluation and is commonly applied to the creation and management of long-only style-based investment products. “Quantile sorts” implies sorting shares into divisible portfolios based on style, or more specifically, a style proxy, such as book-to-market ratio or earnings yield for value, market capitalisation for size, and historical cumulative return for both momentum and reversal. An unfortunate consequence of quantile sorts is that target-style portfolios unintentionally load on non-target factors. Examples of this are value portfolios loading negatively on the momentum premium, while the opposite is true for growth (see Asness, Citation1997; Page & Auret, Citation2019). A potential outcome is that results and conclusions based on quantile sorts may be driven by the non-target factor loading instead of the style being tested. This is exacerbated when sorting on multiple styles simultaneously since there is a higher probability of a target style portfolio sharing several constituents with high non-target-style exposures. Independent sorts are a practical means of dealing with unintended exposures; however, when evaluating more than two styles, the number of required portfolios increases by pn where p is the number of portfolios and n is the number of styles.Footnote2
Several studies have offered alternative methods for the estimation of “pure” factor premiums through the application of multivariate regressions (see Back et al., Citation2013; Jacobs & Levy, Citation1988). A drawback of the above method is the limited focus on the long-short factor premium without any view of independent long-only portfolios that represent varying degrees of exposure to the style (proxy) in question. Liu (Citation2017) offers an alternative for estimating “pure” quantile portfolios, relying on quadratic optimisation to wash out unintended factor loadings. The heart of the method lies in optimising constituent weights to minimise non-target-style exposure while maintaining target exposure on a portfolio level. This study applies Liu’s (Citation2017) methodology to value, size and momentum on the cross-section of liquid shares listed on the JSE over the period 1 January 2000 to 31 October 2021. For each style, both “naive” equally weighted and “pure” optimised quintile portfolios are estimated quarterly. Quintile portfolios are evaluated based on nominal and risk-adjusted return, factor loading and cross-correlations. The results show that optimisation improves unintended factor exposure for both momentum and value-sorted quintile portfolios, and like Liu (Citation2017), demonstrate that pure quintile sorts improve momentum and value performance. Contrary to Liu (Citation2017), we find that only “pure” momentum and value benefit from optimisation on a risk-adjusted basis. Finally, consistent with the local literature (see Muller & Ward, Citation2013; Page et al., Citation2016), we find no size effect on the JSE using either naive or pure quintiles but note a significant mid-cap premium that improves when applying optimisation.
The rest of the paper is structured as follows. Section 2 provides a brief description of the literature; Section 3 details the research design, data, and methodology; Section 4 provides the results, and Section 5 concludes.
2. Literature review
In terms of the broader body of rule-based portfolio management, a number of studies have considered alternative methods for the creation and implementation of style-based portfolios across developed and developing markets assuming regime-switching (see Engel et al., Citation2018; Ye et al., Citation2016) as well as the application of Black-Litterman optimisation (see Dewandaru et al., Citation2015; la Torre-Torres et al., Citation2022). Focusing on the literature that specifically addresses style or factor purity, Jacobs and Levy (Citation1988) considered the benefit of multivariate regression analysis in providing independent representations of stylised premiums. The study evaluated the largest 1,500 US companies per the CRSP database from January 1978 to December 1986. A multivariate cross-sectional regression was conducted each month, applying individual share excess returns against a matrix of 25 standardised-style proxies (z-scores). The outcome of each regression was a vector of slope factor loadings, representing the excess (return) factor premiums for each style. Monthly factor loadings were then ordered as a time series and represented the “pure” factor premium associated with each style over the sample period. The authors found that in most cases, “pure” factor premia achieved lower nominal returns but had higher levels of statistical significance.
Applying a similar methodology, Back et al. (Citation2013) used Fama-Macbeth style regressions to estimate “pure play” factor premiums associated with 13 anomalies. The purpose of the study was to explicitly test whether time-series alphas were driven by a target style or non-target-style premiums (a by-product of using naive factors). To estimate “pure play” portfolios, Carhart (Citation1997) standardised-style proxies were applied as independent variables within a multivariate regression, which spanned the cross-section of excess share returns on the CRSP database from January 1926 to December 2012. Like Jacobs and Levy (Citation1988), excess share returns were regressed monthly against lagged value, size, and momentum z-scores, and the estimated slope coefficients were used as “pure play” time-series factor premiums. The results showed that the “pure play” portfolios produced significantly positive alphas when naïve value, size, and momentum factor premiums were applied in spanning (time-series regression) tests. More importantly, when “pure play” factor premiums were applied as explanatory variables, 5 of the 13 anomalies produced insignificant alphas, implying that the application of naïve factor premiums may result in Type I errors (incorrectly rejecting the null) when identifying style independence and alpha. Importantly, the multivariate regression methods of Jacobs and Levy (Citation1988) and Back et al. (Citation2013) are a viable alternative for the determination of pure factor premia, however; first, are incomparable with the plethora of quantile-based evidence found in local and international literature, and second, fail to provide insight into long-only-style performance across quantiles.
Liu (Citation2017) significantly contributed to the existing literature by providing an alternative method for achieving style and factor purity using optimisation. Instead of estimating “pure” or “pure play” factor premiums using multivariate regression, optimization is applied on a (quantile) portfolio level.Footnote3 The objective of the optimisation is to solve constituent weights to maintain target factor exposure while reducing non-target factor exposure. The study evaluated the cross-section of shares on the Russell 1000 Index from January 1979 to December 2014 and focused on value, size, momentum, profitability, and earnings quality. Naive portfolios were sorted monthly by applying quintile breakpoints based on each style proxy. Additionally, both target and non-target factor exposures were measured for each quintile portfolio, assuming equal weighting. The optimisation procedure was then run for each quintile portfolio to solve weights that maintain the target style exposure, zero non-target-style exposure, and preserve the original number of shares. The results showed that across the styles considered, pure quintile portfolio returns had lower levels of volatility and generated higher factor premiums, barring earnings quality. The study also evaluated non-US developed and emerging market data and found similar results but with lower nominal and risk-adjusted returns.
To the best of the authors’ knowledge, no comparable study has been conducted on the cross-section of JSE listed shares; despite the relatively large body of style-based literature specific to the JSE, most of which has focused on factor premiums (see Basiewicz & Auret, Citation2010; Hodnett et al., Citation2012; Hoffman, Citation2012; and more recently Muller & Ward, Citation2013; Page & Auret, Citation2019). The most comparable South African studies to the work of Jacobs and Levy (Citation1988) and Back et al. (Citation2013) are the likes of Hoffman (Citation2012) and Page and Auret (Citation2019; Van Rensburg, Citation2001), as both applied cross-sectional regressions to determine factor premiums. Hoffman (Citation2012) considered the cross-section of shares listed on the JSE from April 1985 to December 2010 and conducted cross-sectional regressions on three size strata independently. The study found that size, value, and momentum produced significant positive factor premiums on the JSE. Page and Auret (Citation2019) conducted a similar analysis that considered a liquid universe of JSE-listed shares from January 1997 to June 2016. The study found that value, size, and momentum were predictors of expected returns and produced significant factor premiums while also providing clear evidence of the low beta anomaly (BAB) per Frazzini and Pedersen (Citation2014).
Notably, both studies focused on style predicting future share performance and the identification of time-invariant factor premiums on the JSE. This study differs in purpose and is therefore unique to the current body of the literature. Although it builds on the methodology proposed by Liu (Citation2017), the outcomes carry additional insight for academics and practitioners alike, specific to the research and implementation of style-based strategies on emerging market bourses, which are notorious for smaller investable universes and lower liquidity levels. At the time of writing, the JSE Top 40 (FTSE-J200) index (top 40 companies by market capitalisation) accounts for close to 88% of the total market capitalization on the JSE, which currently has approximately 350 counters. By implication, the accurate testing of style anomalies on the JSE becomes impractical when attempting to apply independent-style sorts. A result is that sorting on multiple styles will lead to significant ticker/constituent overlap across portfolios or, if sorted independently, an infeasibly low number of shares per quantile portfolio. If such portfolios are applied to evaluate strategies or managers, test new styles within an asset pricing framework, or manage single or multi-factor strategies, there is an increased probability of both Type I & II errors (failing to reject null when false) as long-only styles and long-short factor premia are influenced by non-target factor loadings.
3. Data and methodology
Data are sourced from Bloomberg and includes daily share prices, market capitalisation, volume, and earnings yield. Prices are adjusted for corporate actions such as dividends, share splits, consolidations and unbundlings. Earnings data are lagged a full quarter to mitigate the impact of look-ahead bias. The data spans the period January 2000 to October 2021 and considers the cross-section of JSE listed shares excluding cash shells, special purpose acquisition companies (“SPACs”), exchange-traded funds and investment trusts. A unique ticker code is applied to each qualifying share to minimise the impact of structural breaks in share data to ensure continuity in the event of name changes. Shares are retained within the database if they exit due to delisting or suspension and become ineligible for future portfolio sorts to mitigate the effect of survivorship bias. In contrast to Liu (Citation2017), this study only considers three styles: momentum, value, and size. The delimitation is partly due to the limited South African research on quality—specifically accruals and profitability—as well as the fact that the Carhart (Citation1997) factors emerge as significant explanatory factor premiums on the JSE (see Hoffman, Citation2012; Page & Auret, Citation2019).
The methodology is mainly consistent with Liu (Citation2017); however, there are marginal deviations. Regarding similarities, style proxies are virtually identical. Momentum is proxied by the t-12 month cumulative return, skipping the most recent month to mitigate the impact of short-term reversal and microstructure effects. Size is proxied by the natural logarithm of the most recent market capitalisation. Earnings yield is the preferred value proxy per Page et al. (Citation2021), who find that earnings yield has emerged superior to book-to-market ratio on the JSE. Unlike Liu (Citation2017), we opt for sorting portfolios quarterly instead of monthly. Quarterly rebalancing is likely to produce more credible results as we do not factor return penalties associated with share turnover, and the current FTSE-JSE index rebalance rules stipulate quarterly rebalancing, making quintile portfolio performance comparable with well-established local market proxies. Finally, to ensure an investable universe of underlying shares, we limit our analysis to the top 100 shares based on market capitalization each quarter, as per Muller and Ward (Citation2013).
First, naive portfolios are constructed by ranking shares based on their respective-style proxies from 1 to 100 in descending order for momentum and value, and ascending order for size. Shares are then sorted into one of the five quintile portfolios, assigned an equal weight, and grown daily based on their respective returns over the next quarter, after which the process is repeated. We opt for equal weighting for several reasons. First, Liu (Citation2017) applied equal weighting to define both target and non-target style exposure. Second, equal weighting is probably the most prudent means of determining factor exposure as both market capitalisation and factor weighting introduce bias at the portfolio construction level. As size is one of the styles considered, market capitalisation weighting would negatively bias small size exposure across the styles being tested. Factor weighting implies assigning initial weights based on the respective target-style z-score. If z-scores across styles differ in scale, style exposures will be biased towards styles with extreme z-score ranges.
The return associated with each equally weighted quintile portfolio is deemed the “naïve” long-only return and the quintile one minus quintile five excess return (Q1-Q5) as the naive factor premium. Simultaneously, at each sort, naïve factor exposures are calculated based on the cumulative weighted z-score for each of the styles considered. This entails that for each of the naïve momentum quintile portfolios, we calculate the momentum, value and size exposure using the formula
where N is a 3 × 1vector representing naive factor exposure of a quintile portfolio based on the vector of equal weights w, and Z, a matrix of standardised-style z-scoresFootnote4 applicable to the respective constituent shares. Pure portfolio weights are then calculated using Sequential Least-Squares Programming (“SLSQP”) optimisationFootnote5 (see Boggs & Tolle, Citation2000) by solving weights that minimise the objective function
where O is a 3 × 1 vector with a factor exposure equal to the naive exposure of the target style and zero to the non-target-style exposures. Like Liu (Citation2017), we apply several constraints to the optimisation procedure to ensure that the weights sum to unity, are non-negative, and the portfolios maintain an equal number of shares to their naive counterparts. We depart from the methodology of Liu (Citation2017) by not allowing the optimisation to pick different shares from the available universe at each rebalance to satisfy the objective function, which would typically result in a mixed-integer optimisation (see Benati & Rizzi, Citation2007). Lastly, we reiterate the delimitation of not applying trading cost assumptions within the estimation of naïve or optimised portfolio returns. By construction, the impact of trading costs is minimised through the application of quarterly as opposed to monthly rebalancing as well as limiting our analysis to a liquid universe of shares which typically garner lower trading costs when compared to illiquid counters with large bid-ask spreads.
The section that follows details the results of the optimisation procedure by evaluating the performance and ex post factor loading of “pure” quintile portfolios against their naive equally weighted equivalents.
4. Results
4.1. Portfolio performance
Figure describes the cumulative performance of momentum-sorted quintile portfolios from January 2002 until October 2021. Momentum improves with factor purity as the optimised winner (Q1) plots above its naive equivalent, while the optimised loser (Q5) plots below its naive counterpart. Table reiterates the impact of optimisation, with the optimal winner quintile providing an average monthly premium over the naïve winner of 0.18% and a 15% improvement in its Sharpe ratio. Conversely, the optimised loser quintile underperforms its naïve equivalent by 10 basis points per month on average and reduces its Sharpe ratio by 26% (0.25 versus 0.34). An additional impact of factor purity is that optimised momentum portfolios display a clear monotonic degradation in performance when moving across quintiles, whereas naïve quintile 3 underperforms quintile 4.
Figure 1. Cumulative returns of momentum-sorted naïve and optimised portfolios over the period January 2002 until October 2021.
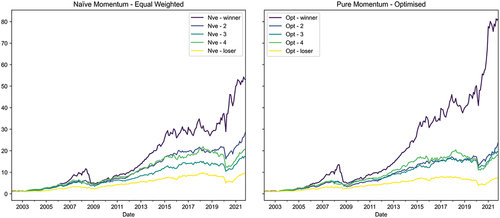
Table 1. Monthly average excess return and Sharpe ratios of naive and optimised momentum-sorted quintile portfolios from January 2002 to October 2021. Momentum is proxied by cumulative returns over the previous 252 trading days, skipping the most recent 21 days, and the risk-free rate proxied by 91-day SA government T-bill. Average returns are expressed monthly in excess of risk-free proxy with “***”, “**” and “*” indicating statistical significance at the 1%, 5% and 10% levels
Figure and Table describe the performance of value-sorted naive and optimised quintile portfolios. Like the momentum sorts, optimised value quintiles display a more distinct value premium. The optimised value quintile (Q1) plots above its naïve equivalent, while the naïve growth portfolio (Q5) plots above its optimised counterpart. Table confirms that the optimised value outperforms the naïve value by 9 basis points per month on average, while naive growth posts a monthly premium of 15 basis points over optimised growth. Once again, factor purity improves risk-adjusted performance as the optimised value produces an annualised Sharpe ratio of 0.60 compared to 0.57 of its naive equivalent (5% improvement). Conversely, optimised growth produces a Sharpe ratio of 0.31, 28% lower than the 0.43 produced by the naive growth quintile. Unlike momentum, the application of optimisation has an opposite impact on the monotonic degradation in value returns. Naïve value performance shows a monotonic decrease when moving across quintiles, yet for the optimised sorts, quintile 4 produces higher nominal and risk-adjusted performance than quintiles 2 and 3.
Figure 2. Cumulative returns of value-sorted naïve and optimised portfolios from January 2002 to October 2021.
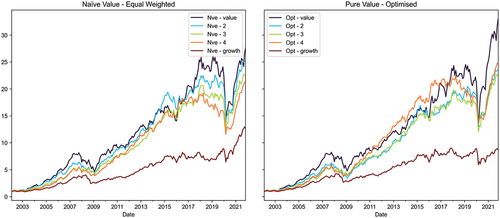
Table 2. Monthly average excess return and Sharpe ratios of naive and optimised value-sorted quintile portfolios from January 2002 to October 2021. Value is proxied by earnings yield adjusted for look-ahead bias by lagging accounting data by 63 days. Average returns expressed monthly in excess of risk-free proxy with “***”, “**” and “*” indicating statistical significance at the 1%, 5% and 10% levels
Figure describes the cumulative performance of naive and optimised quintile portfolios sorted on size. The results show that the size effect on the JSE has mostly dissipated (Auret & Cline, Citation2011; Muller & Ward, Citation2013; Page et al., Citation2016). However, the figure does point to a significant mid-cap premium, as both the naive and optimal quintile Q3 portfolios produce the highest cumulative performance over the sample period. More importantly, when optimising to ensure factor purity, the mid-cap (Q3) performance improves dramatically but has no material impact on the extreme size portfolios. Table shows a modest size premium, as the naïve and optimised small quintile outperforms big, yet, unlike value and momentum, optimisation negatively impacts excess returns and Sharpe ratios. The opposite is true for the mid-cap quintile portfolio, as optimisation translates to an additional return of 14 basis points per month and increases the Sharpe ratio from 0.75 to 0.82.
Figure 3. Cumulative returns of size-sorted naïve and optimised portfolios from January 2002 to October 2021.
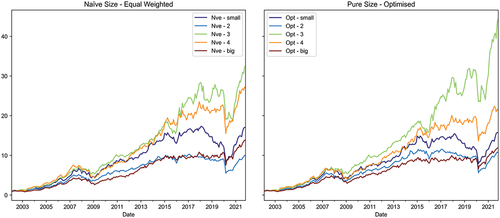
Table 3. Monthly average excess return and Sharpe ratios of naive and optimised size-sorted quintile portfolios from January 2002 to October 2021. Value is proxied by earnings yield adjusted for look-ahead bias by lagging accounting data by 63 days. Average returns expressed monthly in excess of risk-free proxy with “***”, “**” and “*” indicating statistical significance at the 1%, 5% and 10% levels
Figure describes the cumulative performance of naive and optimised momentum, value, and size factor premiums over the sample period. In all instances, the optimised factors outperform the naive; however, the magnitude of outperformance varies considerably. Momentum clearly shows the greatest improvement; value next, while the size premium only slightly improves from January 2020. Similarly, the optimised value premium mainly tracks and underperforms its naïve equivalent over most of the sample period but displays a drastic improvement from 2020. The result is consistent with the global re-emergence of value, post the global COVID-19 drawdowns experienced in March and April 2020. A further possible reason for the improvement in the value premium could be linked to the main objective of this study and the results presented in Table . Optimised sorts (by definition) wash out the unintended effects of non-target styles, and Tables show that the impact is largest for Q5 (growth). Therefore, the result could be largely driven by the short position in the pure growth quintile, which is less affected by momentum and size.
Figure 4. Cumulative performance of momentum, value, and size naïve and optimised factor premiums over the period January 2002 until October 2021.
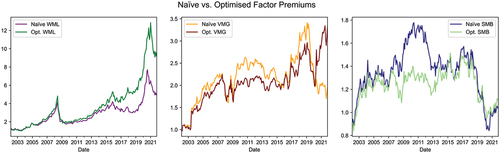
Table provides the monthly average excess returns and Sharpe ratios for both the naïve and optimised factor premiums. Across styles, optimisation improves the economic size and statistical significance (barring size) of the factor premiums. The momentum premium experiences a 35% improvement, increasing from 0.82% to 1.1% per month on average, with the latter being significant at the 1% level. The value premium shows the most improvement, increasing from an insignificant 0.39% to 0.62% (a 60% improvement) per month and becomes significant at the 10% level. The size premium experiences a 35% improvement; however, this is off a low base of 8 basis points per month on average and lacks statistical significance.
Table 4. Average monthly excess returns (factor premiums) and Sharpe ratios across naive and optimised across momentum, value, and style extreme quintiles. “***”, “**” and “*” indicate statistical significance at the 1%, 5% and 10% levels
The results presented show a clear nominal and risk-adjusted return benefit to momentum, value, and to a lesser extent, size. However, notwithstanding the impact on performance, the section that follows attempts to directly test whether optimisation meaningfully reduces non-target-style exposure.
4.2. Style and factor loading
As shown above, the application of optimisation improves the returns for value and momentum on a long-only and zero-cost (Q1-Q5) basis. To assess the impact of optimisation on factor loadings, returns-based-style analysis (RBSA) per Sharpe (Citation1992) and rolling correlations are applied to naive and optimised long-only-style quintiles. For both tests, excess quintile returns over the market proxy (JSE All-Share Total Return Index—J203T) are applied to minimise the impact of overall market movements on results. Sharpe (Citation1992) proposes using linear quadratic optimisation to determine the influence of styles on active manager returns through solving weights (constrained to be between zero and unity) that minimise the objective function
where Y is a vector n x 1 time-series returns, X is a matrix of n × m styles over the same time-period n and γ is an m × 1 vector of weights between zero and unity that minimises the sum of squared errors per Equationequation 3(3)
(3) . Correlation analysis is conducted where rolling window excess return correlations are estimated on target naive and optimised long-only styles. Style weights (coefficients) and correlations are estimated quarterly for both methods, applying 60-month rolling windows.
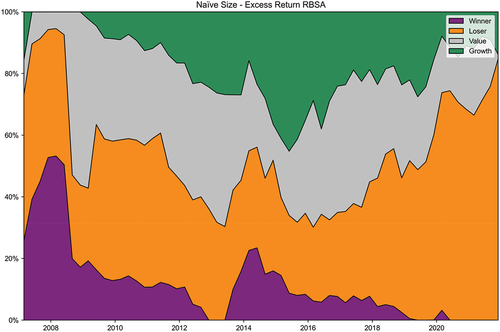
describe the RBSA results for naive and optimised momentum winner quintile portfolio (Q1), applying the extreme naïve and optimised value and size quintile returns. is consistent with the findings of Asness (Citation1997), where a large proportion of the variation in the naïve winner quintile performance is explained by naïve growth, while naïve value barely features. The loadings on the extreme size quintiles are consistent with the performance of the size premium on the JSE, with naïve momentum loading heavily on large caps from 2013. shows that the application of optimisation on momentum, value, and size translates to a more equitable distribution of factor loadings, where value and small caps feature more prominently, and the expected growth loading halves over the period on average.
Figure 5a. Returns-based style analysis per Sharpe (Citation1991) on naive long-only momentum (Q1) using naïve value, growth, and small- and large-cap quintile returns.
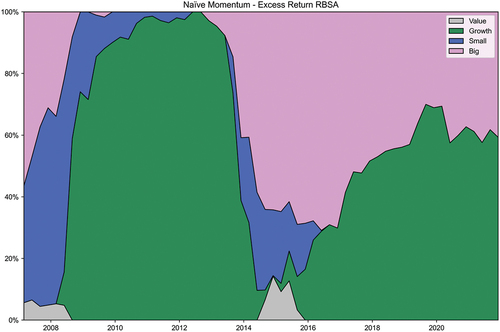
Figure 5b. Returns-based style analysis per Sharpe (Citation1991) on optimised long-only momentum (Q1) using optimised value, growth, and small- and large-cap quintile returns.
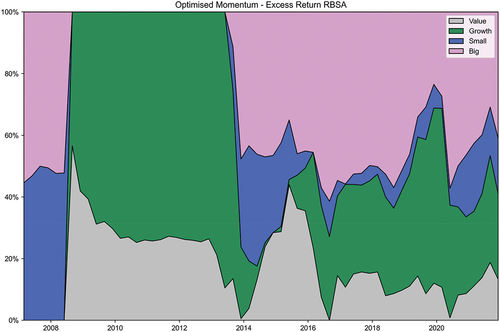
Figure further confirms the impact of optimisation through time-series correlations between momentum (naïve and optimised) and the extreme size and value quintiles. Naive correlations show that growth has the consistently highest correlation with momentum. The impact of optimisation is also displayed where correlations are within a narrower band, implying that extreme exposures to non-target factors are minimised. The impact is especially prominent regarding the decrease in momentum’s correlation to growth and the increase in value and small caps.
Figure 6. Rolling 60-month correlations on naive and optimised momentum.
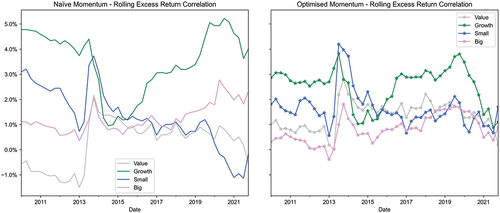
show the RBSA on value applying the extreme momentum and size quintile portfolio returns. indicates that naïve value loads highly on the naïve loser and small-cap quintiles, consistent with Fama and French (Citation1992) and Asness (Citation1997). shows the impact of optimisation and depicts a clear improvement through the increased loading to large caps and a notable decrease in the loading to the loser quintile. Figure confirms the RBSA results as optimisation results in values correlated to the excess small cap and loser returns reducing over the period and (like momentum) showing a more equitable distribution of correlations to non-target factors.
Figure 7a. Returns-based style analysis per Sharpe (Citation1991) on naïve long-only value (Q1) against naive winner, loser, and small- and large-cap quintile returns.
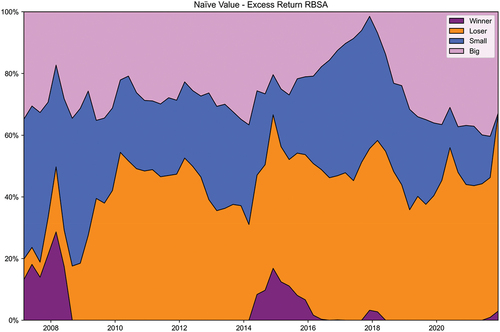
Figure 7b. Returns-based style analysis per Sharpe (Citation1991) on optimised long-only value (Q1) against optimised winner, loser, and small- and large-cap quintile returns.
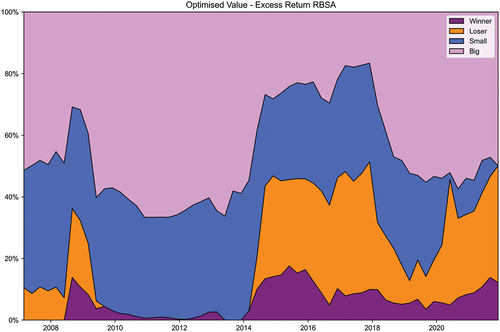
Figure 8. Rolling 60-month correlations on naïve and optimised value.
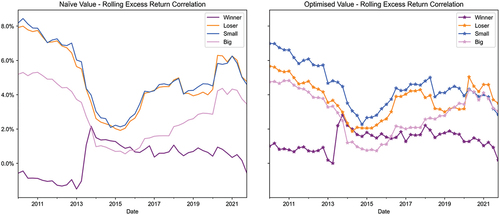
Figure 9b. Returns-based style analysis per Sharpe (Citation1991) on optimised long-only size (Q1) against optimised winner, loser, and small- and large-cap quintile returns.
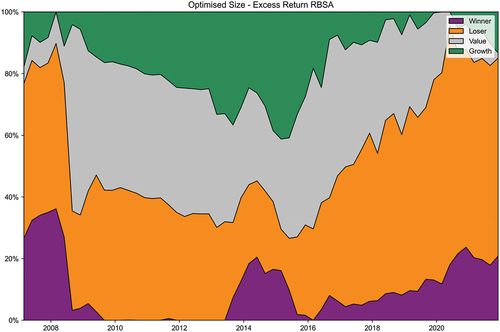
Like the performance analysis presented, the benefit of optimisation is less clear for size when compared to value or momentum. The RBSA output per figures and 9b indicates that the naive small-cap quintile loads mainly on the naïve loser and value quintiles. The impact of optimisation is an increased exposure to momentum; however, the loadings do not seem to vary dramatically across the weighting procedures. The result is confirmed by Figure , where optimised correlations fail to show the same level of confluence as seen with value and momentum.
Figure 10. Rolling 60-month correlations on naïve and optimised small-cap quintiles.
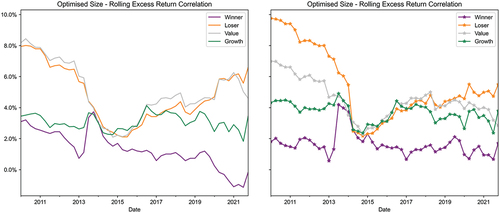
Figure 9a. Returns-based style analysis per Sharpe (Citation1991) on naïve long-only size (Q1) against naive winner, loser, value, and growth quintile returns.
5. Summary and conclusion
Quantile sorting is a globally accepted standard approach for the testing of style performance and the estimation of factor premiums. Similarly, numerous passive factor-based investment products are constructed under a quantile sort approach, providing long-only exposure to numerous global and country-specific styles. A clear benefit of quantile sorts is the ability to evaluate the dynamics of style performance on a long-only basis and then define a hypothetical zero-cost long-short factor premium. In order to retain the benefits of quantile sorts and mitigate the impact of unintended non-target factor loadings, Liu (Citation2017) provides an alternative optimisation-based framework at a portfolio constituent level. If optimisation improves style performance, one can conclude that the target style in question is truly independent and priced, on both a long-only and long-short basis. Second, even if optimisation fails to improve performance, “purer” factor premiums are certainly more viable for the purpose of asset-pricing tests, attribution analysis, style evaluation and investment product development and management. The results clearly exhibit the impact of style contamination and the benefits of quantile purification on an emerging market bourse. From a JSE specific perspective, the evidence presented shows that the bulk of the benefit is experienced by value and momentum. First, both experience increases in average (long-short) factor premiums, with optimisation simultaneously improving quintile Q1 and negatively impacting quintile Q5. Second, RBSA and correlation analysis prove that equal weighting contaminates quintile sorts, resulting in style performance and premiums that are heavily influenced by the performance of non-target styles.
As mentioned, this study is the first of its kind conducted on the JSE and significantly adds to the existing body of knowledge on asset pricing and style-based research. More importantly, the results have broader implications for academics and practitioners alike in terms of style-based research and product development conducted in emerging markets, specifically when applying quantile sorts to evaluate style anomalies, factor premia or test asset pricing models. The findings indicate that even under equal weighting, the probability of style contamination and its negative potential impact on empirical tests (and subsequent theoretical conclusions) is increased, proving especially important when dealing with smaller investable universes and lower levels of liquidity. Notwithstanding the novel findings, the study provides several avenues for future research. First, future studies can be broadened to include several emerging markets to ascertain whether factor purity via optimisation is a plausible alternative to independent sorts for emerging markets on aggregate. Second, the scope of the study can be increased to include more recent and advanced optimisation algorithms such as particle swarm (see Zhu et al., Citation2011) and mixed-integer optimisation. Lastly, there is ample room to evaluate the impact of trading costs and other trade-related frictions and their impact on pure factor portfolio performance.
Disclosure statement
No potential conflict of interest was reported by the author(s).
Notes
1. Rules-based or “style” investing applies rules for the selection and/or weighting of assets within a portfolio based on a single or multiple a priori known metrics and differs to the likes of both active and passive asset management. Passive asset management implies replicating a known benchmark based on constituent and weighting, while active management involves researching a subset of assets and taking “active” bets against a benchmark.
2. Sorting shares on three styles independently using a tercile split (33rd/66th percentile) would require 27 portfolios (33) while quintiles sorts would require 125 portfolios (53). Assuming a requirement of 20 shares per portfolio, this would require a universe of 2 500 shares to ensure no overlap.
3. See Meucci (2005) who considers the implication of optimisation procedures specifically when addressing optimality criteria to evaluate an estimator.
4. Notably, in order to minimise the impact of outliers across the style proxies applied, z-scores are calculated and standardised on a rank basis. This implies that the z-score moments (mean, standard deviation and individual share) are estimated using ranking. The result is that the highest (lowest) value z-score will be numerically identical to the highest (lowest) momentum and size z-score.
5. We opt for SLSQP given its relative speed when optimising dense, well-scaled models as well as accepting non-convex optimisation problems.
References
- Asness, C. (1997). The interaction of value and momentum strategies. Financial Analysts Journal, 53(2), 29–15. https://doi.org/10.2469/faj.v53.n2.2069
- Auret, C., & Cline, R. (2011). Do the value, size and January effects exist on the JSE? Investment Analysts Journal, 2011(74), 29–37. https://doi.org/10.1080/10293523.2011.11082539
- Back, K., Kapadia, N., & Ostdiek, B. (2013). Slopes as factors: Characteristic pure plays. Available at SSRN 2295993.
- Basiewicz, P., & Auret, C. (2010). Feasibility of the Fama and French three factor model in explaining returns on the JSE. Investment Analysts Journal, 39(71), 13–25. https://doi.org/10.1080/10293523.2010.11082516
- Benati, S., & Rizzi, R. (2007). A mixed integer linear programming formulation of the optimal mean/value-at-risk portfolio problem. European Journal of Operational Research, 176(1), 423–434. https://doi.org/10.1016/j.ejor.2005.07.020
- Boggs, P. T., & Tolle, J. W. (2000). Sequential quadratic programming for large-scale nonlinear optimization. Journal of Computational and Applied Mathematics, 124(1–2), 123–137. https://doi.org/10.1016/S0377-0427(00)00429-5
- Carhart, M. (1997). On persistence in mutual fund performance. The Journal of Finance, 52(1), 57–82. https://doi.org/10.1111/j.1540-6261.1997.tb03808.x
- Dewandaru, G., Masih, R., Bacha, O., & Masih, A. (2015). Combining momentum, value, and quality for the Islamic equity portfolio: Multi-style rotation strategies using augmented Black Litterman factor model. Pacific-Basin Finance Journal, 34, 205–232. https://doi.org/10.1016/j.pacfin.2014.12.006
- Engel, J., Wahl, M., & Zagst, R. (2018). Forecasting turbulence in the Asian and European stock market using regime-switching models. Quantitative Finance and Economics, 2(2), 388–406. https://doi.org/10.3934/QFE.2018.2.388
- Fama, E., & French, K. (1992). The cross‐section of expected stock returns. The Journal of Finance, 47(2), 427–465. https://doi.org/10.1111/j.1540-6261.1992.tb04398.x
- Frazzini, A., & Pedersen, L. (2014). Betting against beta. Journal of Financial Economics, 111(1), 1–25. https://doi.org/10.1016/j.jfineco.2013.10.005
- Hodnett, K., Hsieh, H., & Van Rensburg, P. (2012). Equity style payoffs and stock return predictability: Evidence from the South African JSE Securities Exchange. Journal of Applied Business Research (JABR), 28(4), 605–618. https://doi.org/10.19030/jabr.v28i4.7044
- Hoffman, A. (2012). Stock return anomalies: Evidence from the Johannesburg Stock Exchange. Investment Analysts Journal, 47(75), 21–41. https://doi.org/10.1080/10293523.2012.11082542
- Jacobs, B., & Levy, K. (1988). Disentangling equity return regularities: New insights and investment opportunities. Financial Analysts Journal, 44(3), 18–43. https://doi.org/10.2469/faj.v44.n3.18
- la Torre-Torres, D., Oscar, V., Galeana-Figueroa, E., Río-Rama, D., de la Cruz, M., & Álvarez-García, J. (2022). Using Markov-switching models in US stocks optimal portfolio selection in a Black–Litterman context (part 1). Mathematics, 10(8), 1296–1296. https://doi.org/10.3390/math10081296
- Liu, D. (2017). Pure quintile portfolios. The Journal of Portfolio Management, 43(5), 115–129. https://doi.org/10.3905/jpm.2017.43.5.115
- Meucci, A. (2005). Estimating the distribution of the market invariants. Springer Berlin Heidelberg. https://doi.org/10.1007/978-3-540-27904-4_7
- Muller, C., & Ward, M. (2013). Style-based effects on the Johannesburg Stock Exchange: A graphical time-series approach. Investment Analysts Journal, 42(77), 1–16. https://doi.org/10.1080/10293523.2013.11082552
- Page, D., & Auret, C. (2019). A panel-data analysis of the explanatory power of factor premiums on the Johannesburg Stock Exchange (JSE). Investment Analysts Journal, 48(2), 102–113. https://doi.org/10.1080/10293523.2019.1619302
- Page, D., Britten, J., & Auret, C. (2016). Idiosyncratic risk and anomaly persistence on the Johannesburg Stock Exchange (JSE). Investment Analysts Journal, 45(1), 31–46. https://doi.org/10.1080/10293523.2015.1125060
- Page, D., McClelland, D., & Auret, C. (2021). Style rotation on the JSE. Finance Research Letters, 46, 102504. https://doi.org/10.1016/j.frl.2021.102504
- Sharpe, W. (1992). Asset allocation: Management style and performance measurement. The Journal of Portfolio Management, 18(2), 7–19. https://doi.org/10.3905/jpm.1992.409394
- Van Rensburg, P. (2001). A decomposition of style-based risk on the JSE. Investment Analysts Journal, 30(54), 45–60. https://doi.org/10.1080/10293523.2001.11082431
- Ye, W., Zhu, Y., Wu, Y., & Miao, B. (2016). Markov regime-switching quantile regression models and financial contagion detection. Insurance: Mathematics and Economics, 67, 21–26. https://doi.org/10.1016/j.insmatheco.2015.11.002
- Zhu, H., Wang, Y., Wang, K., & Chen, Y. (2011). Particle Swarm Optimization (PSO) for the constrained portfolio optimization problem. Expert Systems with Applications, 38(8), 10161–10169. https://doi.org/10.1016/j.eswa.2011.02.075