
 ?Mathematical formulae have been encoded as MathML and are displayed in this HTML version using MathJax in order to improve their display. Uncheck the box to turn MathJax off. This feature requires Javascript. Click on a formula to zoom.
Abstract
Agricultural cooperatives are considered as an institutional instrument for supporting smallholder farmers and contributing to poverty alleviation and food security. However, empirical literature and practices on the ground are mixed and inconclusive. The main purpose of this study is, therefore, to analyze the impact of agricultural cooperatives on households’ food security status in the context of Halu Woreda. The study employed a quasi-experimental research design to estimate the impact of such collective organizations on food security. Primary data were collected from 260 rural households drawn via a stratified random sampling technique. A variety of impact estimation models were employed to check the robustness of the results. The findings revealed that being a cooperative member is determined by a combination of factors, including the sex and age of the household head; access to farm inputs, credit, and training; and the welfare status of the household head. The findings also showed that agricultural cooperatives have a statistically significant positive impact on the food security status of households. It is concluded that agricultural cooperatives are effective in improving the food security status of the households in the study area. Therefore, regional rural development policy and strategy should focus on strengthening and genuinely supporting the existing agricultural cooperatives while encouraging the establishment of new ones through an inclusive approach in ways that directly address poverty and food insecurity. By highlighting the implications of the impact of agricultural cooperatives on food security, this article contributes to the ongoing debates on the potential benefits of such associations to farmers’ livelihoods in rural areas.
PUBLIC INTEREST STATEMENT
Agricultural Cooperatives can function as and address what Simel Esim has referred to as a “triple bottom line”: economic actors (profit), social institutions (people), and environmental actors (the planet) simultaneously. In doing so, they could significantly contribute to alleviating poverty, enhancing the food security of rural people, and ensuring the availability of essential infrastructure and services even in areas that the government and private businesses overlook. However, due to numerous factors, the benefits and impacts of such collective associations vary from country to country and even from area to area within a country. It is against this background that the authors have attempted to analyze the impact of agricultural cooperatives on the food security status of rural households in Halu Woreda, Ethiopia. The results showed that agricultural cooperatives have a positive impact on the food security status of rural households. Therefore, sustainable and inclusive agricultural cooperative policies and strategies should be adapted to different rural household groups.
1. Introduction
Agricultural cooperatives (ACs) play an important role in supporting small-holder producers and marginalized groups such as young people and women. They empower their members economically and socially and create sustainable rural employment through business models that are resilient to economic and environmental shocks (FAO, Citation2012a). They offer small agricultural producers opportunities and a wide range of services, including improved access to markets, information, communications, technologies, credit, training, and warehouses. They also facilitate small-holder producers’ participation in decision-making at all levels, support them in securing land-use rights, and negotiate better terms for engagement in contract farming and lower prices for agricultural inputs such as seeds, fertilizer, and equipment The International Co-operative Alliance [ICA], & The International Labour Organization [ILO], Citation2014). Particularly in poor continents like Africa, membership-based rural producer organizations such as cooperatives, peasant associations, and unions can help alleviate rural poverty (Chen et al., Citation2007). For instance, ACs can help smallholders achieve scale economies in input provision and output marketing, thus reducing their production costs and improving their bargaining power in the market (Berdegué, Citation2001; Rondot & Marie-Helene, Citation2001).
The Government of Ethiopia (GoE) has recognized this reality and placed high priority on the promotion of cooperatives in agriculture and rural development as an engine of pro-poor growth. Food insecurity remains a delicate issue in Ethiopia, and yet its agriculture sector has great potential to play a stronger role in development, food security, and poverty reduction. One of the strategies that the GoE has undertaken to reduce food insecurity and enhance rural development in the rural area is the establishment and strengthening of ACs. ACs have been the pillars for agricultural development and food security and have played a crucial role in reducing poverty, improving food security, and generating employment opportunities (Emana, Citation2009). As a result of the initiatives taken by the government, different types of co-operatives are established and engaged in different activities, including multipurpose primary agricultural co-operatives, housing co-operatives, saving and credit co-operatives, arts, livestock marketing and dairy co-operatives, minerals, fisheries, sugar cane, and vegetable production, among others (Federal Cooperative Agency [FCA], Citation2006).
Classical and neoclassical theories underline both the direct and indirect benefits of cooperatives to the local community (Banerjee et al., Citation1994; Gertler, Citation2004; Jackson & Marks, Citation1999; Spear, Citation2000). In contrast to commercial enterprises, cooperatives serve social and environmental goals as well as financial ones (Bernard et al., Citation2010). And so, it is argued that ACs uniquely affect the livelihoods of poor households, smallholder farmers, and communities that depend on traditional farming systems with poor technology, low capital, weak institutions, and poor infrastructure ICA & ILO, Citation2014). This is because they have the capacity to increase agricultural production, income, welfare, food security, and improve services at the lowest possible cost by enhancing synergy and economies of scale (Gertler, Citation2004; Zeweld et al., Citation2015).
However, despite the potential benefits that cooperatives have for poor rural communities (e.g., increasing smallholder bargaining power in imperfect markets; facilitating access to new markets; allowing communities to share risk collectively), it is unclear and inconclusive whether they can lift poor people out of poverty (Bernard et al., Citation2010). Studies have shown that poor households are less likely to participate in cooperatives and that, in most cases, cooperatives are located in areas where access to markets is better than average (Bernard & Spielman, Citation2009; Bernard et al., Citation2008). In fact, this suggests that cooperatives tend to favor better-off households (i.e., those that are more educated and have more land) (Adjin et al., Citation2020; Bernard et al., Citation2008; Francesconi & Heerink, Citation2011). Unlike the theoretical accounts, the empirical and practical evidence shows inconclusive impacts of agricultural cooperatives on livelihood outcomes in rural communities (Ahmed & Mesfin, Citation2017). Generally, the empirical evidence in Ethiopia and beyond shows mixed effects of ACs. While some studies have found positive contributions of ACs to the wellbeing of rural communities (Abate et al., Citation2014; Abebaw & Haile, Citation2013; Adjin et al., Citation2020; Asfaw et al., Citation2012; Assefa, Citation2013; Debela et al., Citation2018; Ma & Abdulai, Citation2019), others have reported that farmers’ collective actions did not enhance rural households’ livelihood in general (Poulton et al., Citation2010); and that of women in particular (Baden & Pionetti, Citation2011).
The mixed and/or inconclusive findings may be the result of a variety of internal and environmental factors that affect ACs as well as variations in the methodology used by researchers. Some of the internal factors include the type of cooperatives, their visions, missions, purposes, programs, leadership, commitment, and activities (Alem & Söderbom, Citation2012; Bernard et al., Citation2013). Household-related factors such as sex, age, marital status, education, family size, assets, access to information, and the market would affect membership, production, and other livelihood outcomes as well. The external factors could be social, economic, institutional, environmental, and technological (Ahmed & Mesfin, Citation2017; Bernard & Spielman, Citation2009; North, Citation1990). For example, the state of local governance, the availability of social (schools, health, etc.) and physical (communication, roads, transportation, energy, etc.) infrastructure, flora and fauna, soil fertility, geographic location, etc., and various institutional support schemes such as credit supply, input supply, market linkages, etc., determine participation and its associated gains. The implication of this description is that context-specific studies on the impact of ACs are crucial in developing continents like Africa in general and Ethiopia in particular to generate evidence-based results that could inform policy decisions at the national and/or local levels. The purpose of this study is, therefore, to identify factors that determine farmers’ participation in ACs and examine the impacts of such collective associations on the food security status of rural households residing in Halu Woreda, Illubabor Zone of Oromia Region.
Our paper could contribute to the existing literature on the impact of ACs in three major ways: thematically, methodologically, and contextually. Thematically, we address the availability and access dimensions of food security and provide insights into the dynamic and multidimensional nature of food security. Methodologically, we analyze the impact of ACs on the food security status of rural communities by using diverse impact evaluation models (propensity score matching, inverse probability weighted adjusted regression, coarsened exact matching, and endogenous switching regression) in order to ensure the credibility, validity, and robustness of our study. Contextually, we investigate the impact of ACs in the context of Halu Woreda in the Illubabor Zone of the Oromia Region. This area has a long history of ACs, but there is a high prevalence of food insecurity in the area (Quirin & Dixon, Citation2012). To the best of our knowledge, no research has been conducted in this area.
The remaining sections of the paper proceed as follows: Section 2 highlights the theoretical framework that guided the study; Section 3 presents the methods employed, including research and sampling design, as well as an econometric framework and estimation technique. The data, descriptive statistics, empirical results, and discussions are presented in Section 4. The final section highlights the conclusion and policy implications.
2. Theoretical framework
This study is guided by insights from the New Institutional Economics (NIE) perspective, mainly transaction cost economics (TCE) and collective action theory within the context of ACs. The concept of transaction cost was introduced by Coase (Citation1937) in his seminal paper on the nature of the firm, where he argued that there are new methods to manage transactions. According to him, transaction costs are the root cause of all market failures. He supports the idea that market failures are often caused by inefficient resource allocations, which can be resolved or minimized by more efficient allocation of resource using institutions such as cooperatives (Coase, Citation1937). This argument has laid the foundation for the organization of a cooperative as a key instrument to address the problem of market failure (Pereira, Citation2014).
The TCE was subsequently formalized by Williamson (Citation1975), and it has since been linked to the NIE. The fundamental tenet of TCE theory is based on the suppositions that transactions involve unpredictability over their results and that agents are opportunists and have bounded rationality. In order to deal with uncertainty, agents must adopt a governance structure (like a cooperative) with the intention of lowering transaction costs (Williamson, Citation1981). According to Williamson (Citation1975), institutions are cost-minimizing structures, and they can vary and develop in response to the types and sources of transaction costs (observable and unobservable) related to the exchange of goods and services or the transfer of resources. Williamson (Citation1971) also asserted that firms can fix market failures and imperfections through integration, which eventually leads to more efficient resource allocation. Through integration (cooperation), firms internalize transactions to circumvent employing market mechanisms and lower transaction costs while resolving or reducing market failures. Following this, economic theories on cooperatives (mainly NIE) defend such collective organizations based on their prospect and capacity to either correct or mitigate market failures (Cook, Citation1995; Hicks & Kenworthy, Citation1998; Sexton & Iskow, Citation1988).
Likewise, Olson’s (Citation1965) collective action theory explains why people cooperate to solve social problems by shifting their focus from their own interests to the interests of the group. According to the theory, incentives and costs that must be borne by each member of a group (in a cooperative setting) have an effect on that person’s behavior. Although common goals and transaction costs are virtually always necessary for the organization of cooperatives, the theory contends that these factors alone cannot entirely determine the success of collective action since people naturally balance the benefits and costs of joining a group. Therefore, the theory argues that an organization’s (like a cooperative’s) success is greatly dependent on its capacity to meet the interests of its members and to minimize and/or regulate the problem of free riders that often arises from the growing size of members (Olson, Citation1965). ACs in Ethiopia, including the study area, are established by members who share a common goal of meeting their socio-economic needs and aspirations. The implication is that ACs in the study area and elsewhere in the country can retain existing members and attract non-members to the association only if they are able to fulfil the socioeconomic interests of their members (such as food security and welfare) and manage free rider problems, which are common among ACs. As claimed by agency theory, ACs can also fulfil the interests of their members if they are able to solve principal-agent problems, which could arise when governing bodies (such as boards of directors, managers, etc.) work against the common interests and benefits of the members (Richards et al., Citation1998). This article will not address the issues of free rider and principal-agent relationships and problems because they are outside its scope.
Generally, the main reason individual small farmers join cooperatives is to overcome the challenges they individually face in obtaining agricultural inputs, producing, marketing, and distributing products that result from high transaction costs, and mitigating the risks they face collectively in such a way that improves their livelihoods. As can be noted from cooperative literature, such collective associations are primarily established to attain the social and economic goals of their members and to improve their living standards. For example, cooperatives are believed to strengthen the social capital of members, improve their access to social services and markets, and improve their welfare (by linking them with their association businesses). Given that both social and economic factors serve the shared interests of members acting collectively, members may be able to manage and reduce transaction costs (Nilsson, Citation1996). Experimental evidence shows that people are more likely to act in ways that advance the shared goals of the group they belong to when they believe that others in the group would act in the same way (Fehr & Gächter, Citation1999).
In a nutshell, farmers who decided to join cooperatives could benefit from a range of services offered by cooperatives, including access to crucial agricultural inputs, markets, information, and training facilities; better product, market, and technology; decision-making processes; ownership of common facilities; and risk-sharing mechanisms (Abebaw & Haile, Citation2013; Ahmed & Mesfin, Citation2017; Nkechi & Onugu, Citation2015). These services could in turn lower transaction costs, increase economies of scale and technical efficiency, and improve small farmers’ commercialization behavior (Abate et al., Citation2014; Abebaw & Haile, Citation2013; World Bank, Citation2008). These would again ultimately enhance farmers’ agricultural output and productivity, farm income and profit, food security, and assets (Abate et al., Citation2014; Assefa, Citation2013; Debela et al., Citation2018; Ma & Abdulai, Citation2019; Nkechi & Onugu, Citation2015; Österberg & Nilsson, Citation2009). Accordingly, it is hypothesized in this study that farmers with diverse demographic and socioeconomic characteristics who perceive and understand the social, economic, and technological benefits of ACs and have high expectations for these benefits to materialize are more likely to join ACs and take advantage of these benefits to improve their status of food security.
Studies have shown that the age, sex, and educational level of the household head could influence farmers’ decisions to join ACs because of unreliable and incomplete markets. For instance, according to studies by Gyau et al. (Citation2016), Mojo et al. (Citation2017), and Verhofstadt and Maertens (Citation2014), household head education has a positive effect on the decision of farmers to join ACs because educated farmers have the abilities and networks needed to obtain and analyze information on the advantages and disadvantages of ACs and make rational decisions. Besides, some studies have found that households led by females are less likely to join ACs due to sociocultural factors, reproductive roles, and the laborious nature of group activities, which minimize their incentive to participate (Abebaw & Haile, Citation2013; Weinberger & Jütting, Citation2001), while others reported an insignificant effect of sex on AC membership (Verhofstadt & Maertens, Citation2014). Several studies also concluded that the age of the household head has a positive effect on farmers motivation to join cooperatives (Abate et al., Citation2014; Abebaw & Haile, Citation2013; Gyau et al., Citation2016; Hagos et al., Citation2018; Mojo et al., Citation2017; Weinberger & Jütting, Citation2001). However, some researchers, such as Debela et al. (Citation2018) and Ito et al. (Citation2012), reported the negative influence of age on cooperative membership, while others reported that the age of the household head does not affect the likelihood of cooperative membership (Verhofstadt & Maertens, Citation2014). Some studies have also found that household size influences farmers’ membership decisions (Bernard & Spielman, Citation2009; Hagos et al., Citation2018; Mojo et al., Citation2017), while others reported the variable does not have an effect on the probability of being a cooperative member (Verhofstadt & Maertens, Citation2014).
The participation of farmers in ACs is also found to be significantly influenced by cultural, social, and economic factors, including access to productive and natural resources (Abebaw & Haile, Citation2013; Bacon, Citation2010; Kaaria et al., Citation2016), although the findings are mixed. For instance, numerous studies have shown that farmland size and livestock holdings positively influence farmers’ participation in ACs (Abebaw & Haile, Citation2013; Arayesh, Citation2011; Francesconi & Heerink, Citation2011; Mojo et al., Citation2017). However, some studies, including those by Karlı et al. (Citation2006) and Verhofstadt and Maertens (Citation2014), suggest that having more land decreases the probability of joining a cooperative. Others, such as Hagos et al. (Citation2018), have reported that land size does not influence farmers participation in ACs. Smallholder farmers’ motivation to join cooperatives has also been found to be significantly influenced by their access to financial and information resources (Arayesh, Citation2011; Mojo et al., Citation2017; Nugusse et al., Citation2013). Besides, other institutional factors, including market access, access to extension services, and access to farm inputs, can also affect farmers’ participation in ACs. Particularly, access to the market is directly related to the transaction costs that emerge when households partake in input and output marketing endeavors (Dung, Citation2020). According to some studies (such as Abebaw & Haile, Citation2013; Verhofstadt & Maertens, Citation2014), farmers’ participation in ACs is greatly influenced by the distance to the nearest road that connects farmers to the market. Likewise, several studies have reported that farmers often decide to join ACs in order to gain access to extension services and realistically priced inputs (Abebaw & Haile, Citation2013; Gyau et al., Citation2016; Nugusse et al., Citation2013), though others, such as Hagos et al. (Citation2018), found that extension services do not have an effect on members decisions to join ACs.
As can be noted from the above summary, empirical studies have shown that factors that influence individual farmers’ decisions to join ACs are mixed and mostly context-specific (Manning et al., Citation2012). Aside from that, as stated in the introduction section, empirical studies and practical evidence reveal that agricultural cooperatives have mixed and inconclusive impacts on livelihood outcomes in rural areas (Ahmed & Mesfin, Citation2017) for a number of reasons that are covered in the same section. Therefore, this study aims at identifying factors that influence farmers’ participation in the ACs and quantifying the impact of such cooperatives on the food security status of members in the context of Halu district.
3. Materials and methods
3.1. Description of study area
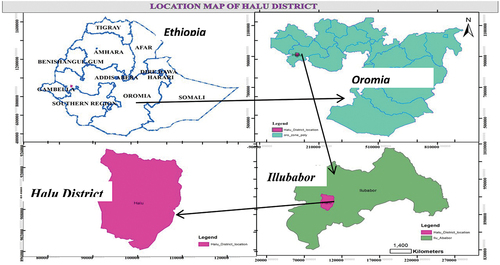
This research was carried out in Ethiopia’s Oromia region, Illubabor Zone, Halu Woreda (Figure ). The Woreda is located 645 kilometers west of Addis Ababa, the country’s capital city, and 45 kilometers from Mettu town along the main road that connects Addis Ababa to Gambella. Halu Woreda is one of the current 24 Woredas of the Illubabor Zone of Oromia Region. Nono-Sele Woreda borders the study area in the southern part, Mettu Woreda in the northern part, Ale Woreda in the eastern part, and Bure Woreda in the western part. According to the Halu woreda (Finance and Economic Development Office [FEDO], Citation2018), astronomically, the Woreda is located between 8967’31“and 9252’23.47” north latitude and 918’69“and 9188’21” east longitude. The main administrative center of the Woreda is Uka town. The total population of the Woreda is 41,935, of which 21,014 are men and 20,921 are women (FEDO, Citation2018). The area is characterized predominantly by Bede-Bere (middle land) agro-ecology, and mixed crop-livestock farming is the dominant production system (Lemessa, Citation1999).
Figure 1. Location map of the study area.
3.2. Research design and data
This study employed a quasi-experimental research design. This design compares the outcomes of cooperative members and non-members, i.e. the treatment (cooperative member households) and comparison (non-member households). When researchers are unable to randomly assign subjects to a treatment or comparison group, this type of research design is frequently used. The comparison group is frequently identified to capture counterfactual situations, i.e., what would have happened to cooperative members’ food security if the intervention, such as agricultural cooperatives, had not been introduced in the area.
We collected data from both primary and secondary sources. Primary data were collected from rural farm households (both cooperative members and non-members) on various demographic, socio-economic, and farm-specific characteristics including sex, age, gender, education, family size, farm land size, livestock, access to credit, market, information, training, and extension services, output, agricultural input utilization, membership in farmer-based cooperatives, saving and income, and perception about the importance of cooperative organizations. A survey questionnaire was initially prepared in English and then translated into Affan Oromo and employed to collect data with the help of agricultural development and extension agents. On the other hand, secondary data were collected from various sources, including journal articles, books, government documents, and other relevant materials. Secondary sources were used to gain a thorough understanding of the issue under investigation, guide our research and sampling design, theoretical and empirical model specifications, and primary data collection instrument development, build and support our augments, and link our results from primary data to the existing body of knowledge.
A multistage sampling technique was used to select samples for the study. The first stage included the deliberate selection of the Halu Woreda (district) of the Illubabor zone due to its long history of farmer cooperatives and high prevalence of food insecurity (Quirin & Dixon, Citation2012). In the second stage, Kebeles (villages) were stratified into cooperatives and non-cooperatives. Based on the information obtained from the Halu Woreda agricultural office, nine Kebeles were identified as cooperative Kebeles, while three were documented as non-cooperative Kebeles (villages where cooperatives are not yet established). In the third stage, members’ sampling frame was developed based on the complete list of cooperatives and their members obtained from the Sor-geba Agricultural Farmers’ Cooperative Union (nine cooperatives operating in the study area are members of this union). A list of non-members was obtained from Woreda’s agricultural office to form the sampling frame. In the fourth stage, 121 members (from a total of 624 members) and 139 non-member households were selected using a systematic sampling technique. We applied the sample size formula suggested by Kothari (Citation2004) for a finite population. Thus, the sample size is obtained as follow:
,
Where n= required sample size, N=Population, Z = 1.96, e = 8%, P = 0.5, q = 0.5.
To compensate for poor matching, the number of non-members was oversampled by 15% (that is, 121 × 0.15 = 18, and so, 18 + 121 = 139). The details of the proportion of sample taken from each Kebele (village) are summarized in Table , indicated in the Appendix.
Table 1. Proportion of sample taken from each Kebele
3.3. Econometric framework and estimation techniques
3.3.1. Cooperative membership choice decision
Generally, a farmer could decide to join a cooperative association to get access to various services (such as but not limited to credit, farm inputs, technologies, information, or marketing facilities) provided by such collective action institutions. Therefore, a decision to join a farmer’s agricultural cooperative can be modeled in a random utility framework (Abebaw & Haile, Citation2013; Ito et al., Citation2012). That is, a rational farmer is assumed to decide to join an AC if the expected utility from being a member of such an organization (M1) is greater than that from non-membership (M0). In other words, let represent the difference between the utility derived from selecting cooperative membership
and that derived from electing non-membership
, such that a household i will select to join an agricultural cooperative, if
=
>0. This utility incentive from membership in agricultural cooperatives (
=
) can be stated as a function of an observable vector of covariates (Z) in a latent model as follows:
where = 1 if a farmer joined an agricultural cooperative and
= 0 otherwise;
denotes a vector of household demographics, socio-economic characteristics, farm-level characteristics, and institutional variables that may affect cooperative membership choice; ψ is a vector of parameters to be estimated; and
is an error term, which is assumed to be normally distributed with a zero mean. Becoming a member of an agricultural cooperative is expected to influence numerous outcome variables at the farm or household level, including the food security status of the household. Supposing that the outcome variable (food security) is a linear function of a vector of exogenous variables Xi and endogenous membership in ACs Mi such that:
where represents the outcome variable (food security);
as defined above; β and
are parameters to be estimated; and
is the error term. Nevertheless, a farmer may self-select into ACs, instead of being randomly selected. Thus, using ordinary least square (OLS) to estimate equation (Eq.) 2 could yield biased estimates. We, therefore, opted to employ propensity score matching (PSM) and endogenous switching regression (ESR) models to generate unbiased and consistent estimates. The PSM enabled us to control for selection bias by controlling for observable confounding variables. However, the PSM method is unable to address biases arising from unobservable characteristics (such as intrinsic ability, expectation of benefits and transaction costs, and motivation to improve welfare and food security, among others) of sampled households. To address this issue and ensure the consistency and robustness of our results, we employed the ESR model (especially to handle the endogeneity of membership in ACs by accounting for both observed and unobserved sources of bias) (Lokshin & Sajaia, Citation2004).
3.3.2. Propensity score matching
PSM is a family of quasi-experimental techniques frequently used in observational causal studies to control for the households’ observable characteristics by comparing the outcomes of cooperative members with those of matched non-members based on similarity in observed characteristics, which minimizes the bias (arising due to observable characteristics of households and communities). If it is not feasible to control for these characteristics, PSM estimation will become biased. Having control households from the same communities as program beneficiaries helps to reduce the risks of such bias. However, removing unobservable characteristics remains the main problem with this method (Rosenbaum & Rubin, Citation1983).
The PSM method operates under two main assumptions: conditional independence and common support. The former states that noticeable characteristics must be independent of potential outcomes, which suggests that the membership decision by farmers is only based on their observable characteristics. The latter second articulates the common support condition that needs to be satisfied, that is, the distributions of observable characteristics between members of ACs and non-members need to have commonality (overlap) (Jelliffe et al., Citation2018). We have checked these assumptions by conducting sensitivity analysis, common support graphs, and quality of matching (see section 4.3 below). Besides, as noted by Heckman et al. (Citation1999), in order to ensure the validity of the PSM method, treatment and comparison households should operate in the same markets and come from similar agro-ecologies (from sufficiently close locations) and socioeconomic conditions. We have drawn comparison groups (non-members) from the same community, adjacent location, and similar agro-ecology.
For empirical purpose, we have gone through the following steps: In the first step, following Hirano et al. (Citation2003), we regressed the membership in ACs on a vector of household’s observable characteristics Z (as indicated in Equationequation 1(1)
(1) ) to create the propensity scores using a logit estimation. We included in Z an enormous set of covariates based on an empirical literature review in order to lessen the problem of omitted variable bias. In the second step, we checked whether or not, within each quintile of the propensity score distribution, the average propensity score and mean of covariates were balanced across the treated and comparison groups. In the third step, due to the sensitivity of PSM to a specific specification and matching strategy, following Austin (Citation2011), Caliendo and Kopeinig (Citation2008), and Imbens (Citation2003), we applied several matching algorithms (such as the nearest neighbor, kernel, and radius) for the purpose of matching members and non-members having similar propensity scores. In the fourth step, we examined a graph of the propensity score for treated and comparison groups and tested whether or not the treatment and comparison groups are balanced in the matched samples to assess the validity of the common support assumption. The fifth step comprised the computation of the average treatment for treated households (ATT), which is the mean difference in food security status between member and non-member households over the common support region properly weighted by the propensity score distribution of participants (Austin, Citation2011; Caliendo & Kopeinig, Citation2008; Imbens, Citation2003). The estimated ATT is expressed as follows:
where represents the expectation regarding the distribution of propensity scores; Y1 represents the food security status of members, Y0 is the food security status of non-members; and M and Z are defined as previously. In the final step, we checked the robustness of our estimates and assessed the potential impacts of unobserved confounders on the treatment effect by conducting sensitivity analysis using the Rosenbaum bounding approach (Rosenbaum, Citation2002).
3.3.3. Inverse probability weighted estimation
With all these checks, however, the ATT generated via the PSM model could still yield biased results due to misspecification of the model (Robins et al., Citation2007; Wooldridge, Citation2007). To address this problem, scholars have proposed an inverse probability weighted (IPW) strategy, which permits the outcome and the treatment model to account for misspecification and produces consistent results due to its double-robust property (Robins et al., Citation2007; Wooldridge, Citation2007, Citation2010). We estimated ATT in an inverse probability weighted adjusted regression (IPWRA) model as follows: Let the outcome model be represented by a linear regression function of the form =
+
+
for i = [0 1] and the propensity scores which are given as p(x,
. Following Wooldridge (Citation2010), we first estimated the propensity scores as p(x,
. Second, we employed linear regression to estimate (
) and (
) by using inverse probability weighted least squares as follows:
We then calculated ATT by considering the difference between EquationEq. (4)(4)
(4) and EquationEq. (5)
(5)
(5) as follows:
where ( and
represent inverse probability weighted parameters for members, (
and
denote inverse probability weighted parameters for non- members, and
is the total number of treated households.
3.3.4. Coarsened exact matching
We have also employed coarsened exact matching (CEM) to increase the credibility, validity, and robustness of our results. Some scholars question the results of ATT generated via PSM, arguing that this model often gives rise to inefficiency, amplified imbalances, model dependency, and statistical bias (King & McGrath, Citation2002). Scholars who developed CEM (Iacus et al., Citation2012) have advised researchers to employ CEM as an alternative matching strategy to improve causal inferences. They argued and showed that CEM reduces model dependence, imbalances, estimation error bias, variance, and mean square error (Iacus et al., Citation2012). The exact matching approach is often used to identify matches and cut unmatched units after CEM coarsens each variable by recoding so that several values with similar characteristics are aggregated and given similar values. Finally, the coarsened data is removed while keeping the matched data’s original values (Kumar et al., Citation2021).
Following coarsening, the CEM generates a block of strata in the region of € S, each with a few coarsened Z values. Let us consider a sample size of n (n ≤ N) that holds units drawn from population N. As previously defined, let represent an indicator variable for household i that takes the value 1 if the ith household is a member of AC (belongs to the treatment group) and takes the value 0 if the ith household is a non-member (belongs to the comparison group). The observed outcome variable (food security)
=
(1) + (1-
)
(0) where
(0) is the outcome (food security status) for the non-member group and
(1) is the outcome (food security status) for the member group. The standard ignorability assumption is taken into account when estimating the impact of cooperatives on the food security status of a chosen group of households. This assumption states that, conditional on Z, the treatment variable is independent of the potential outcomes and that every treated unit receives the same treatment (Austin, Citation2011; Caliendo & Kopeinig, Citation2008; Rosenbaum & Rubin, Citation1983). Following Kumar et al. (Citation2021), the estimates for ATT can be expressed as:
where Yi (1) – Yi (0)|Zi, and
is total number of treated households in the original sample. An estimate via EquationEq. (7)
(7)
(7) is valid only when all treated households are matched. If not, however, the SATT can be changed to local sample average treatment for all treated (LSATT), given by:
where is the number of matched treated households and
is the subset of matched treated households.
3.3.5. Endogenous switching regression
In spite of accounting for misspecification bias, matching algorithms can only correct the selection bias brought about by observables. Yet, when the endogeneity bias is brought on by unobservable heterogeneity, the matching procedures will be flawed. However, the matching strategies will be biased when the endogeneity bias is caused by unobservable heterogeneity (Kumar et al., Citation2021). The ESR model uses conditional means to estimate actual and counterfactual outcomes while accounting for observed and unobserved heterogeneities (Bocher et al., Citation2017). In order to account for both observed and unobserved sources of bias, we used the ESR framework. We estimated the impact of membership in ACs on food security in two stages: the first stage models the decision of a household to join an AC (EquationEq. 1(1)
(1) ), and the second stage includes the specification of two linear regressions (two regime outcome equations): one for members and the other for non-members, as expressed in EquationEqs. 9
(9)
(9) and Equation10
(10)
(10) below:
where and
are the outcomes (food security status) for members (regime 1) and non-members (regime 2), respectively;
is the vector of covariates of a household I;
and
denote parameters to be estimated; and
and
are error terms related to the outcome variables. In the ESR model, the error terms indicated in the three EquationEqs. (1
(1)
(1) , Equation9
(9)
(9) , and Equation10
(10)
(10) ) are supposed to have a trivariate normal distribution with a zero mean and a non-zero covariance matrix of the following form:
where is the variance of the error term in the EquationEquation 24
(24)
(24) ;
and
represent the variances of the error terms in the EquationEqs. (9
(9)
(9) and Equation10
(10)
(10) );
and
are the covariates of
,
and
. Since
and
cannot be observed simultaneously, the covariance between
and
is unknown (Maddala, Citation1983; Ngoma, Citation2018). The expected values of
and
conditional on the sample selection are non-zero, as the error term of EquationEq. 1
(1)
(1) is associated with the error terms of the outcome EquationEqs. 9
(9)
(9) and 10. The expected errors conditional on AC’s membership are non-zero and expressed as (Adjin et al., Citation2020):
where is the standard normal probability density function;
represents the standard normal cumulative density function;
and
denote the Inverse Mills Ratios (IMR) calculated from EquationEq. 1
(1)
(1) with
and
which shows the correlation between ACs membership and food security. If the coefficients of correlation between the selection equation and the outcome equations are statistically significant, selection bias is present. To control for selection biases due to unobservable factors,
and
are included in the outcome EquationEqs. (9)
(9)
(9) and (Equation10
(10)
(10) ), respectively. To generate consistent estimates, the full information maximum likelihood (FIML) technique was employed (Greene, Citation2008; Lokshin & Sajaia, Citation2004). Therefore, the outcome equations are re-specified as:
where and
represent error terms with conditional zero means.
It takes at least one more variable as an instrument to properly identify and apply the ESR model. The chosen instrumental variable(s) should have a direct influence on the selection variable (household’s choice of ACs), but not on the outcome variables of interest (Adjin et al., Citation2020; Kumar et al., Citation2021). In this study, we employed two instrumental variables (IVs) based on the previous studies. The first instrumental variable that we employed is the farmer’s perception of the importance of cooperatives. The assumption is that farmers who perceive that joining ACs is important because doing so could add value to their livelihoods will be more likely to join this cooperative association. However, this perception cannot directly contribute to the food security status of the household. According to studies, households’ AC membership decisions are heavily influenced by their image and perceptions of cooperatives (Ito et al., Citation2012). The second potential instrumental variable that we used is whether farmers have access to or receive market information (price and sales). This instrumental variable is assumed to be significantly associated with membership in ACs. That is, farmers who highly value access to or receiving information on prices and sales will have a higher possibility of joining an AC. Farmers could become members of ACs with the motivation to get information (to be more informed) about sales and the related better prices (Adjin et al., Citation2020). But mere reception of this information cannot directly affect the outcome variable (food security status of households), though it can indirectly affect it through membership in ACs. We checked the validity of these IVs by running the logit model for selection EquationEquation 24(24)
(24) and the OLS method for outcome Equationequations (9
(9)
(9) and Equation10
(10)
(10) ) individually in order to examine the statistical significance level of these variables in each equation. The results show that the coefficients of market information (sales and price) and households’ perceptions of the importance of cooperatives are positive and statistically significant for the selection (membership) model but not significant in the outcomes (HFBM and HFIAS) (Table in the Appendix) for non-members. This confirms the expectation that households that perceive ACs as important and have access to market information are more likely to join cooperatives.
Table 2. Rosenbaum Γ bounds sensitivity analysis for hidden bias
Based on the assumptions on the distribution of the error terms EquationEq. (11)(11)
(11) , the derivative
log-likelihood function can be expressed as:
where , with j = 1, 2 and
(
and
representing the correlationcoefficients between the error term
of the EquationEquation 24
(24)
(24) and the error terms
and
of the outcome EquationEqs. (9
(9)
(9) and Equation10
(10)
(10) ), respectively. A selectivity bias that is often caused by unobserved factors would occur if one of the estimations of the correlation coefficients
or
is statistically significant (Abdul-Rahaman & Abdulai, Citation2018), indicating the appropriateness of the ESR model to apply.
Therefore, by using coefficients generated by the ERS model, we estimated actual outcomes (the expected food security status of households that joined ACs) and counterfactual outcomes (the expected food security status of households that joined ACs had they not become members). Following Adjin et al. (Citation2020), the actual observed and unobserved counterfactual outcomes (conditional outcome expectations) for AgrC members are specified below as:
We computed the observed outcome (a) for AC members by using EquationEq. 18(18)
(18) and the observed outcome (b) for non-members using EquationEq. 19
(19)
(19) . EquationEq. 20
(20)
(20) was used to calculate the expected outcome (c) to capture the counterfactual for the observed outcome (a). Likewise, EquationEq. 21
(21)
(21) was used to compute the counterfactual outcome (d) for the observed outcome (b). Following this, we calculated two treatment effects: the average treatment effect on treated households (ATT, that is, the difference between EquationEqs. 18
(18)
(18) and Equation20
(20)
(20) or a—c) and the average treatment effect on untreated households (ATU, that is, the difference between EquationEqs. 21
(21)
(21) and Equation19
(19)
(19) or d—b) (Table ).
Table 3. Instrumental variable checking for ESR regression
As indicated above, the effects of base heterogeneity (BHi) are derived by computing the differences between (a) and (d) for members and (c) and (b) for non-members. Likewise, transitional heterogeneity (TH) is calculated by taking the difference between ATT and ATU (Table ).
Table 4. Treatment and heterogeneity effect—decision stage
3.4. Food security indicators
Different scholars and institutions have employed both objective and subjective indicators to measure the food security status of households. In this study, two indicators, namely the Household Food Balance Model (HFBM) (objective) and the Household Food Insecurity Access Scale (HFIAS) (subjective), were employed. These two indicators were intended to capture the availability and access components of food security, which are the main components of our operational definition mentioned below and our focus theme. However, each indicator has its own limitations. For example, in HFBM, the respondent may not accurately state the actual figures about each component of the model, mainly due to a lack of proper records at the household level. Besides, HFBM may not capture the dynamic nature of food security given that it is computed for a specific time (usually one year). To address the limitations, the researchers themselves carefully and gently asked the respondents and properly recorded the responses. Due to the subsistence nature of agriculture in the study area, the authors believe that there will not be significant differences in households’ food security status between years. As far as the limitation of HFIAS is concerned, bias may be introduced because the selected respondent may not accurately express the experiences of food insecurity of all household members (Coates et al., Citation2007). To address this limitation, we interviewed at least two adult household members (mostly husbands and wives).
3.4.1. Household food balance model
HFBM is a simple numeric tool used to quantify the net food available at the household level for a specified period of time, usually one year. The indicator is designed to measure daily per capita calorie consumption among household members. The model was originally developed by the Food and Agriculture Organization of the United Nations (FAO) to examine regional food balance and adapted and modified by Degefa (Citation1996, Citation2002) for the first time to fit it into the context of rural households’ food security in the Oromia region. Degefa used the model to estimate the amount of calorie intake generated in food grains (cereals, pulses, and oilseeds) and compare the consumption behaviors of belgFootnote1 grower and non-belg grower farmers at the household level, as well as to identify the seasonal food insecurity status of households (Degefa, Citation1996, Citation2002). Following Degefa (Citation2002), the model can be expressed as follows:
where is the net food available for HH i in the year j;
represents the total crop produced by HH i in year j;
denotes total grain purchased from market by HH i in year j;
is the total food household i borrowed in the year j;
is total grain received from food for work (FFW) program by HH i in the year j;
is total grain received from relief by HH i in the year j;
is post-harvest loss to HH i in the year j;
is total grain used as a seed by HH i in the year j;
is total grain marketed (sold out) by household i in year j; and
is total grain given to others by household i in year j.
As a result, we used EquationEq. (24)(24)
(24) to calculate the value of net grain available (NGA) to a household in quintals for the 2020 production year (November 2019 to November 2020) by adding grain produced, bought, borrowed, obtained as aid, gift, or remittance, and subtracting post-harvest losses (both on- and off-farm), grain reserved for seed, grain sold, and grain given to others. Based on previous study estimations, we considered 5% of the total production for grain reserved for seed (Mesay, Citation2001) and 10% of the total yield for post-harvest losses (Degefa, Citation2002). Based on the results, we estimated the adult equivalent per capita daily kilocalories (Kcal) available for household consumption. We converted grain available in kilograms into equivalent kilocalories using the FAO (Citation2003) food energy and calorie conversion factor. We then divided kilocalories by the number of days in a year and by the size of the family. Per adult equivalent was calculated by converting each household member to an adult equivalent unit (AEU) by using a nutrition-based adult equivalent conversion factor developed by Dercon and Krishnan (Citation1998) for Ethiopia (see Table in the Appendix).
Table 5. Nutrition based adult equivalent conversion factor
3.4.2. Household food insecurity access scale
HFIAS is a brief survey instrument developed by Food and Nutrition Technical Assistance (FANTA) to assess whether households have experienced problems with food access during the last 30 days. This tool measures the level of food insecurity due to a lack of access to food. It has nine generic and occurrence questions, which yield information on food insecurity (access) at the household level. We followed the standard scoring procedure recommended by Coates et al. (Citation2007). We computed the HFIAS score for each household by adding up the frequency of occurrence question response codes (that is, Q1a + Q2a + Q3a + Q4a + Q5a + Q6a + Q7a + Q8a + Q9a), which could range from 0 to 27. The maximum score for a household whose response to all frequency-of-occurrence questions is “often” (coded as 3) could be 27, and the minimum score for a household whose response is “no” to all occurrence questions could be 0. The higher HFIAS shows the household had experienced more food insecurity (access) and vice versa (Coates et al., Citation2007).
4. Results and discussion
4.1. Descriptive statistics
Before presenting the econometric results of the impact of cooperative membership on rural households’ food security status, it is imperative to consider the descriptive statistics of the sample data. The definition and summary of descriptive statistics for the variables used in the study are presented in Table . Besides, this table presents the comparative descriptive statistics of the variables based on households’ membership status. The covariates used in this study were selected based on previous studies on determinants of cooperative membership (Abdul-Rahaman & Abdulai, Citation2018; Abebaw & Haile, Citation2013; Adjin et al., Citation2020; Ahmed & Mesfin, Citation2017).
Table 6. Definition of variables and mean differences in characteristics of sample respondents
In this study, an AC is conceptualized as an autonomous association of people united voluntarily to address their common economic, social, environmental, and cultural problems and desires through a jointly owned and democratically controlled enterprise (ICA & ILO, Citation2014). Following this, we defined membership in ACs as the involvement of a household in a rural producer organization that offers farmers access to resources and services for improving farming and agriculture-related activities, such as markets, loans, inputs, collective sales, and capacity building (Bernard et al., Citation2013). Moreover, we conceptualized household food security as the capacity of a household to produce adequate food and have sufficient resources to acquire food.
The result showed that households with AC membership accounted for 46.5% of the total sample (Table ). As shown above, the outcome variable (food security) is measured in terms of HFBM and HFIAS. The average daily kilocalories and HFIAS scores of the sampled households were 2553.52 and 5.56, respectively (Table ). AC members tend to consume more daily calories and have lower HFIAS scores than non-members. Around 88.8% of the households in the sample were chiefly male-headed. The sampled household heads were mostly adults in their productive years, with an average age of 46.9 years. The average length of schooling for the sampled households was 3.65 years. The result shows that cooperative members are more educated (on average, 4.26 years of schooling) than non-members (3.11 years). Members tend to have large farms and are more likely to use farm inputs (fertilizers and improved seeds). Compared to non-members, AC members have more access to extensions, credit, training services, and markets. They have higher savings, per-capital income, livestock, and health expenses, as well. Besides, members have more access to information and are more likely to be aware of the importance of cooperatives. In general, the descriptive statistics presented in Table show systematic differences in observed household, institutional, and farm-level characteristics between AC members and non-members. However, the results cannot allow us to make inferences about the impact that AC membership might have on households’ food security status given that simple comparisons of means do not account for confounding factors (both observed and unobserved). Therefore, the next section presents the results of rigorous impact assessment techniques such as PSM, IPW, CEM, and ESR.
4.2. Determinants of cooperative membership
Households’ decision to join ACs is determined by several factors. We employed a logit model to examine the factors that influence households’ participation in ACs. Table presents these factors with their marginal effects (estimations from the first stage of the ESP model presented in the second column of Table are also similar in terms of the direction of the influence). The likelihood ratio test indicates that the model estimates are significant at the 1% level (X2 = 210.39 (17), p < 0.01). The results (estimated by EquationEquation 1(1)
(1) ) show that membership in ACs is significantly determined by the sex and age of the household head; access to farm inputs, credit, training, and market information; the amount of savings, per-capital income, and health expenses; and perception about the importance of cooperatives.
Table 7. Logit estimation of membership in ACs
The gender and age of the household head have a significant and positive influence on the likelihood of a household being a member of an AC. For example, gender increases the probability of membership belonging by about 11.6%. This result is consistent with the ones that found that women are less likely to be members of cooperatives due to deep-rooted socioeconomic and cultural norms and practices that constrained them to join ACs (Abebaw & Haile, Citation2013; Mogues et al., Citation2009; Woldu et al., Citation2015). The result also shows that young households are about 4.6% more likely to join ACs than the older ones, which could be due to the greater capacity of young people for innovation and entrepreneurship, their greater tendency to learn and work with new technologies, and the fact that they mostly have higher levels of education (that could help them to easily analyze and understand the importance of cooperatives) than older farmers (FAO, Citation2012b). Access to farm inputs and various institutions such as credit, markets, and training has a statistically significant and positive effect on cooperative membership. This result is consistent with previous literature that reported these factors (mainly, access to credit and markets) as the major determinants of cooperative membership (Abdul-Rahaman & Abdulai, Citation2018; Abebaw & Haile, Citation2013; Adjin et al., Citation2020; Wossen et al., Citation2017). Moreover, the result shows that households with a relatively high level of savings, per capita income, and health expenses are more likely to join ACs. These variables often capture households’ welfare status and their capacity to afford the membership fee (the minimum requirement for joining ACs). The coefficients of both access to market information and the importance of cooperatives are positive and statistically significant (at p < 0.01), indicating that the instrumental variables are relevant (Table , Table , and Table ).
4.3. Impact of AC membership: PSM, IPW, and CEM results
This section presents the treatment effects estimated from the PSM, IPW, and CEM models. Based on the logit estimation of EquationEq. 1(1)
(1) , we obtained propensity scores for the matching. Before estimating the actual impact of AC membership, we carried out various matching quality tests to check the validity and reliability of the results. Table , Table , and Table in the Appendix provide overall covariate balancing tests for the PSM, IPW, and CEM methods, respectively. The standardized mean difference for all covariates used for matching decreases from 53.8% before matching to 9.8% after matching, as shown in Table . The pseudo-R2 was also notably dropped from 0.521 before matching to as low as 0.052 after matching. Besides, the likelihood ratio test shows that the null hypothesis of the joint significance of all covariates could not be rejected before matching (p < 0.01) but could be rejected after matching (p > 0.05) (Table in the Appendix). The low mean standardized bias and pseudo-R2 as well as the joint insignificance of the covariates are indicative of successful balancing of the distribution of covariates between treated and untreated households. Moreover, a graph of propensity scores for treated and comparison groups shows the existence of a sufficient overlap in the distribution of the propensity scores across treatment and comparison groups (Figure ). The covariate balance test for the IPW method was carried out by using an over-identification test and checking the module-adjusted difference in means and ratio of variance between the treated and comparison groups for each covariate. The result indicates that the differences in weighted means are insignificant, and the variance ratio for most of the variables is close to 1 (Table in the Appendix). Based on the over-identification test, we accept the null hypothesis that says the covariates are balanced (p > X2 = 0.445). This test and diagnostics confirm that covariates are balanced. Table in the Appendix presents the covariate balance for the CEM method. The result shows that all variables are balanced in the mean value (the values are close to zero) as well as in the quantiles of all distributions (zero values).
Figure 2. Common support region.
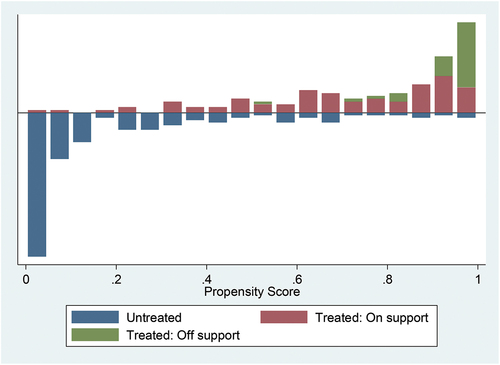
Table presents treatment effect estimates for cooperative membership using PSM, IPW, and CEM methods. As indicated above, three matching (nearest neighbor, kernel, and radius) techniques were used for PSM estimation. The result shows that members of ACs had higher daily calorie consumption than non-members. The ATT for HFBM is positive and statistically significant. More specifically, members’ average daily calorie consumption was increased by 724.5 kcal for NN, 739.2 kcal for radius, 628.6 kcal for kernel matching, 659.1 kcal for IPW, and 699.9 kcal for CEM. The measured values of the effect of membership are fairly close across the alternative matching specifications.
On the other hand, the impact of ACs ranged from 2.4 to 4.15 in terms of reducing the HFIAS values of member households. For example, membership in ACs reduced the HFIAS score of members, on average, by 3.25, 3.096, 2.403, 4.15, and 2.59 using NN, radius, kernel, IPW, and CEM matching specifications, respectively, which is significant for IPW and CEM (Table ). The lower HFIAS shows the household had experienced more food security (access) and vice versa (Coates et al., Citation2007). As shown in Table , members of ACs have a lower mean value for HFIAS. Therefore, it can be concluded that, in the absence of observable selection bias, ACs have a positive and significant impact on the food security status of households. Our result is in line with previous studies that examined the impact of agricultural cooperatives on the wellbeing of rural households (Ahmed & Mesfin, Citation2017; Ma & Abdulai, Citation2019) and their land productivity and income (Adjin et al., Citation2020).
We carried out sensitivity analysis using the Rosenbaum bounds approach to check the robustness of PSM results and assess the potential impact of unobserved confounders on the treatment effect. The results are presented in Table in the Appendix. The table displays the upper-bound results along with their p-values. The findings show that the positive impact of ACs on the food security of member households’ is not sensitive to hidden bias (at p < 0.001).
4.4. Impact of AC membership: ESR results
To enrich the credibility and robustness of our results generated via impact estimation techniques above, we employed an ESR model that has the capacity to control unobservable selection bias. The results of the FIML (which develops both the selection and outcome equations congruently) of the ESR models are reported in Table and Table . The results of the first stage estimations of ESR are presented in the second column, while the third and fourth columns present the estimated coefficients of the second stage of the estimation, i.e., estimations of the daily calorie consumption and HFIAS for member and non-member households (separate outcome equations), respectively.
As mentioned in section 4.2, the estimation results of the selection equation are comparable, in terms of signs and significance, to the estimation of the logit estimation of EquationEq. 1(1)
(1) . The results show that the instruments are positive and statistically significant for both models. In the lower part of Table and Table , we presented the estimates of correlation coefficients (ρ1 and ρ2) of covariance terms between the error term in EquationEq. (1)
(1)
(1) and the error terms in the outcome EquationEqs. (9)
(9)
(9) and (Equation10
(10)
(10) ). The correlation coefficients for membership equations and outcome functions (HFBM and HFIAS) are statistically significant for members (ρ1) but not significant for non-members (ρ2). The significance of ρ1 confirms the existence of selection bias rising from unobservable factors, suggesting that addressing the self-selection bias issue is important for getting consistent and unbiased treatment effects of cooperative membership on the food security status of households. Equally, this finding justifies the application of a combination of different impact estimation models and triangulating their results, which could boost the credibility, validity, and robustness of the actual impacts.
Furthermore, the Wald test of the joint significance of the correlation coefficient (reported in the lower part of Table and Table ) rejects the null hypothesis that there is no correlation between the cooperative membership choice equation and outcome equations, showing that it is more effective to use the ESR model than a simple logit model. Likewise, the likelihood ratio test results suggest that the three equations are jointly dependent, offering evidence for endogeneity that needs to be controlled in the model specification of the food security (HFBM and HFIAS) function. Besides, ρ1 (that is, members’ correlation coefficients) is negative for the HFBM model but positive for the HFIAS model. The negative sign for the HFBM model implies a positive selection bias, that is, households with above-average daily calorie consumption (food secure) are more likely to belong to ACs. On the other hand, the positive sign for the HFIAS model implies a negative selection bias, indicating that households with above-average HFIAS (food insecurity) are less likely to belong to ACs. As mentioned above, a higher HFIAS value shows food insecurity. In either case, the result shows that households with above-average food security scores are more likely to belong to ACs and are better off for being members.
The ESR model estimates the mean outcomes for treated (member) households (using EquationEq. 18(18)
(18) ) and comparison (non-member) households (using EquationEq. 19
(19)
(19) ) and their corresponding counterfactual outcomes via EquationEqs. 20
(20)
(20) and Equation21
(21)
(21) , respectively. Based on the results, we then computed ATT and ATU, that is, the net difference between the mean outcomes of member and non-member households and their respective counterfactuals. The results are presented in Table .
The results show that the treatment effect of membership in ACs on food security is positive and significantly different from zero (for the HFIAS, a negative sign shows a reduction in food insecurity). ATT is 1064.76 kcal per day for HFBM outcome, showing that membership in ACs has significantly improved the daily calorie consumption of members. In other words, the finding reveals that ACs have a statistically significant positive impact on the daily calorie consumption of member households. The coefficient of ATT for the HFIAS indicator is −4.7952, indicating that ACs significantly reduced the food insecurity status of member households. The transitional heterogeneity (TH) is found to be positive, which further confirms the robustness and greater impacts of ACs on member households than on non-member households. Therefore, it is safe to conclude that ACs are effective in improving the food security status of member households in the study area. Our results are consistent with the existing literature on ACs in developing countries, where positive impacts of such collective associations on food production and the economic welfare of members have been reported (Abebaw & Haile, Citation2013; Adjin et al., Citation2020; Ahmed & Mesfin, Citation2017; Francesconi & Heerink, Citation2011; Getnet & Anullo, Citation2012; Ma & Abdulai, Citation2019; Mishra et al., Citation2018; Verhofstadt & Maertens, Citation2014; Wossen et al., Citation2017; Zeweld et al., Citation2015).
5. Conclusions and policy implications
Based on cross-sectional data collected from households in Halu Woreda, Illubabor zone, this study provides critical insights into the impact of agricultural cooperatives on the food security status of rural people. Various impact estimation models (such as PSM, IPW, CEM, and ESR) were employed to estimate the treatment effects of such farmer collective organizations on the outcome variables of interest. The combinations of these estimation strategies have enabled us to improve the validity and robustness of our results. The ESR model was especially employed for controlling the self-selection problem in ACs and generating consistent actual and counterfactual outcomes.
The results reveal that being a cooperative member is determined by a combination of factors, including the sex and age of the household head; access to farm inputs, credit, and training; and the welfare status (savings, income per capita, and health expenses) of the household head. Access to market information (sales and prices) and perceptions about the importance of cooperatives were also among the factors influencing households’ decisions to belong to an agricultural cooperative. The findings show that ACs have a positive impact on the food security status of member households, as evidenced by higher daily calorie scores and lower HFIAS values. Results obtained from all impact estimation models appear to be consistent, suggesting the robustness of our results and conclusions. The ESR model, in particular, shows that membership in an ACs increases members’ daily calorie consumption by about 56% and reduces food insecurity by about 55%. These findings suggest that agricultural cooperatives are effective in improving the availability of and accessibility to food for member households. Generally, the findings support the notion that agricultural cooperatives have the potential to increase members’ agricultural production, income, welfare, and food security and improve services at the lowest possible cost through enhanced synergy and economies of scale and essential social networks for access to technologies, information, knowledge, and farm inputs. The empirical results underscore the importance of effectively supporting and promoting ACs in rural areas of poor countries like Ethiopia.
This article has some limitations. First, we acknowledge that our results cannot be generalized to the regional and national levels since our research is based on a case study. Second, a lack of panel data, which could uncover the dynamic nature of the variables and their relationships and measure variability creditably, can also be a limitation. Despite these limitations, our results imply that providing support to cooperatives is important to improve smallholder farmers’ economic status, agricultural productivity, and food security. The findings of our study can contribute to the ongoing debates on the potential benefits of agricultural cooperatives for smallholder farmers’ livelihoods in rural areas.
Finally, our study did not address the problems related to free rider (both internal and external), portfolio, control, horizon, and principal-agent, which could significantly impair the sustainability of ACs. We, therefore, suggest these issues for future research, including possible strategies to reduce or avoid the problems to ensure that ACs fully align with their objectives and principles.
Availability of data
The authors unanimously declare that they can submit the data at any time based on the request of editorial office. The corresponding author will provide the data used for this study based on sensible request.
Acknowledgments
We would like to thank all individuals who took part in the study. We are also grateful to the anonymous reviewers for their constructive and valuable comments.
Disclosure statement
No potential conflict of interest was reported by the author(s)
Additional information
Notes on contributors

Amanuel Kussia Guyalo
Amanuel Kussia Guyalo is an assistant professor in the Department of Development Economics and Management at Ethiopian Civil Service University. He got his BA degree in Development Management from Ethiopian Civil Service University and his MA and Ph.D. in Development Studies from Addis Ababa University. He has more than twenty years of experience in development work, teaching, and research. His research interests include the analysis of agricultural investment, food security, poverty, livelihoods, sustainable development, cooperatives, micro and small enterprises, and women’s empowerment. His manuscripts have been published in some of the reputable international and national academic journals, such as the International Journal of Social Economics, the Journal of Agriculture and Food Security, the Eastern Africa Social Science Research Review, and the Ethiopian Journal of Development Research.
Lensa Tekalign Ifa
Lensa Tekalign Ifa received her Master’s Degree in Development Economics from Ethiopian Civil Service University and her Bachelor of Science in Statistics from Wollo University. She is currently working as development planning expert at the Ethiopian Civil Service University. Her areas of research interest are agriculture and food security.
Notes
1. Belg is one of the three seasons in Ethiopia which is characterized by (brief) rains that begin in mid-February and last in mid-May, with intermittent dry spells in between.
2. Conversion factors proposed by Storck (1991) to calculate Tropical Livestock Unit (TLU) in Ethiopian context was used to standardize the measurement of livestock. TLU is computed as (1 * the number of cow) + (1 * the number of ox) + (0.75 * the number of heifer) + (0.75 * the number of bull) + (0.2 * the number of calf) + (0.13 * the number of sheep) + (0.13 * the number of goat) + (0.013 * the number of Poultry), other animals (such as camel, horse, and donkey) that are not found in the study are excluded from the calculation.
References
- Abate, G. T., Francesconi, G. N., & Getnet, K. (2014). Impact of agricultural cooperatives on smallholders’ technical efficiency: Empirical evidence from Ethiopia. Annals of Public & Cooperative Economics, 85(2), 257–35. https://doi.org/10.1111/apce.12035
- Abdul-Rahaman, A., & Abdulai, A. (2018). Do farmer groups impact on farm yield and efficiency of smallholder farmers? Evidence from rice farmers in northern Ghana. Food Policy, 81, 95–105. https://doi.org/10.1016/j.foodpol.2018.10.007
- Abebaw, D., & Haile, M. G. (2013). The impact of cooperatives on agricultural technology adoption: Empirical evidence from Ethiopia. Food Policy, 38, 82–91. https://doi.org/10.1016/j.foodpol.2012.10.003
- Adjin, K. C., Goundan, A., Henning, C. H. C. A., & Sarr, S. (2020). Estimating the impact of agricultural cooperatives in Senegal: Propensity score matching and endogenous switching regression analysis (No. WP2020-10). University of Kiel, Department of Agricultural Economics. http://hdl.handle.net/10419/235900
- Ahmed, M. H., & Mesfin, H. M. (2017). The impact of agricultural cooperatives membership on the wellbeing of smallholder farmers: Empirical evidence from eastern Ethiopia. Agricultural and Food Economics, 5(1), 6. https://doi.org/10.1186/s40100-017-0075-z
- Alem, Y., & Söderbom, M. (2012). Household-level consumption in urban Ethiopia: The effects of a large food price shock. World Development, 40(1), 146–162. https://doi.org/10.1016/j.worlddev.2011.04.020
- Arayesh, B. (2011). Identifying the factors affecting the participation of agricultural cooperatives’ members. American Journal of Agricultural and Biological Sciences, 6(4), 560–566. https://doi.org/10.3844/ajabssp.2011.560.566
- Asfaw, S., Shiferaw, B., Simtowe, F., & Lipper, L. (2012). Impact of modern agricultural technologies on smallholder welfare: Evidence from Tanzania and Ethiopia. Food Policy, 37(3), 283–295. https://doi.org/10.1016/j.foodpol.2012.02.013
- Assefa, B. (2013). Contribution of agricultural cooperatives to food security and rural development in Ethiopia: A case study of a cooperative at sire district, Arsi zone, Oromia national regional state. Indira Gandhi National Open University.
- Austin, P. C. (2011). An introduction to propensity score methods for reducing the effects of confounding in observational studies. Multivariate Behavioral Research, 46(3), 399–424. https://doi.org/10.1080/00273171.2011.568786
- Bacon, C. M. (2010). A Spot of coffee in crisis: Nicaraguan smallholder cooperatives, fair trade networks, and gendered empowerment. Latin American Perspectives, 37(2), 50–71. https://doi.org/10.1177/0094582X09356958
- Baden, S., & Pionetti, C. (2011). Women’s collective action in agricultural markets: Synthesis of preliminary findings from Ethiopia, Mali, and Tanzania. Oxfam UK. https://policy-practice.oxfam.org/resources/womens-collective-action-in-agricultural-markets-synthesis-of-preliminary-findi-245931/
- Banerjee, A. V., Besley, T., & Guinnane, T. W. (1994). Thy neighbor’s keeper: The design of a credit cooperative with theory and a test. The Quarterly Journal of Economics, 109(2), 491–515. https://doi.org/10.2307/2118471
- Berdegué, J. A. (2001). Cooperating to compete: Associative peasant business firms in Chile [Unpublished master’s thesis]. Wageningen University.
- Bernard, T., Gashaw, T. A., & Lemma, S. (2013). Agricultural cooperatives in Ethiopia: Results of the 2012 ATA Baseline Survey. International Food Policy Research Institute. https://doi.org/10.13140/RG.2.1.4326.2325
- Bernard, T., & Spielman, D. J. (2009). Reaching the rural poor through rural producer organizations? A study of agricultural marketing cooperatives in Ethiopia. Food Policy, 34(1), 60–69. https://doi.org/10.1016/j.foodpol.2008.08.001
- Bernard, T., Spielman, D. J., Tafesse, A. S., & Gebre_madhin, E. (2010). Cooperatives for staple crop marketing:Evidence from Ethiopia. International Food Policy Research Institute. https://doi.org/10.2499/9780896291751RR164
- Bernard, T., Taffesse, A. S., & Gabre-Madhin, E. (2008). Impact of cooperatives on smallholders’ commercialization behavior: Evidence from Ethiopia. Agricultural Economics, 39(2), 147–161. https://doi.org/10.1111/j.1574-0862.2008.00324.x
- Bocher, T. F., Alemu, B. A., & Kelbore, Z. G. (2017). Does access to credit improve household welfare? Evidence from Ethiopia using endogenous regime switching regression. African Journal of Economic and Management Studies, 8(1), 51–65. https://doi.org/10.1108/AJEMS-03-2017-145
- Caliendo, M., & Kopeinig, S. (2008). Some practical guidance for the implementation of propensity score matching. Journal of Economic Surveys, 22(1), 31–72. https://doi.org/10.1111/j.1467-6419.2007.00527.x
- Chen, M., Jhabvala, R., Kanbur, R., & Richards, C. (2007). Membership based organizations of the poor (0 ed.). Routledge. https://doi.org/10.4324/9780203934074
- Coase, R. H. (1937). The nature of the firm. Economica, 4(16), 386–405. https://doi.org/10.1111/j.1468-0335.1937.tb00002.x
- Coates, J., Swindale, A., & Bilinsky, P. (2007). Household Food Insecurity Access Scale (HFIAS) for measurement of food access: Indicator guide (no. 3). Food and Nutrition Technical Assistance Project (FANTA).
- Cook, M. L. (1995). The future of U.S. agricultural cooperatives: A neo‐institutional approach. American Journal of Agricultural Economics, 77(5), 1153–1159. https://doi.org/10.2307/1243338
- Debela, M., Diriba, S., & Bekele, H. (2018). Impact of cooperatives membership on economy in Eastern Oromia: The case of Haramaya Agricultural Farmers’ Cooperative Union (Hafcu). Annals of Public & Cooperative Economics, 89(2), 361–376. https://doi.org/10.1111/apce.12175
- Degefa, T. (1996). Belg crop production as a strategy of households’ food security: A comparative study of belg grower and non belg grower farmers in Munessa woreda, Arssi region. Addid Ababa University.
- Degefa, T. (2002). Household seasonal food insecurity in Oromiya Zone. Causes. https://library.au.int/household-seasonal-food-insecurity-oromiya-zones-ethiopia-causes-3
- Dercon, S., & Krishnan, P. (1998). Changes in poverty in rural Ethiopia 1989-1995: Measurement, robustness tests and decomposition. University of Oxford, Centre for the Study of African Economies, Institute of Economics and Statistics.
- Dung, L. T. (2020). A multinomial logit model analysis of farmers’ participation in agricultural cooperatives: Evidence from Vietnam. Applied Economics Journal, 27(1), 1–22.
- Emana, B. (2009). Cooperatives: A path to economic and social empowerment in Ethiopia. International Labour Organization.
- FAO. (2003). Food energy – methods of analysis and conversion factors. FAO Food and Nutrition Paper 77, finalenergyconversionreport.pdf (fao.org)
- FAO. (2012a). Agricultural Cooperative: Key to Feeding the World. https://www.fao.org/3/az877e/az877e.pdf
- FAO. (2012b). Youth: The future of agricultural cooperatives. https://www.fao.org/3/ap668e/ap668e.pdf
- Federal Cooperative Agency. (2006). Five year development plan, report. Federal Cooperative Agency.
- Fehr, E., & Gächter, S. (1999). Cooperation and punishment in public goods experiments. SSRN Electronic Journal. https://doi.org/10.2139/ssrn.203194
- Francesconi, G. N., & Heerink, N. (2011). Ethiopian agricultural cooperatives in an era of global commodity exchange: Does Organisational Form Matter? Journal of African Economies, 20(1), 153–177. https://doi.org/10.1093/jae/ejq036
- Gertler, M. E. (2004). Synergy and strategic advantage: cooperatives and sustainable development. Journal of Cooperatives. https://doi.org/10.22004/AG.ECON.46430
- Getnet, K., & Anullo, T. (2012). Agricultural cooperatives and rural livelihoods: Evidence from Ethiopia: Agricultural cooperatives and rural livelihoods. Annals of Public & Cooperative Economics, 83(2), 181–198. https://doi.org/10.1111/j.1467-8292.2012.00460.x
- Greene, W. H. (2008). Econometric analysis (6th ed.). Pearson, Prentice Hall.
- Gyau, A., Mbugua, M., & Oduol, J. (2016). Determinants of participation and intensity of participation in collective action: Evidence from smallholder avocado farmers in Kenya. Journal on Chain and Network Science, 16(2), 147–156. https://doi.org/10.3920/JCNS2015.0011
- Hagos, K., Tesfaye, L., & Girmay, T. (2018). Determinants of smallholder farmers participation in seed producing cooperatives in Southern Zone of Tigray, Ethiopia. Journal of Agricultural Extension & Rural Development, 10(4), 75–83. https://doi.org/10.5897/JAERD2017.0868
- Halu woreda Finance and Economic Development Office (FEDO). (2018). Socio-economic profile of the district, the 2017 and 2018 fiscal years. Unpublished Document.
- Heckman, J. J., Lalonde, R. J., & Smith, J. A. (1999). The economics and econometrics of active labor market programs. In Handbook of Labor Economics (Vol. 3, pp. 1865–2097). Elsevier. https://doi.org/10.1016/S1573-4463(99)03012-6
- Hicks, A., & Kenworthy, L. (1998). Cooperation and political economic performance in affluent democratic capitalism. American Journal of Sociology, 103(6), 1631–1672. https://doi.org/10.1086/231403
- Hirano, K., Imbens, G. W., & Ridder, G. (2003). Efficient estimation of average treatment effects using the estimated propensity score. Econometrica, 71(4), 1161–1189. https://doi.org/10.1111/1468-0262.00442
- Iacus, S. M., King, G., & Porro, G. (2012). Causal inference without balance checking: Coarsened exact matching. Political Analysis, 20(1), 1–24. https://doi.org/10.1093/pan/mpr013
- Imbens, G. (2003). Nonparametric estimation of average treatment effects under exogeneity: A review (No. t0294; p. t0294). National Bureau of Economic Research. https://doi.org/10.3386/t0294
- The International Co-operative Alliance & The International Labour Organization. (2014). Cooperatives and the sustainable development goals: A contribution to the post-2015 development debate. ICA & ILO. https://www.ilo.org/global/topics/cooperatives/publications/WCMS_306072/lang–en/index.htm
- Ito, J., Bao, Z., & Su, Q. (2012). Distributional effects of agricultural cooperatives in China: Exclusion of smallholders and potential gains on participation. Food Policy, 37(6), 700–709. https://doi.org/10.1016/j.foodpol.2012.07.009
- Jackson, T., & Marks, N. (1999). Consumption, sustainable welfare and human needs—With reference to UK expenditure patterns between 1954 and 1994. Ecological Economics, 28(3), 421–441. https://doi.org/10.1016/S0921-8009(98)00108-6
- Jelliffe, J., Bravo-Ureta, B., Deom, C., & Okello, D. (2018). Adoption of high-yielding groundnut varieties: The sustainability of a farmer-led multiplication-dissemination program in eastern Uganda. Sustainability, 10(5), 1597. https://doi.org/10.3390/su10051597
- Kaaria, S., Osorio, M., Wagner, S., Gallina, A., Kaaria, S., Osorio, M., Wagner, S., & Gallina, A. (2016). Rural women’s participation in producer organizations: An analysis of the barriers that women face and strategies to foster equitable and effective participation. Journal of Gender, Agriculture and Food Security, 1(2), 148–167. https://doi.org/10.22004/AG.ECON.246035
- Karlı, B., Bilgiç, A., & Çelik, Y. (2006). Factors affecting farmers’ decision to enter agricultural cooperatives using random utility model in the south eastern Anatolian region of Turkey. Journal of Agriculture and Rural Development in the Tropics and Subtropics, 107(2), 115–127.
- King, K., & McGrath, S. (2002). Globalisation, enterprise and knowledge: Education, training and development in Africa. Symposium Books. https://doi.org/10.15730/books.33
- Kothari, C. R. (2004). Research methodology: Methods & techniques (2nd ed.). New Age International (P) Ltd.
- Kumar, A., Saroj, S., & Mishra, A. K. (2021). Crop insurance and crop productivity evidence from rice farmers in Eastern India (Discussion Paper No. 01996). International Food Policy Research Institute (IFPRI). https://papers.ssrn.com/sol3/papers.cfm?abstract_id=3771268
- Lemessa, D. (1999). Prosperity Fades: Jimma and illubabor zones of Oromia Region. UNDP Emergencies Unit for Ethiopia.
- Lokshin, M., & Sajaia, Z. (2004). Maximum likelihood estimation of endogenous switching regression models. The Stata Journal: Promoting Communications on Statistics and Stata, 4(3), 282–289. https://doi.org/10.1177/1536867X0400400306
- Ma, W., & Abdulai, A. (2019). IPM adoption, cooperative membership and farm economic performance: Insight from apple farmers in China. China Agricultural Economic Review, 11(2), 218–236. https://doi.org/10.1108/CAER-12-2017-0251
- Maddala, G. S. (1983). Limited-dependent and qualitative variables in econometrics. Cambridge University Press. https://doi.org/10.1017/CBO9780511810176
- Manning, S., Boons, F., Von Hagen, O., & Reinecke, J. (2012). National contexts matter: The co-evolution of sustainability standards in global value chains. Ecological Economics, 83, 197–209. https://doi.org/10.1016/j.ecolecon.2011.08.029
- Mesay, M. (2001). Study on rural households food security of Kuyu Woreda, Oromia regional state. Addid Ababa University.
- Mishra, A. K., Kumar, A., Joshi, P. K., & D’Souza, A. (2018). Cooperatives, contract farming, and farm size: The case of tomato producers in Nepal. Agribusiness, 34(4), 865–886. https://doi.org/10.1002/agr.21563
- Mogues, T., Cohen, M. J., Birner, R., Lemma, M., Randriamamonjy, J., Tadesse, F., & Paulos, Z. (2009). Agricultural extension in Ethiopia through a gender and governance lens. International Food Policy Research Institute. https://doi.org/10.13140/RG.2.1.2565.2728
- Mojo, D., Fischer, C., & Degefa, T. (2017). The determinants and economic impacts of membership in coffee farmer cooperatives: Recent evidence from rural Ethiopia. Journal of Rural Studies, 50, 84–94. https://doi.org/10.1016/j.jrurstud.2016.12.010
- Ngoma, H. (2018). Does minimum tillage improve the livelihood outcomes of smallholder farmers in Zambia? Food Security, 10(2), 381–396. https://doi.org/10.1007/s12571-018-0777-4
- Nilsson, J. (1996). The nature of cooperative values and principles: Transaction cost theoretical explanations. Annals of Public & Cooperative Economics, 67(4), 633–653. https://doi.org/10.1111/j.1467-8292.1996.tb01411.x
- Nkechi, O. C., & Onugu, C. U. (2015). Effects of membership of cooperative organisation and determinants of farmer-members’ income in Rural Anambra state, Nigeria. International Journal of Scientific and Technology Research, 4(8), 28–35.
- North, D. C. (1990). Institutions, institutional change and economic performance (1st ed.). Cambridge University Press. https://doi.org/10.1017/CBO9780511808678
- Nugusse, W., Van Huylenbroeck, G., & Buysse, J. (2013). Determinants of rural people to join cooperatives in Northern Ethiopia. International Journal of Social Economics, 40(12), 1094–1107. https://doi.org/10.1108/IJSE-07-2012-0138
- Olson, M. (1965). The logic of collective action: Public goods and the theory of groups (21. printing). Harvard Univ. Press.
- Österberg, P., & Nilsson, J. (2009). Members’ perception of their participation in the governance of cooperatives: The key to trust and commitment in agricultural cooperatives. Agribusiness, 25(2), 181–197. https://doi.org/10.1002/agr.20200
- Pereira, J. R. (2014). Producer cooperatives: A transaction cost economic approach. SSRN Electronic Journal. https://doi.org/10.2139/ssrn.2747355
- Poulton, C., Dorward, A., & Kydd, J. (2010). The future of small farms: New directions for services, institutions, and intermediation. World Development, 38(10), 1413–1428. https://doi.org/10.1016/j.worlddev.2009.06.009
- Quirin, C., & Dixon, A. (2012). Food security, politics and perceptions of wildlife damage in Western Ethiopia. International Journal of Pest Management, 58(2), 101–114. https://doi.org/10.1080/09670874.2012.667583
- Richards, T. J., Klein, K. K., Walburger, A. M., Richards, T. J., Klein, K. K., & Walburger, A. M. (1998). Principal-agent relationships in agricultural cooperatives: An empirical analysis from rural alberta. Journal of Cooperatives. https://doi.org/10.22004/AG.ECON.46223
- Robins, J., Sued, M., Lei-Gomez, Q., & Rotnitzky, A. (2007). Comment: Performance of double-robust estimators when “inverse probability” weights are highly variable. Statistical Science, 22(4). https://doi.org/10.1214/07-STS227D
- Rondot, P., & Marie-Helene, C. (2001). Agricultural producer organizations: Their contribution to rural capacity building and poverty reduction. World Bank. https://documents1.worldbank.org/curated/en/111471468740104722/pdf/multi0page.pdf
- Rosenbaum, P. R. (2002). Observational studies. Springer New York. https://doi.org/10.1007/978-1-4757-3692-2_1
- Rosenbaum, P. R., & Rubin, D. B. (1983). The central role of the propensity score in observational studies for causal effects. Biometrika, 70(1), 41–55. https://doi.org/10.1093/biomet/70.1.41
- Sexton, R., & Iskow, J. (1988). Factors critical to the success or failures of emerging agricultural cooperatives (No. 88–3; Giannini Foundation Information Series). University of California – Davis. https://core.ac.uk/download/pdf/7001537.pdf
- Spear, R. (2000). The co-operative advantage. Annals of Public & Cooperative Economics, 71(4), 507–523. https://doi.org/10.1111/1467-8292.00151
- Verhofstadt, E., & Maertens, M. (2014). Smallholder cooperatives and agricultural performance in Rwanda: Do organizational differences matter? Agricultural Economics, 45(S1), 39–52. https://doi.org/10.1111/agec.12128
- Weinberger, K., & Jütting, J. P. (2001). Women’s participation in local organizations: Conditions and constraints. World Development, 29(8), 1391–1404. https://doi.org/10.1016/S0305-750X(01)00049-3
- Williamson, O. E. (1971). The vertical integration of production: Market failure considerations. American Economic Review, American Economic Association, 61(2), 112–123. http://www.jstor.org/stable/1816983
- Williamson, O. E. (1975). Markets and hierarchies, analysis and antitrust implications: A study in the economics of internal organization. Free Press.
- Williamson, O. E. (1981). The economics of organization: The transaction cost approach. American Journal of Sociology, 87(3), 548–577. https://doi.org/10.1086/227496
- Woldu, T., Tadesse, F., & Waller, M.-K. (2015). Women’s participation in agricultural cooperatives in Ethiopia. Proceedings of the International Conference of Agricultural Economists, Milan, Italy. International Association of Agricultural Economists (IAAE). https://doi.org/10.22004/AG.ECON.210967
- Wooldridge, J. M. (2007). Inverse probability weighted estimation for general missing data problems. Journal of Econometrics, 141(2), 1281–1301. https://doi.org/10.1016/j.jeconom.2007.02.002
- Wooldridge, J. M. (2010). Econometric analysis of cross section and panel data (2nd ed.). MIT Press.
- World Bank. (2008). World development report 2008: Agriculture for development, the role of cooperatives. The World Bank.
- Wossen, T., Abdoulaye, T., Alene, A., Haile, M. G., Feleke, S., Olanrewaju, A., & Manyong, V. (2017). Impacts of extension access and cooperative membership on technology adoption and household welfare. Journal of Rural Studies, 54, 223–233. https://doi.org/10.1016/j.jrurstud.2017.06.022
- Zeweld, W., Van Huylenbroeck, G., & Buysse, J. (2015). Household food security through cooperative societies in northern Ethiopia. International Journal of Development Issues, 14(1), 60–72. https://doi.org/10.1108/IJDI-02-2014-0014
Appendix
Table A1. ESR estimation of HFBM
Table A2. ESR estimation of HFIAS
Table A3. Propensity score matching quality test
Table A4. Results of covariate balance for inverse-probability weights matching
Table A5. Results of covariate balance check for coarsened exact matching
Table A6. ATT of AC membership: PSM, IPW, and CEM estimates
Table A7. ATT, ATU and heterogeneity effect