
 ?Mathematical formulae have been encoded as MathML and are displayed in this HTML version using MathJax in order to improve their display. Uncheck the box to turn MathJax off. This feature requires Javascript. Click on a formula to zoom.
Abstract
The Russia-Ukraine military conflict, commencing on February 24, 2022, notably impacted the international community. This study aims to quantify the volatility engendered by the conflict, drawing from the analysis of stock market indices across 40 countries. Time-series returns data from January 1 to December 31, 2022, were examined utilizing EGARCH econometric models. The relationship between volatility and news regarding the conflict was analyzed through a vector autoregression model, and associations between variables were examined using the Granger causality test. Findings suggest that some markets proximate to Ukraine, notably in Hungary, Polassnd Poland, Serbia, Bosnia and Herzegovina, and the Czech Republic, reacted in anticipation of the conflict, days prior to February 24. Remote markets experienced comparatively lower volatility, along with the primary stock markets. Additionally, a decline in volatility was observed as war-related information became available. Notably, the period between March 2 and March 16, 2022, recorded the highest volatility in 21 countries. Conversely, the value markets of the US, China, Japan, the UK, and Germany navigated the analyzed period with lower volatilities. These results demonstrate that conflict shocks influence stock markets globally. The implications of these findings are significant for investors, decision-makers, portfolio managers, investment funds, and central banks.
1. Introduction
The conflict between Russia and Ukraine began on 24 February 2022 (Neely, Citation2022) and has strongly impacted global markets. Major military actions; the blocking of Ukrainian export flows; sanctions imposed on Russia by international organizations, countries, and private companies; and the limitation of Russia’s exports were the main determinants of imbalances on a global scale (Ihle et al., Citation2022). This instability is a result of the fact that both countries export large amounts of food, energy, metals, and minerals (https://data.worldbank.org).
The analysis period enabled the identification of significant moments after the beginning of the military conflict. Russia recognized the independence of the two Ukrainian states on 21 February 2022. This situation received a strong, unfavorable reaction (Ahmed et al., Citation2022). Early signs of the impending invasion appeared in late October 2021, when Russian troops started maneuvering unusually close to the Ukrainian border. The Russian president recognized the Lugansk and Donetsk People’s Republics and directed troops into Ukrainian rebel areas on 21 February 2022. The following day, the president of the United States (US) announced that Russia had invaded Ukraine. On the same day, sanctions on Russia were imposed by the US, the United Kingdom, the European Union, Canada, Australia, Japan, and other nations. On 23 February 2022, the president of Russia officially announced “special military operations” occurring in eastern Ukraine. The Russian military invaded Ukraine on a large scale on February 24, with attacks coordinated in four directions. On the same day, the president of Ukraine deployed the armed forces and imposed a travel ban on all males between the ages of 18 and 60 (Neely, Citation2022).
The Russia—Ukraine conflict has detrimentally impacted stock markets through monetary, financial, and political channels. As a prominent supplier of natural gas and crude oil via pipelines crisscrossing Europe, Russia’s crisis reverberated throughout its European trading partners. Russia and Ukraine are also key sources of food, raw materials, and fertilizers for European nations. The increased geopolitical danger in the Euro region negatively impacted share prices, raised investor uncertainty, and reduced corporate confidence (Caldara & Iacoviello, Citation2022).
Research into war-induced events and their ramifications are underrepresented within the realm of extreme negative events negative events (Kumari et al., Citation2023). The uncertainty and paucity of reliable information concerning the duration, scope, and impacts of the war limit research. Studies on major military conflicts were identified through relevant research portals. Bradford and Robison (Citation1997), measured the impact of the Iraqi invasion of Kuwait on financial markets. Fernandez (Citation2008) also investigated the Iraqi invasion and how it affected financial markets worldwide. Choudhry (Citation2010) investigated how significant World War II events affected structural changes in the dynamics of the Dow Jones Industrial Average, using daily data from January 1939 to December 1945. Hudson and Urquhart (Citation2015) highlighted the negative effects of the World War II on the British stock market. These findings demonstrate that significant wartime events precipitate price changes and market volatility structural disruptions.
The literature on volatility experienced substantial growth during the COVID-19 pandemic, with researchers endeavoring the determinants of financial market volatility. To assess volatility during the pandemic, researchers employed various approaches such as: breakpoint analysis (Pandey & Kumari, Citation2021), level of markets’ information efficiency (Zhang & Mao, Citation2022), contagion effect (Akhtaruzzaman, Benkraiem, et al., Citation2022; Yousaf, Citation2021; Yousaf et al., Citation2022b), safe heaven assets (Akhtaruzzaman et al., Citation2021; Ali et al., Citation2022; Corbet et al., Citation2020) and others. Some research during the pandemic considered the effect of news on stock market volatility (Akhtaruzzaman, Benkraiem, et al., Citation2022; Yousaf et al., Citation2022a). Several researchers used Google Trends search data as a proxy for COVID-19 related uncertainty (Del Deb, Citation2023; Lo et al., Citation2022; Mezghani et al., Citation2021; Szczygielski et al., Citation2021). Despite these significant advances, the pathways, direction, and amplitude of volatility cannot be definitively determined.
Through a comprehensive review of the literature, we incorporated several studies that examined various facets of war-induced stock market shifts. Ha (Citation2023) studied the volatility of several markets between January 2018 and April 2022, while Adekoya et al. (Citation2023) focused on key oil and stock markets in their analysis. Similarly, Yousaf et al. (Citation2022b) conducted an applicable study, evaluating abnormal returns of the G20 nations before and after 24 February 2022. Lo et al. (Citation2022) provided the most comprehensive study, encompassing 73 countries, and examined asset prices and volatility triggered by the Russian-Ukrainian war. Fang and Shao (Citation2022) and Khalfaoui et al. (Citation2023) conducted studies on cryptocurrency dynamics following the inception of military operations in Ukraine.
Boubaker et al. (Citation2022) showed that invasion generated negative abnormal returns for MSCI indices. Notably, existing studies on volatility have primarily focused on developed states or have encompassed brief timeframes—ranging from several days to weeks—following the conflict’s onset. In contrast, our analysis extends over a longer period, facilitating a comprehensive evaluation of volatility dynamics. Furthermore, our analysis incorporates 40 countries across various continents, enabling us to capture the transference of volatility over different geographical distances.
Our key findings reveal that some markets responded prior to February 24, with developed markets demonstrating greater stability, slower and less pronounced reactions. Volatility was found to be contingent on the geographic proximity to the conflict zone, with markets at greater distances experiencing reduced volatility, and those closer showing increased volatility. Maximum volatility was recorded between March 2 and 16 March 2022. We also noted a decline in volatility as war-related information surfaced. These outcomes underscore the influence of conflict shocks on global stock markets and identify the least and most affected markets in terms of volatility. We also highlight a clustering tendency among the European states included in our study.
This study contributes to the existing literature in several ways. First, it analyzes the effects of the most significant post-World War II military events on stock markets. Second, it enables the establishment of volatility in countries neighboring Ukraine and Europe. Third, this analysis allows for determining the day each analyzed index reaches its maximum volatility. We complete the information related to the dynamics of stock markets by studying volatility. The large number of states considered in the analysis and the geographical arrangement of the states allow us to obtain a global picture of the impact of the ongoing military conflict.
The remainder of this study is organized as follows: The second section summarizes the literature on volatility caused by military events. The third section discusses the research approach, while the fourth section presents and elucidates the findings. The final section presents the results’ limitations and future research directions. Our motivation for this study stems from the necessity to assess the impact of the war between Russia and Ukraine on stock markets to provide users with relevant information.
Literature
The literature on volatility has grown, especially since the COVID-19 pandemic. Consequently, investors, companies, financial organizations, and authorities have developed novel tactics to manage the vulnerabilities, capabilities, and risks generated by capital market volatility. Researchers have created varied models to study market resilience regarding various shocks and managing related risks, such as military and political events (Ahmed et al., Citation2022). Recent studies demonstrating the direction, amplitude, and frequency of volatility generated by a large-scale military conflict are insufficient—possibly because a military conflict in Europe was unlikely until February 2022.
According to efficient market theory, the price of an asset is typically affected by all information regarding future supply or demand (Fama, Citation1970). The dispute between Russia and Ukraine had a definite starting point in 2014, intensifying and leading to a full-scale war. Financial markets should capitalize on the effects of future events, such as war. Considering that there were several months of warnings before the invasion of Ukraine, some researchers utilized this premise to drive their research (Ahmed et al., Citation2022).
Neely (Citation2022) aimed to determine how financial markets responded in the first week of the Russia—Ukraine war. The authors noted that trade and economic restrictions imposed by both sides or neutral parties anticipated real physical disturbances and impacted financial markets. Additionally, the reactions of global academic stakeholders differed (Nazarovets & Teixeira da Silva, Citation2022). Russian recognition of the two Ukrainian states as autonomous territories on 21 February 2022, caused substantial negative anomalous returns among European stocks (Ahmed et al., Citation2022). The authors recommended a thorough examination of how the global stock market crisis affected European stocks—a component that has been considered and developed in the current work. Abbassi et al. (Citation2023) examined the impact of the Russia-Ukraine conflict on the firms that make up the main stock indices in the G7 countries. Similarly, Pandey and Kumar (Citation2023) assessed the consequences of the war’s impact on the global tourism sector. Additionally, Singh et al. (Citation2022), using the Diebold and Yilmaz model, demonstrated that the conflict led to a change in investor preferences towards energy, defence, and the aerospace sector.
Several researchers selected geopolitical risk events (GPR) as the direction of analysis to determine the effect of the Russia—Ukraine conflict on financial markets. Political risk and the level of uncertainty in financial markets are believed to be related. Existing models, both older and recent, allow for such approaches. One example is the Economic Policy Uncertainty (EPU) Index, created by Baker et al. (Citation2016). Additionally, Mansour-Ichrakieh and Zeaiter (Citation2019) constructed a financial stress index to demonstrate the influence of GPR in Saudi Arabia and Russia on financial stress in Turkey. Salisu et al. (Citation2022) revealed a correlation between the GPR and the BRICS exchange rate volatility using the GARCH-MIDAS-X model. Su et al. (Citation2019) used wavelets to demonstrate the relationships among geopolitical risk, oil prices, and liquidity in Saudi Arabia. J. Huang et al. (Citation2021), using the DCC-MV-GARCH model, investigated the nonlinear relationship between the oil market and GPR. X. Chen (Citation2022) examined the impact of GPR, the CBOE Volatility Index (VIX), and EPU on Brent oil prices and stock indices in G7 nations, using data from December 1997 to April 2021. The author concluded that the EPU, VIX, and GPR have varying degrees of influence—depending on the investment horizon—with VIX being the most influential uncertainty index, followed by the EPU and GPR. Using an ARDL model, Ugurlu-Yildirim and Ordu-Akkaya (Citation2022) measured the influence of GPR on the economies of 15 emerging markets, over a relevant period, from 1985 to 2021. Long and Guo (Citation2022) conducted an analysis on stock volatility’s effects on five infectious diseases and the GPR on five commodity categories (textiles, industry, metals, livestock, and food) over the period 1998 to 2021. The authors noted that the use of GPR, regardless of the chosen index or model, is subjective owing to the distinct nature of disruptive events.
A large number of countries imposed sanctions and limitations on Russia as a result of the crisis. The US originally announced sanctions on February 22 to restrict Russia’s access to financial resources. The European Council unveiled a set of sanctions on February 23. On February 24, European leaders decided to censure Russia in the banking, energy, and transportation sectors. Moreover, they decided to impose limits on some products, implement export controls, and tighten visa requirements (Ihle et al., Citation2022). In contrast to prior wars, the Russia—Ukraine conflict has hampered the world’s supply systems. This crisis has decreased the supply of these items because combatant governments are important producers of food, metals, oil, and gas. Furthermore, the global supply chain has been interrupted, increasing costs because of the embargo on Russian exports and Russia’s unwillingness to permit international goods to pass through its skies and waterways.
Ha (Citation2023) studied the volatility of several markets using the TPV—VAR model. The analysis was conducted from January 2018 to April 2022. The authors found that war shocks influenced dynamic connectivity at a global level. The findings indicate that the system’s propagation shocks appear to be transmitted predominantly through the oil and gold markets. Adekoya et al. (Citation2023) examined the relationship between oil prices and important share prices before and during the Russia—Ukraine war. The authors claim that the effects of conflict differ between the oil and stock markets. A different orientation has been reported by Umar et al. (Citation2022). The authors examined how the Russia—Ukraine conflict affected markets for metals, conventional energy, and alternative energy sources. Their findings revealed a considerable increase in abnormal returns in Europe’s renewable energy sector.
Lo et al. (Citation2022) used a group of 73 countries to examine the Russia—Ukraine conflict’s influence. War shocks significantly impacted financial markets; however, asset values fared better than volatility. Yousaf, et al. (Citation2022a) evaluated the Russia—Ukraine crisis’ impact on the G20 nations and other stock markets. An analysis of abnormal returns before and after 24 February 2022, revealed that most stock markets, particularly that of Russia, were significantly affected by this military action. According to a country-level analysis, the stock markets in Russia, Hungary, Slovakia, and Poland were the first to decline in the days before the military action in Ukraine, whereas those in Australia, Germany, France, Italy, Spain, Romania, Turkey, Japan, Korea, India, and South Africa supported losses in the days after the invasion (Yousaf et al., Citation2022a). Bougias et al. (Citation2022) tracked the development of the asset worth of European companies during the Russia—Ukraine war. They discovered that conflict increased asset volatility and reduced corporate security costs. Reviewing the literature shows that no previous study has evaluated the global consequences of aggression on market volatility. We test global volatility’s magnitude and propagation direction to fill this gap.
The expansion of online social networks has allowed interested individuals to access large volumes of publicly available information (Engelberg & Parsons, Citation2011). The literature indicates that news affects how quickly stock market volatility spreads (Baek & Lee, Citation2021; Jiang et al., Citation2012; Lai et al., Citation2022). According to previous research, social networks have a greater impact on correlation than news, which has more pronounced implications for the persistence of volatility (Alomari et al., Citation2021). We considered the results of these studies when selecting an econometric model. As military events continue, determining their economic and financial consequences becomes impossible. The duration of the conflict and its political, economic, and financial implications remain uncertain. The number of victims (injured and dead) among Ukrainian civilians continues to increase (UNHCR Global Appeal Citation2022, Citation2022).
Recently, several researchers have focused on the COVID-19 pandemic. Across all continents, stock market activity decreased because of the virus’s extraordinary global spread. The dynamics of stock markets over an extremely short period manifest high volatility, an aspect that indicates their degree of vulnerability to major negative events (Chahuan-Jiménez et al., Citation2021; De Souza & Silva, Citation2020; Youssef et al., Citation2021; Yu et al., Citation2021). Our review of the studies conducted during the COVID-19 pandemic reveals that volatility was driven by news about the number of deaths and illnesses (Chahuan-Jiménez et al., Citation2021; De Souza & Silva, Citation2020; Yu et al., Citation2021). Following these studies, we sought an extension adapted to military conflicts. We attempted to identify the number of people dead and wounded owing to the Russia—Ukraine conflict. To this end, we consulted the official websites of UNICEF (https://www.unicef.org), United Nations (https://www.un.org), Office of the High Commissioner of the United Nations for Human Rights (https://www.ohchr.org), United Nations High Commissioner of Refugees Global Appeal, (Citation2022) (2022) (https://www.unhcr.org), European Union (https://european-union.europa.eu), Organization for Economic Cooperation and Development (https://www.oecd.org), International Monetary Fund (Citation2022) (https://www.imf.org), World Bank (Citation2022) (https://www.worldbank.org), North Atlantic Treaty Organization (https://www.nato.int), and Eurostat (https://ec.europa.eu/eurostat), as well as other private sites (https://www.statista.com). We identified partial data on some sites or databases, but eventually deemed it insufficient for accurate analysis.
The Google Search Volume Index was used without this information (https://trends.google.com/trends/). Different researchers have used similar solutions in recent years to explore various financial aspects, including herd behavior in international equity markets (Wanidwaranan & Padungsaksawasdi, Citation2022), returns and trading volumes of stocks (Lai et al., Citation2022), the index for EPU (Kupfer & Zorn, Citation2020), retail investor attention and herding behavior (Hsieh et al., Citation2020), stock prices and trading volume (Wu et al., Citation2022), fund movements, future results, and longevity of newly-released funds (H.-Y. Chen et al., Citation2021), links between market characteristics and investor attentiveness (Tantaopas et al., Citation2016), predictive capabilities of internet search data (Y. M. Huang et al., Citation2020), investor interest in financial markets and web search activity (H.-Y. Chen & Lo, Citation2019), investor attention affecting stock returns (Akarsu & Süer, Citation2022; Swamy et al., Citation2019), as well as returns, their volatility and traded volumes (Moussa et al., Citation2017; Perlin et al., Citation2017).
2. Data
To identify the impact of the Russia-Ukraine conflict on a global scale, we selected 40 countries located on different continents to ensure a diverse and comprehensive perspective. The criterion for market selection was their representativeness, with a higher proportion of European markets chosen owing to the greater impact of the war on them (Deng et al., Citation2022). The most representative stock market index for each country was chosen, based on capitalization and volume, with the selected indices being comparable owing to their identical starting points on a standardized scale. A comprehensive time series was compiled for each chosen stock index, comprising daily data from 1 January 2022, to 30 December 2022, sourced from the Bloomberg platform (https://www.bloomberg.com/europe). Table lists the countries considered and the stock indices analyzed. Statistical data were processed using the EViews 13 software (Quantitative Micro Software, USA).
Table 1. Stock market indices
The following formula is used to determine the weekly index return (Ri,t) and weekly volatility (σi,t), using daily closing index prices:
where IndexMonday,t and IndexFriday,t are the closing stock market index prices on Monday and Friday, respectively, in week t.
Research on uncertain financial phenomena based on newspaper information has increased in recent years, as Nonejad (Citation2022) demonstrated. In 2006, Google Trends was designed to provide the Google Search Volume Index (GSVI). We selected Google because it has a dominant position worldwide compared to other similar service providers. According to the www.netmarketshare.com portal, Google holds the largest market share worldwide as a search engine. This algorithm reports the weekly search intensity for a particular search keyword. The GSVI was determined using the following equation (http://www.atlantis-press.com):
This index includes statistical information on keywords. Consequently, the search popularity of any keyword can be observed for any country over a certain period. The data collected from each user leaves a trail on Google Trends (https://trends.google.co.uk). Data were collected weekly, starting on Sundays. Therefore, we had to establish the weekly return and volatility of the indices using Relationship 1, though daily data were collected.
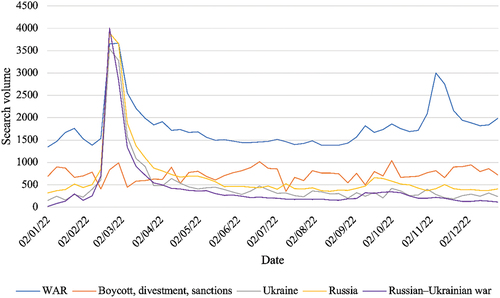
We employed search phrases in English because of several considerations. First, English is widely used by local and foreign investors. Google search algorithms prioritize English keywords over other languages, and most trading platforms use English (Anastasiou et al., Citation2022; Wanidwaranan & Padungsaksawasdi, Citation2022). The selection of appropriate search keywords is a subjective process. However, in this study, we carefully selected search keywords to ensure their relevance to the Russia-Ukraine conflict and their ability to provide valuable insights into the impact of the conflict on global markets. Among these, we retained the terms with the highest average search frequency on Google during the analyzed period, specifically, “war,” “boycott,” “disinvestment,” “sanctions,” “Ukraine,” “Russia,” and “The Russian—Ukrainian War.” The first search keyword was “war.” These terms were selected from a list of terms that Google Trends suggests are similar and have the highest number of searches. We determined the amount of news for each country and constructed a time series of equal length. Figure depicts the news items related to each keyword.
Figure 1. Dynamics of keywords during the analyzed period.
3. Methodology
We began our analysis by checking the stationarity of the time series created. To this end, we used the Augmented Dickey—Fuller unit root test (ADF), commonly employed in volatility research (Jiang et al., Citation2012; Youssef et al., Citation2021). The equation is as follows:
In this equation, α is a constant; β, the temporal trend coefficient; and p, the autoregressive process’ lag order. There is a unit root in the studied variable when the probability of the ADF test has a p-value >5%, while there is no unit root when the p-value is 5%. The ADF test findings indicate that the variables at the first-difference levels does not have a unit root.
The Granger test establishes causality between volatility and news (Hsieh et al., Citation2020; Poon & Granger, Citation2003; Tantaopas et al., Citation2016). We conducted pairwise Granger causality tests for each index return. As Tantaopas et al. (Citation2016) suggested, bidirectional causality is possible for test pairs across countries (Corbet et al., Citation2020; Fariska et al., Citation2021; Kumeka et al., Citation2022; Moslehpour et al., Citation2022).
Research aimed at determining the cause of this volatility is ongoing. A vector autoregression (VAR) model was applied to each country to underscore war news as the primary cause of volatility. Developed by Sims (Citation1980), this model allows the use of multivariate time series. In our case, VAR is a two-variable model, wherein each variable appears as a linear expression of its previous values in a two-equation model. The historical values of each variable were considered, along with a serially uncorrelated error term.
In these equations, variables δ1 and δ2 are free terms; β, ψ, φ, and γ are the coefficients; and ε1t and ε2t are white noise error terms (Kubiczek & Tuszkiewicz, Citation2022; Kumeka et al., Citation2022; Moslehpour et al., Citation2022; Zhang & Mao, Citation2022).
The bivariate VAR EquationEquation 5(5)
(5) contains the null hypothesis (
) (Rt is not a cause of GSVI) and the alternative hypothesis (
) (Rt causes GSVI).
The econometric model was selected and applied as follows: The ARCH model, first presented by Engle (Citation1982) and Bollerslev (Citation1986), and the GARCH model (Bollerslev, Citation1986) are frequently applied to time-series research (Sims, Citation1980). These models simultaneously test and evaluate returns and volatility, which are meaningful because of the distinction between conditional and unconditional variances. Conditional variances depend on historical events, while unconditional variances are time-independent.
In these equations, represents volatility comprising ARCH (q) and GARCH (p);
is a constant; the parameters
represent the persistence of volatility; the parameters
represent the reaction speed of volatility to market shocks; and
represents the residual terms. The following condition must be satisfied to obtain a stationary covariant process (Engle, Citation1982):
The coefficients have negative values in the exponential GARCH model (EGARCH). Moreover, negative shocks have a greater influence on volatility than positive shocks of the same size. Consequently, the model reflects both the leverage and asymmetric effects of volatility.
In this equation, when is positive, the total effect of
is
; and when
is negative, the total effect of
is
. Obtaining a negative value for
significantly impacts volatility, whereby the value for
would be negative.
4. Empirical results
4.1. Descriptive statistics
We examined the Russia—Ukraine crisis’ impact on global financial markets. Appendix 1 provides statistics for the series of logarithmic returns for the entire period. Information provided by the average, median, minimum, and maximum values indicates the value range of the indices during the study period. The skewness indicator is demonstrated as having values different from zero for all series considered asymmetric. A value of less than zero indicates that the conflict has negatively impacted the observed stock market indicators. The mean skewness is located to the left of the distribution peak. Therefore, the mean value is lower than the median value and shifts to the left. Positive skewness is found in the BIRS, FTSE 250, ICEX, NIKKEI, SP 500, and XU100 stock indices, which are skewed to the right. Generally, the right tail was longer than the left tail, and most values were concentrated around the left tail.
The kurtosis indicator presents the amplitudes of extreme values. Twenty-nine indices recorded a value greater than three, while the rest had values between two and three. This finding demonstrates that the index performance is leptokurtic, and that the data series has thicker tails than a normal distribution. The analyzed series has excess kurtosis, which indicates a high probability of recording extreme values. The highest values were recorded for RTS (+13.49), BIRS (+10.08), and OMX Riga (+8.59). During the same period, the lowest values recorded were BOVESPA (+2.21), OSEAX (+2.22), and PX (+2.28). There is a zonal grouping of expectations regarding extreme values owing to the interconnection of stock markets. The skewness of most indices is negative and close to zero, as presented in Appendix 1.
The Jarque-Bera test indicates how the variables are dispersed. At the 1% critical threshold, time-series normality was ruled out as a null hypothesis, and the test’s associated probability was zero. The values listed in Table were established using the following relationships:
Table 2. EGARCH results
In this equation, the sample size is n, sample skewness is S, and kurtosis is K (Jarque, Citation2011).
As presented in Appendix 1, the probability is zero for 19 of the indices analyzed, wherein the numerical values obtained are extremely dissimilar to those from the normal distribution. For indices that recorded values higher than 0.01 (AEX, BELEX 15, BOVESPA, FTSE 250, ICEX, JTOPI, MSCI, NIKKEI, OMX Copenhagen, OMX Stockholm, OMX Tallinn, OSEAX, PSI 20, PX, SBITOP, SHC, SMI, SP 500, STI, WIG20, and XU 100), the risk levels were lower, as the stock markets were more stable.
4.2. ADF results
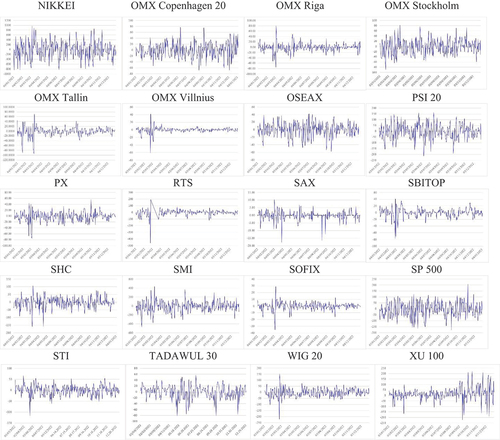
The stock indices’ stationarity was investigated using the ADF test. According to the findings, the null hypothesis of a unit root was rejected as the test value was less than the crucial value for any relevance level. At the 1%, 5%, and 10% levels, the weekly logarithmic returns were significant and comparable to those obtained by Youssef et al. (Citation2021) and Ugurlu-Yildirim and Ordu-Akkaya (Citation2022). The statistical findings of this study indicate that the characteristic polynomial roots have a modulus smaller than one, resulting in a stable equation (see Appendix 2). As a result, the series is stationary and does not follow stochastic processes. shows the daily returns for all series and demonstrates the stationarity of the series.
Figure 2. NIL.
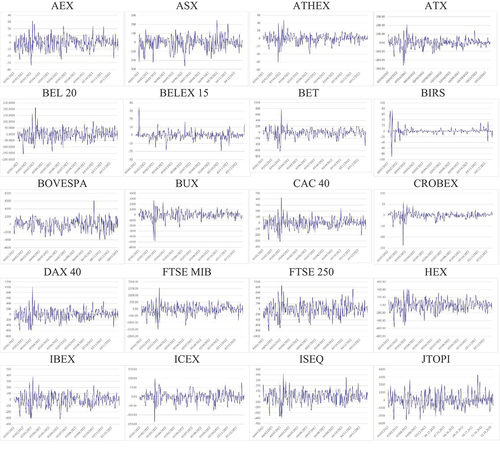
Figure 2. Daily index returns during the analyzed period.
4.3. Pairwise Granger causality
The causal connections among the variables were investigated using the Granger causality test. As presented in Appendix 3, there is unidirectional causality from news to the indices of the 21 countries analyzed. We identified six stock indices at a significance level of 5% (AEX, ATX, CROBEX, NIKKEI, PSI 20, and SMI) and 15 sat a significance level of 1% (BEL 20, BET, BUX, CAC 40, DAX 40, FTSE MIB, FTSE 250, HEX, IBEX, ISEQ, OMX Riga, OMX Stockholm, OMX Vilnius, RTS, and SOFIX). Although not long-lasting, this revealed a causal association between the GSVI and stock index volatility. No unidirectional or bidirectional causal relationship exists between the indices and news, confirming the results of Kropiński and Anholcer (Citation2022). For return volatility and GSVI, the remaining indices (AOR, ATHEX, BELEX 15, BIRS, BOVESPA, ICEX, JTOPI, MSCI, OMXC 20, OMX Tallinn, OSEAX, PX, SAX, SBITOP, SHC, SP500, STI, WIG20, and XU100) had two-way interactions, wherein the intensity of war information influences return volatility and vice versa. Further, notably, the search volume in the indices ATHEX, ICEX, MSCI, OMXC 20, SAX, SP 500, and WIG20 was determined by Granger return fluctuations.
4.4. VAR lag order check and cointegration test
Johansen’s test was utilized to determine whether the time series were cointegrated (MacKinnon et al., Citation1999). The Johansen cointegration test is as follows:
In this equation, p and u are components of the values INDEX and GSVI, and are the ascending Eigenvalues that provide the results (MacKinnon et al., Citation1999). The test was performed repeatedly for u = p-1, … ,0 or u = 0, … ,p-1 values, up to the point where the null hypothesis was rejected
, or until the conclusion of the series, if it is not
(MacKinnon et al., Citation1999).
The null hypothesis is accepted, and cointegration is absent when the critical values at 1%, 5%, or 10% are greater than the trace and Max-Eigen statistics (MacKinnon et al., Citation1999). Cointegration occurs when the null hypothesis is rejected. When a critical value at 1%, 5%, or 10% is higher than the trace and Max-Eigen statistics value, the null hypothesis is accepted, and vice versa. If the null hypothesis is not accepted, cointegration exists for the equation.
We ran a cointegration test to determine whether a long-term correlation exists between the indices and GSVI. The Akaike Information Criterion (AIC), Hannan-Quinn criterion (HQ), and Schwarz Information Criterion (SC) with the lowest values were used to determine the ideal number of lags (Ahmed et al., Citation2022; Mansour-Ichrakieh & Zeaiter, Citation2019). Based on the significance data at the 5% level and the final prediction criterion value, the number of lags (FPE) was selected (Appendix 4). The results of the analysis indicate a correlation between the indices and GSVI during the period under study (H.-Y. Chen & Lo, Citation2019; Kropiński & Anholcer, Citation2022; Lai et al., Citation2022; Lo et al., Citation2022). Appendix 5 presents the cointegration tests’ findings, demonstrating that the maximum Eigenvalue and trace statistics were higher than the critical value, at a significance level of 5%. The cointegration of the indices and GSVI at a significance level of 5% leads us to conclude that the variables are in long-term equilibrium. Contrary to the null hypothesis—that cointegration cannot be denied—this finding demonstrates that the alternative is acceptable.
Subsequently, we analyzed the amplitude, direction, and duration of the links using the VAR method to determine the yield of each index (data can be provided upon request). Our results revealed a faster response in the countries surrounding Ukraine, while a significantly slower reaction was observed in developed nations. Moreover, we found a differential response according to geographical position (results available on request).
4.5. EGARCH results
Preliminary tests were performed to detect the effects of ARCH on the EGARCH model’s application. To study heteroscedasticity, partial autocorrelation (PAC), autocorrelation (AC), and Q-tests were used (Youssef et al., Citation2021). As the p-value is typically less than 5%, the Q-test findings typically support the existence of a serial correlation. For ATX, BOVESPA, ICEX, NIKKEI, OMX COPENHAGEN, OMX TALLINN, OMX VILNIUS, OSEAX, PSI 20, PX, RTS, SAX, SOFIX, and SP500, the probabilities were greater than 5%. However, the correlation cannot be disproved up to lag 12; thus, the data series can be used in the EGARCH model. Table presents the model applications’ results. A t-test was used to establish the lowest AIC among the available variants. Only valid models characterized by statistically significant non-zero coefficients were selected.
Table 3. Values of coefficients in the EGARCH model
The term α from relation 10 represents how conflict-related news volume affects future index return volatility. A value greater than zero indicates a positive relationship between the past and present variance of the observed return on the indices ATX, BEL 20, BELEX 15, BET, BOVESPA, BUX, CAC 40, DAX 40, FTSE MIB, FTSE 250, HEX, IBEX, ISEQ, OMX Copenhagen 20, OMX Riga, OMX Stockholm, OMX Vilnius, OSEAX, RTS, SAX, SP 500, WIG20, and XU 100. The volatility increases as the variance shock’s magnitude increases. The phrase γ reveals the conflict-induced shock’s nature and impact on the index return volatility. A negative value indicates leverage, meaning that more volatility will be caused by bad news than by good news of equal magnitude (AEX, ATX, BELEX 15, BOVESPA, BUX, CAC 40, DAX 40, HEX, IBEX, ICEX, NIKKEI, OMX Copenhagen 20, OMX Riga, OMX Stockholm, OMX Tallinn, OMX Vilnius, OSEAX, PSI 20, PX, RTS, SBITOP, SHC, SMI, SOFIX, SP 500, and XU 100). The β coefficient has rich informational content. If the coefficient is statistically significant and negative, lower returns produce higher volatility than higher returns of the same magnitude (Table ).
5. Discussion
An escalation in market volatility marked the onset of the Russia-Ukraine conflict, initiated by news of Russian troop advancement and subsequent bombings. As noted by Yousafet al. (Citation2022a), some markets responded more swiftly than others, a finding echoed by our analysis of volatility dynamics. Markets closer to Ukraine, such as Hungary, Poland, Serbia, Bosnia and Herzegovina, and the Czech Republic, reacted days before the official conflict began, potentially in response to early reports of troop mobilization.
Post-conflict, stock markets in Finland, Latvia, Estonia, Romania, Bulgaria, Greece, and Serbia, reacted rapidly and intensely, revealing high volatility followed by a stabilization phase. As investor confidence increased, believing NATO would not directly intervene in the conflict (Kumari et al., Citation2023), positive post-event results were observed.
Our results affirm the findings of Neely (Citation2022) that war impacts on markets depend on geographical proximity. Markets situated further away, such as Brazil, Australia, South Africa, and Iceland, showed significantly lower volatility. A global negative impact on stock markets was noted owing to the Russia-Ukraine conflict, with European markets depreciating notably, while others showed lesser reactions. Our findings indicate that the Russia-Ukraine conflict had a global negative impact on stock markets. As per the regional analysis, although European markets in particular depreciated, other markets reacted much less. A similar but more accentuated behavior was identified by Chortane and Pandey (Citation2022), in the behavior of the currencies from the Pacific, the Middle East and Africa against the American dollar after the start of the invasion of Ukraine.
Our results also indicated a significantly lower volatility in larger markets, regardless of geographical distance. Markets in the US, China, Japan, the UK, and Germany experienced lower volatilities during the analyzed period, supplementing findings by Abbassi et al. (Citation2023) and Boubaker et al. (Citation2022). The imposed sanctions on Russia by NATO countries and Moscow’s subsequent response could be a possible explanation. Turkey exhibited a unique behavior, characterized by low volatility in the initial phase, followed by increased and sustained volatility.
In the post-event period, Poland, Denmark, and Portugal showed positive cumulative abnormal returns (CARs), with Poland being in close proximity to the conflict (Kumari et al., Citation2023). We confirm Poland’s case, but disagree with the swift recovery claimed by Kumari et al., as we found that Poland experienced high volatility throughout the period, potentially owing to a large influx of Ukrainian refugees. Our network analysis further indicated a war-induced shift in connections among EU stock markets, clustering them according to geographical positions.
Our study included the Baltic states, with close economic and financial ties, which displayed similar responses—high volatility followed by stabilization. On the contrary, Scandinavian countries—Denmark, Sweden, and Norway—exhibited a delayed and less volatile response to the onset of the conflict, as compared to their counterparts closer to Ukraine. Finland, however, marked higher volatility, potentially due to its extensive border with Russia.
Following the war-induced crash in stock market indices, the markets’ reaction to negative news, sanctions, and governmental responses varied in intensity. Maximum volatility was observed in early March. On 9 March 2022, the Netherlands, Belgium, Romania, France, Germany, Italy, the UK, Finland, Spain, Estonia, Switzerland, and Bulgaria reached their peak volatility values, with Russia experiencing the highest volatility. From March 2 to 16, 2022, 21 of the countries analyzed registered their maximum volatility. Following this peak, most markets trended towards lower volatility.
These varying responses across developed markets, both temporally and in magnitude, hint at a potential influence of their economic relations with the warring countries. The war triggered an immediate response in asset prices, yet as more information became available, markets corrected, mirroring the reactions seen during the initial wave of the COVID-19 pandemic (Zheng et al., Citation2021).
6. Conclusions and future research directions
In conclusion, the uncertainty resulting from political, economic, and financial instability, geographical proximity, and sanctions imposed on Russia led to negative reactions in the stock markets during the period analyzed. The Russia-Ukraine conflict, occurring amid global recovery from the COVID-19 pandemic, introduced another layer of shock to the capital markets. We conducted a volatility analysis to identify its impact on stock markets, filling a void in the literature by investigating the war’s effects on volatility in 40 countries. We found that the conflict resulted in negative shocks in the stock indices analyzed. Our results allow for comparisons between the volatility recorded during the conflict and other political or similar events that affected the world economy and specific geographic areas. Military events affect long-term economic growth worldwide. Military wars have significantly influenced all political and military events since the World War II. This study has implications for shareholders, investment funds, analysts, capital markets authorities, and governments, all invested in understanding dynamics to make informed investment decisions amid the uncertainty fueled by the Russia-Ukraine conflict.
Factors such as refugee movements from Ukraine, particularly to Poland, Hungary, Romania, Moldova, and the Baltic states, may have influenced capital market reactions. The volatility in countries imposing sanctions could potentially be explained by these measures. We earmark these hypotheses for future research. We propose further research into a differentiated analysis of sectoral indices, considering some sectors like the energy sector appreciated post-conflict.
Due to the recentness of the war, limited literature was available for reference. Still, our work is likely to align with contemporaneous studies. As the 2022 military events are a continuation of those from 2014, a comparative analysis of volatility between these two periods could be insightful.
The main limitations come from the uncertainty of the war between Russia and Ukraine. Lack of information and inaccuracies may have influenced the obtained results. No explanations were found for the atypical behavior of some markets, such as Turkey and China, which presents directions for future work. The measures, sanctions, and countermeasures adopted by belligerent states or NATO members contributed to the emergence of some volatility that affected certain markets during the analyzed period. Last but not least, the effect of news and selected keywords depends on many control variables, aspects that can have important implications.
Geolocation information
Department of Engineering and Industrial Management, Transylvania University of Brasov, Romania
Acknowledgments
We would like to thank Editage (www.editage.com) for English language editing.
Disclosure statement
No potential conflict of interest was reported by the authors.
Data availability statement
The data presented in this study are available on reasonable request from the corresponding author.
Additional information
Funding
References
- Abbassi, W., Kumari, V., Pandey, & Pandey, D. K. (2023). What makes firms vulnerable to the Russia–Ukraine crisis? The Journal of Risk Finance, 24(1), 24–33. https://doi.org/10.1108/JRF-05-2022-0108
- Adekoya, B. O., Asl, M. G., Oliyide, A. J., & Izadi, P. (2023). Multifractality and cross-correlation between the crude oil and the European and non-European stock markets during the Russia–Ukraine war. Resources Policy, 80, 103134. https://doi.org/10.1016/j.resourpol.2022.103134
- Ahmed, S., Hasan, M. M., & Kamal, M. R. (2022). Russia–Ukraine crisis: The effects on the European stock market. European Financial Management, 1–41. https://doi.org/10.1111/eufm.12386
- Akarsu, S., & Süer, Ö. (2022). How investor attention affects stock returns? Some international evidence. Borsa Istanbul Review, 22(3), 616–626. https://doi.org/10.1016/j.bir.2021.09.001
- Akhtaruzzaman, M., Benkraiem, R., Boubaker, S., & Zopounidis, C. (2022). COVID-19 crisis and risk spillovers to developing economies: Evidence from Africa. Journal of International Development, 34(4), 898–918. https://doi.org/10.1002/jid.3634
- Akhtaruzzaman, M., Boubaker, S., Lucey, B.-M., & Sensoy, A. (2021). Is gold a hedge or a safe-haven asset in the COVID-19 crisis? Economic Modelling, 102, 105588. https://doi.org/10.1016/j.econmod.2021.105588
- Ali, S., Yousaf, I., & Umar, Z. (2022). Infectious disease (COVID-19)-related uncertainty and the safe-haven features of bonds markets. Review of Behavioral Finance, 15(4), 477–487. https://doi.org/10.1108/RBF-04-2021-0069
- Alomari, M., Al Rababa’a, A. R., El-Nader, G., Alkhataybeh, A., & Rehman, U. M. (2021). Examining the effects of news and media sentiments on volatility and correlation: Evidence from the UK. The Quarterly Review of Economics & Finance, 82, 280–297. https://doi.org/10.1016/j.qref.2021.09.013
- Anastasiou, D., Ballis, A., & Drakos, K. (2022). Constructing a positive sentiment index for COVID-19: Evidence from G20 stock markets. International Review of Financial Analysis, 81, 102111. https://doi.org/10.1016/j.irfa.2022.102111
- Baek, S., & Lee, Y. K. (2021). The risk transmission of COVID-19 in the US stock market. Applied Economics, 53(17), 1976–1990. https://doi.org/10.1080/00036846.2020.1854668
- Baker, S. R., Bloom, N., & Davis, S. J. (2016). Measuring economic policy uncertainty. The Quarterly Journal of Economics, 131(4), 1593–1636. https://doi.org/10.1093/qje/qjw024
- Bollerslev, T. (1986). Generalized autoregressive conditional heteroskedasticity. Journal of Econometrics, 31(3), 307–327. https://doi.org/10.1016/0304-4076(86)90063-1
- Boubaker, S., Goodell, J. W., Pandey, D. K., & Kumari, V. (2022). Heterogeneous impacts of wars on global equity markets: Evidence from the invasion of Ukraine. Finance Research Letters, 48, 48. https://doi.org/10.1016/j.frl.2022.102934
- Bougias, A., Episcopos, A., & Leledakis, N. G. (2022). Valuation of European firms during the Russia–Ukraine war. Economics Letters, 218, 110750. https://doi.org/10.1016/j.econlet.2022.110750
- Bradford, M.-B., & Robison, D.-H. (1997). Abnormal returns, risk, and financial statement data: The case of the Iraqi invasion of Kuwait. Journal of Economics and Business, 49(2), 193–204. https://doi.org/10.1016/S0148-6195(97)81515-9
- Caldara, D., & Iacoviello, M. (2022). Measuring geopolitical risk. American Economic Review, 112(4), 1194–1225. https://doi.org/10.1257/aer.20191823
- Chahuan-Jiménez, K., Rubilar, R., De la Fuente-Mella, H., & Leiva, V. (2021). Breakpoint analysis for the COVID-19 pandemic and its effect on the stock markets. Entropy, 23(1), 1–12. https://doi.org/10.3390/e23010100
- Chen, X. (2022). Are the shocks of EPU, VIX, and GPR indexes on the oil-stock nexus alike? A time-frequency analysis. Applied Economics, 1–16. https://doi.org/10.1080/00036846.2022.2140115
- Chen, H.-Y., Chen, H.-C., & Lai, W. C. (2021). Internet search, fund flows, and fund performance. Journal of Banking and Finance, 129, 106166. https://doi.org/10.1016/j.jbankfin.2021.106166
- Chen, H.-Y., & Lo, T.-C. (2019). Online search activities and investor attention on financial markets. Asia Pacific Management Review, 24(1), 21–26. https://doi.org/10.1016/j.apmrv.2018.11.001
- Chortane, S.-G., & Pandey, D.-K. (2022). Does the Russia-Ukraine war lead to currency asymmetries? A US dollar tale. Journal of Economic Asymmetries, 26, e00265. https://doi.org/10.1016/j.jeca.2022.e00265
- Choudhry, T. (2010). World War II events and the Dow Jones industrial index. Journal of Banking & Finance, 34(5), 1022–1031. https://doi.org/10.1016/j.jbankfin.2009.11.004
- Corbet, S., Larkin, C., & Lucey, B. (2020). The contagion effects of the COVID-19 pandemic: Evidence from gold and cryptocurrencies. Finance Research Letters, 35, 101554. https://doi.org/10.1016/j.frl.2020.101554
- Deb, S. (2023). Analyzing airlines stock price volatility during COVID-19 pandemic through internet search data. International Journal of Finance & Economics, 28(2), 1497–1513. https://doi.org/10.1002/ijfe.2490
- Deng, M., Leippold, M., Wagner, A. F., & Wang, Q. (2022). Stock prices and the Russia-Ukraine War: Sanctions, Energy and ESG. SSRN Electronic Journal. https://doi.org/10.2139/ssrn.4080181
- De Souza, P. V. S., & Silva, C. A. T. (2020). Effects of COVID-19 pandemic on international capital markets. International Journal of Economics and Financial Issues, 10(6), 163–171. https://doi.org/10.32479/ijefi.10702
- Engelberg, E. J., & Parsons, A. C. (2011). The causal impact of media in financial markets. The Journal of Finance, 66(1), 67–97. https://doi.org/10.1111/j.1540-6261.2010.01626.x
- Engle, R. F. (1982). Autoregressive conditional heteroscedasticity with estimates of the variance of United Kingdom Inflation. Econometrica, 50(4), 987–1007. https://doi.org/10.2307/1912773
- Fama, E. (1970). Efficient capital markets: A review of theory and empirical work. The Journal of Finance, 25(2), 383–417. https://doi.org/10.2307/2325486
- Fang, Y., & Shao, Z. (2022). The Russia-Ukraine conflict and volatility risk of commodity markets. Finance Research Letters, 50, 103264. https://doi.org/10.1016/J.FRL.2022.103264
- Fariska, P., Nugraha, N., Putera, I., & Rohandi, M. M. A. (2021). Microblogging sentiment investor. return and volatility in the COVID-19 era: Indonesian Stock Exchange. The Journal of Asian Finance, Economics & Business, 8(3), 61–67. https://doi.org/10.13106/jafeb.2021.vol8.no3.0061
- Fernandez, V. (2008). The war on terror and its impact on the long-term volatility of financial markets. International Review of Financial Analysis, 17(1), 1–26. https://doi.org/10.1016/j.irfa.2006.11.003
- Ha, L. T. (2023). Dynamic interlinkages between the crude oil and gold and stock during Russia‑Ukraine War: Evidence from an extended TVP‑VAR analysis. Environmental Science and Pollution Research, 30(9), 23110–23123. https://doi.org/10.1007/s11356-022-23456-0
- Hsieh, S.-F., Chan, C.-Y., & Wang, M.-C. (2020). Retail investor attention and herding behavior. Journal of Empirical Finance, 59, 109–132. https://doi.org/10.1016/j.jempfin.2020.09.005
- Huang, J., Ding, Q., Zhang, H., Guo, Y., & Suleman, M. T. (2021). Nonlinear dynamic correlation between geopolitical risk and oil prices: A study based on high-frequency data. Research in International Business and Finance, 56, 101370. https://doi.org/10.1016/j.ribaf.2020.101370
- Huang, Y. M., Rojas, R. R., & Convery, D. P. (2020). Forecasting stock market movements using Google Trend searches. Empirical Economics, 59(6), 2821–2839. https://doi.org/10.1007/s00181-019-01725-1
- Hudson, R., & Urquhart, A. (2015). War and stock markets: The effect of World War Two on the British stock market. International Review of Financial Analysis, 40, 166–177. https://doi.org/10.1016/j.irfa.2015.05.015
- Ihle, R., Bar-Nahum, Z., Nivievskyi, O., & Rubin, D. O. (2022). Russia’s invasion of Ukraine increased the synchronisation of global commodity prices. The Australian Journal of Agricultural and Resource Economics, 66(4), 775–796. https://doi.org/10.1111/1467-8489.12496
- International Monetary Fund. (2022). Global Financial Stability Report, April 2022: Shockwaves from the War in Ukraine Test the Financial System’s Resilience.
- Jarque, C. M. (2011). Jarque-Bera Test. Miodrag Lovric. Edited by, Springer Berlin Heidelberg. https://doi.org/10.1007/978-3-642-04898-2_319
- Jiang, J. G., Konstantinidi, E., & Skiadopoulos, G. (2012). Volatility spillovers and the effect of news announcements. Journal of Banking & Finance, 36(8), 2260–2273. https://doi.org/10.1016/j.jbankfin.2012.04.006
- Khalfaoui, R., Gozgor, G., & Goodell, J.-W. (2023). Impact of Russia-Ukraine war attention on cryptocurrency: Evidence from quantile dependence analysis. Finance Research Letters, 52, 103365. https://doi.org/10.1016/J.FRL.2022.103365
- Kropiński, P., & Anholcer, M. (2022). How Google Trends can improve market predictions-the case of the Warsaw Stock Exchange. Economics and Business Review, 8(22), 7–28. https://doi.org/10.18559/ebr.2022.2.2
- Kubiczek, J., & Tuszkiewicz, M. (2022). Intraday patterns of liquidity on the Warsaw Stock exchange before and after the outbreak of the COVID-19 Pandemic. International Journal of Financial Studies, 10(1), 13. https://doi.org/10.3390/ijfs10010013
- Kumari, V., Kumar, G., & Pandey, K.-D. (2023). Are the European Union stock markets vulnerable to the Russia–Ukraine war? Journal of Behavioral and Experimental Finance, 37, 100793. https://doi.org/10.1016/j.jbef.2023.100793
- Kumeka, T. T., Uzoma-Nwosu, D. C., & David-Wayas, M. O. (2022). The effects of COVID-19 on the interrelationship among oil prices, stock prices and exchange rates in selected oil exporting economies. Resources Policy, 77, 102744. https://doi.org/10.1016/j.resourpol.2022.102744
- Kupfer, A., & Zorn, J. (2020). A language-independent measurement of economic policy uncertainty in Eastern European Countries. Emerging Markets Finance and Trade, 56(5), 1166–1180. https://doi.org/10.1080/1540496X.2018.1559140
- Lai, H.-H., Chang, T.-P., Hu, C.-H., & Chou, P.-C. (2022). Can google search volume index predict the returns and trading volumes of stocks in a retail investor dominant market. Cogent Economics & Finance, 10(1), 1–18. https://doi.org/10.1080/23322039.2021.2014640
- Lo, G.-D., Marcelin, I., Bassène, T., & Sène, B. (2022). The Russo-Ukrainian war and financial markets: The role of dependence on Russian commodities. Finance Research Letters, 50, 103194. https://doi.org/10.1016/j.frl.2022.103194
- Long, S., & Guo, J. (2022). Infectious disease equity market volatility, geopolitical risk, speculation, and commodity returns: Comparative analysis of five epidemic outbreaks. Research in International Business and Finance, 62, 101689. https://doi.org/10.1016/j.ribaf.2022.101689
- MacKinnon, J. G., Haug, A. A., & Michelis, L. (1999). Numerical distribution functions of likelihood ratio tests for Cointegration. Journal of Applied Econometrics, 14(5), 563–577. https://doi.org/10.1002/(SICI)1099-1255(199909/10)14:5<563:AID-JAE530>3.0.CO;2-R
- Mansour-Ichrakieh, L., & Zeaiter, H. (2019). The role of geopolitical risks on the Turkish economy opportunity or threat. The North American Journal of Economics & Finance, 50, 101000. https://doi.org/10.1016/j.najef.2019.101000
- Mezghani, T., Boujelbène, M., & Elbayar, M. (2021). Impact of COVID‐19 pandemic on risk transmission between googling investor’s sentiment, the Chinese stock and bond markets. China Finance Review International, 11(3), 322–348. https://doi.org/10.1108/CFRI-08-2020-0120
- Moslehpour, M., Al-Fadly, A., Ehsanullah, S., Chong, K. W., Xuyen, N. T. M., & Tan, L. P. (2022). Assessing financial risk spillover and panic impact of Covid-19 on European and Vietnam stock market. Environmental Science and Pollution Research, 29(19), 28226–28240. https://doi.org/10.1007/s11356-021-18170-2
- Moussa, F., Delhoumi, E., & Ouda, B. O. (2017). Stock return and volatility reactions to information demand and supply. Research in International Business and Finance, 39(A), 54–67. https://doi.org/10.1016/j.ribaf.2016.07.016
- Nazarovets, M., & Teixeira da Silva, A. J. (2022). Scientific publishing sanctions in response to the Russo-Ukrainian war. Learned Publishing, 35(4), 658–670. https://doi.org/10.1002/leap.1487
- Neely, C. J. (2022). Financial market reactions to the Russian Invasion of Ukraine. Federal Reserve Bank of St Louis Review Fourth Quarter, 104(4), 266–296. https://doi.org/10.20955/r.104.266-96
- Nonejad, N. (2022). Predicting equity premium out-of-sample by conditioning on newspaper-based uncertainty measures: A comparative study. International Review of Financial Analysis, 83, 102251. https://doi.org/10.1016/j.irfa.2022.102251
- Pandey, D.-K., & Kumar, R. (2023). Russia-Ukraine War and the global tourism sector: A 13-day tale. Current Issues in Tourism, 26(5), 692–700. https://doi.org/10.1080/13683500.2022.2081789
- Pandey, D.-K., & Kumari, V. (2021). Event study on the reaction of the developed and emerging stock markets to the 2019-nCov outbreak. International Review of Economics & Finance, 71, 467–483. https://doi.org/10.1016/j.iref.2020.09.014
- Perlin, S. M., Caldeira, F. J., Santos, A. P. A., & Pontuschka, M. (2017). Can we predict the financial markets based on google’s search queries? Journal of Forecasting, 36(4), 454–467. https://doi.org/10.1002/for.2446
- Poon, S., & Granger, C. W. J. (2003). Forecasting volatility in financial markets: A review. Journal of Economic Literature, 41(2), 478–539. https://doi.org/10.1257/.41.2.478
- Salisu, A. A., Cuñado, J., & Gupta, R. (2022). Geopolitical risks and historical exchange rate volatility of the BRICS. International Review of Economics & Finance, 77, 179–190. https://doi.org/10.1016/j.iref.2021.09.017
- Sims, C. A. (1980). Macroeconomics and reality. Econometrica, 48(1), 1–48. https://doi.org/10.2307/1912017
- Singh, A., Patel, R., & Singh, H. (2022). Recalibration of priorities: Investor preference and Russia-Ukraine conflict. Finance Research Letters, 50, 103294. https://doi.org/10.1016/j.frl.2022.103294
- Su, C.-W., Khan, K., Tao, R., & Moldovan, N.-C. (2019). Does geopolitical risk strengthen or depress oil prices and financial liquidity? Evidence from Saudi Arabia. Energy, 187, 116003. https://doi.org/10.1016/j.energy.2019.116003
- Swamy, V., Dharani, M., & Takeda, F. (2019). Investor attention and Google Search volume index: Evidence from an emerging market using quantile regression analysis. Research in International Business and Finance, 50, 1–17. https://doi.org/10.1016/j.ribaf.2019.04.010
- Szczygielski, J.-J., Bwanya, R.-P., Charteris, A., & Brzeszczyński, J. (2021). The only certainty is uncertainty: An analysis of the impact of COVID-19 uncertainty on regional stock markets. Finance Research Letters, 43, 101945. https://doi.org/10.1016/j.frl.2021.101945
- Tantaopas, P., Padungsaksawasdi, C., & Treepongkaruna, S. (2016). Attention effect via internet search intensity in Asia-Pacific stock markets. Pacific-Basin Finance Journal, 38, 107–124. https://doi.org/10.1016/j.pacfin.2016.03.008
- Ugurlu-Yildirim, E., & Ordu-Akkaya, B. M. (2022). Does the impact of geopolitical risk reduce with the financial structure of an economy? A perspective from market vs. bank-based emerging economies. Eurasian Economic Review, 12, 681–703. https://doi.org/10.1007/s40822-022-00219-3
- Umar, M., Riaz, Y., & Yousaf, I. (2022). Impact of Russian-Ukraine war on clean energy, conventional energy, and metal markets: Evidence from event study approach. Resources Policy, 79, 102966. https://doi.org/10.1016/j.resourpol.2022.102966
- UNHCR Global Appeal 2022. (2022, November 25). UNHCR Global Appeal 2022. https://www.unhcr.org/globalappeal2022
- Wanidwaranan, P., & Padungsaksawasdi, C. (2022). Unintentional herd behavior via the Google search volume index in international equity markets. Journal of International Financial Markets, Institutions and Money, 77(101503), 1042–4431. https://doi.org/10.1016/j.intfin.2021.101503
- World Bank. (2022, June 7). Global economic prospects. https://doi.org/10.1596/978-1-4648-1843-1
- Wu, M.-H., Tsai, W.-C., Lu, C.-C., & Zhang, H. (2022). Google searches around analyst recommendation revision announcements: Evidence from the Taiwan stock market. International Review of Economics & Finance, 81, 75–97. https://doi.org/10.1016/j.iref.2022.04.005
- Yousaf, I. (2021). Risk transmission from the COVID-19 to metals and energy markets. Resources Policy, 73, 102156. https://doi.org/10.1016/j.resourpol.2021.102156
- Yousaf, I., Patel, R., & Yarovaya, L. (2022a). The reaction of G20+ stock markets to the Russia–Ukraine conflict “black-swan” event: Evidence from event study approach. Journal of Behavioral and Experimental Finance, 35, 100723. https://doi.org/10.1016/j.jbef.2022.100723
- Yousaf, I., Youssef, M., & Goodell, W.-J. (2022b). Quantile connectedness between sentiment and financial markets: Evidence from the S&P 500 twitter sentiment index. International Review of Financial Analysis, 83, 102322. https://doi.org/10.1016/j.irfa.2022.102322
- Youssef, M., Mokni, K., & Ajmi, A. N. (2021). Dynamic connectedness between stock markets in the presence of the COVID-19 pandemic: Does economic policy uncertainty matter? Financial Innovation, 7(13), 1–27. https://doi.org/10.1186/s40854-021-00227-3
- Yu, H., Chu, W., Ding, Y., & Zhao, X. (2021). Risk contagion of global stock markets under COVID-19: A network connectedness method. Accounting & Finance, 61(4), 5745–5782. https://doi.org/10.1111/acfi.12775
- Zhang, Y. M., & Mao, J. Y. (2022). COVID-19‘s impact on the spillover effect across the Chinese and US stock markets. Finance Research Letters, 47, 102684. https://doi.org/10.1016/j.frl.2022.102684
- Zheng, S., Li, H., & Sun, H. (2021). Crisis lifecycle, policy response, and policy effectiveness. Public Management Review, 25(2), 286–312. https://doi.org/10.1080/14719037.2021.1972683