
 ?Mathematical formulae have been encoded as MathML and are displayed in this HTML version using MathJax in order to improve their display. Uncheck the box to turn MathJax off. This feature requires Javascript. Click on a formula to zoom.
Abstract
In a world where financial capital serves as the backbone of individual and societal economic health, understanding the mechanisms that can stimulate or hinder its accumulation is critical. This study explores how the accessibility of banking services and the integration of digital finance can influence the accumulation of financial wealth, as well as disparities in household savings. Drawing on data derived from the Finscope Consumer Survey for Togo 2016 and the Harmonized Living Standards Measurement Study 2018 for Togo, this study employs a range of analytical methodologies including propensity score matching, double difference, and smoothed instrumental variable quantile regression tools. The outcomes of this study underscore that access to banking services and digital finance significantly enhances physical asset investment and the adoption of sound financial practices rather than an increase in bank savings alone. Therefore, the emergence of digital finance can be seen as a missing link in the formal financial system’s ability to improve the efficiency of financial service provision and make a significant contribution to reducing inequalities in wealth accumulation. This study sheds light on the significant decrease in inequality concerning the capacity for wealth accumulation among households.
1. Introduction
Developing countries often grapple with the task of mobilizing domestic savings because of a variety of factors, including low-income levels, a general lack of trust in financial institutions, and inadequate access to banking services (International Monetary Fund, Citation2018; Sodokin & Donou-Adonsou, Citation2010). In response, potential remedies proposed by governments and financial institutions include advocating for financial literacy and savings through credit programs, and enhancing access to banking in underprivileged regions (Bharali & Gill, Citation2019). Further, the importance of fostering a stable macroeconomic environment cannot be overstated (Atisophon et al., Citation2011; Sodokin et al., Citation2022a). Renowned theorists such as Friedman (Citation1957), Modigliani (Citation1966, Citation1986), and Keynes (Citation1936) provide comprehensive theoretical frameworks for decoding savings behavior. The burgeoning domain of digital finance, exemplified by mobile banking, breaks down the barriers and facilitates greater access to financial services across Africa (Dontsi, Citation2021; Sodokin, Citation2023; Sodokin & Nyatefe, Citation2021; Sodokin et al., Citation2022b, Citation2023) and enhances public policy inth-efight against money laundering (Couchoro et al., Citation2021). Nevertheless, socioeconomic factors can still hinder access (Beck et al., Citation2007), causing individuals to rely on informal, riskier saving, and borrowing methods. These socioeconomic factors then lead to a high concentration of wealth in the hands of a minority and a high level of savings inequality within households, which we refer to as discrepancies in households’ wealth accumulation (Chatterjee et al., Citation2021).
In the case of Togo, improvements in financial service access contributed to the growth of domestic savings rates between 2013 and 2020 (International Monetary Fund, Citation2020). Nevertheless, despite this progress, Togo’s public debt to nominal GDP ratio has increased from 59.6% in 2019 to 64.6% in 2020 (European Investment Bank, Citation2022), underlining the need for policies that further stimulate domestic savings. Regarding wealth accumulation, saving drives economic development by providing a means to increase productivity and output (Sachs, Citation2015). Banks play a critical role in facilitating capital flow and supporting wealth accumulation at the household and firm levels (Merton & Bodie, Citation2005; Rajan & Zingales, Citation2003). Digital finance can also promote wealth accumulation by expanding access to financial services and reducing service costs (Beck et al., Citation2016; Evans, Citation2018). Indeed, comprehensive access to both financial banking services and digital finance is undoubtedly driving a structural transformation in the consumption and wealth accumulation habits of households in Africa and throughout the developing world, fostering a high degree of financial inclusion for the population. The issue of access to finance and financial inclusion has been extensively discussed in economic literature (Demirgüç-Kunt & Klapper, Citation2013). However, the question that remains to be explored concerns the significance of disparities in household wealth accumulation behavior and inequalities in savings capacity induced by access to financial banking services and digital finance.
This inquiry bears significant weight because the characteristics of wealth accumulation can influence the pool of obtainable funds designated for financing fruitful investments. How does access to formal financial systems and digital finance shape the configuration of household financial wealth accumulation? To address this matter, our study employs microeconomic data from two distinct timeframes in Togo, scrutinizing the dynamics of how access to formal financial services and digital finance impacts household wealth accumulation patterns and disparities.
The principal goal of this study is to evaluate the impact of access to bank financial services and digital finance on household wealth accumulation behavior and wealth inequality. We first seek to assess the degree to which access to bank financial services can shape household behavior when it comes to accumulating wealth. We also investigated the role of digital finance in influencing household wealth accumulation habits. Going a step further, our study delves into the combined effect of bank financial services and digital finance on households’ wealth accumulation behavior. This includes an exploration of any potential synergistic effects that these two factors might collectively bring about when utilized together. Finally, we turn our attention to evaluating whether and how access to bank financial services, in conjunction with the use of digital finance, can contribute to reducing inequalities in household wealth accumulation. In sum, this comprehensive study aims to shed light on how these financial tools, both individually and together, affect wealth accumulation behaviors and whether they meaningfully contribute to the reduction of wealth disparities among households.
We employed a trio of estimation techniques, specifically, propensity score matching (Rosenbaum & Rubin, Citation1985), the double-difference method (Khandker et al., Citation2010; Stock & Watson, Citation2020), and smoothed instrumental variable quantile regression (Kaplan, Citation2022; Kaplan & Sun, Citation2017). By combining propensity score matching and the double-difference method, we were able to make nuanced comparisons between various types of savings among households irrespective of their access to financial services. These techniques also allow us to account for potential challenges such as selection bias and individual heterogeneity. Furthermore, we deployed the smoothed instrumental variable quantile regression technique to elucidate the role of financial services in mitigating wealth accumulation inequalities among households, addressing potential endogeneity biases from a methodological perspective.
This study offers two modest yet significant contributions to the economic literature: (i) it explores the impact of access to banking services and the utilization of digital finance on disparities in wealth accumulation and the reduction of savings inequalities among households and (ii) it illuminates the nuanced influence of banking and digital finance on household savings. This influence varies depending on the type of savings and the initial savings levels, which in turn contributes to a reduction in savings inequality.
The remainder of this paper is organized as follows. A concise literature review initiates the discussion in Section 2, followed by an explanation of the methodology in the third section. Section 4 delves into the results and offers a commentary, analysis, and discussion. The paper concludes in the final section.
2. Brief review of the literature
2.1. Impact of access to financial services on household financial wealth accumulation behavior
Access to financial services plays a substantial role in shaping wealth accumulation behavior by granting individuals opportunities to save, invest, and expand their wealth (Lusardi, Citation2019; Lusardi & Mitchell, Citation2014). Savings can enhance financial literacy, foster responsible conduct, and facilitate long-term financial planning (Dynan et al., Citation2004; Gilenko & Chernova, Citation2021). Furthermore, the utilization of formal financial services can lower borrowing expenses and elevate savings returns, empowering individuals to amass capital over time (Lusardi, Citation2019; Lusardi & Mitchell, Citation2014). The provision of savings can also provide a safety net for unanticipated expenditures and aid households in managing financial shocks (Dynan et al., Citation2004; Gilenko & Chernova, Citation2021).
Studies of the impact of financial service access on wealth accumulation behavior at both macro and micro levels have yielded diverse findings. At the macro level, studies demonstrate that access to financial services can increase economic growth, reduce poverty, and promote financial stability (Bayar, Citation2014; Emara & Kasa, Citation2020; Horioka & Terada-Hagiwara, Citation2012; Sahoo & Dash, Citation2013). However, Yazid (Citation2007) finds that financial liberalization negatively affects household savings in Algeria. At the micro level, studies have shown that access to financial services can improve financial inclusion, increase savings and investment, and enhance the well-being of individuals and households (Aportela, Citation1999; Brune et al., Citation2014; Demirgüç-Kunt & Klapper, Citation2013; Karlan et al., Citation2016; Prina, Citation2015). However, the impact varies across individuals and households owing to factors such as income, education, and culture.
Hypothesis 1.
Access to bank financial services can lead to improved wealth accumulation behavior by households.
2.2. Impact of digital finance on household wealth accumulation behavior
Research on the impact of technological changes in finance, such as mobile money and mobile banking, on household savings behavior has shown that technology plays a crucial role in improving the financial stability, security, and inclusion of the poor and unbanked population. By providing access to financial services through mobile platforms, people without access to traditional banking systems can save and transact money more efficiently (Evans, Citation2018; Sodokin, Citation2021; Sodokin & Nyatefe, Citation2021).
Studies demonstrate that mobile money and banking can increase both formal and informal savings. Loaba (Citation2022) found that mobile banking in West Africa increases the probability of formal savings by 2.4% and informal savings by 0.83%, with a more significant impact on women’s formal savings. Suri and Jack (Citation2016) revealed that Kenya’s M-PESA mobile money service increased savings and lifted 194,000 households out of poverty. Skogqvist (Citation2019) also found that mobile money users in Kenya are more likely to have savings products in formal institutions than are non-users. In addition, Morawczynski (Citation2009) discovered that 18% of the income of M-PESA users in Kenya was saved using the service. Other studies have reported a positive relationship between mobile financial services use and savings. Ouma et al. (Citation2017) found that using mobile financial services increases the probability of saving by 0.7794. Ky et al. (Citation2018) showed that mobile money in Burkina Faso increases individuals’ propensity to save for health emergencies. Nandhi (Citation2012) found that 90% of EKO mobile banking users in Delhi reported an increased ability to save.
Hypothesis 2.
Access to digital finance can improve the wealth accumulation behavior of households.
2.3. Impact of access to bank financial services together with digital finance on household wealth accumulation behavior
Access to bank financial services and digital finance has had a substantial impact on household wealth accumulation behavior by increasing financial inclusion, saving behavior, and investment behavior (Karlan et al., Citation2016; Li et al., Citation2021; Song et al., Citation2020). Bank accounts and digital finance platforms enable households to save more easily and securely by offering a variety of savings and investment products (Khera et al., Citation2021). In addition, these services provide microfinance and loan products, allowing households to invest in assets and opportunities that can increase their wealth over time (Allen et al., Citation2021). The integration of banking services with digital finance makes managing finances, tracking spending, and saving money more convenient for households (Khera et al., Citation2021). Digital finance tools such as mobile banking apps and investment platforms allow individuals to access financial services from their devices, leading to increased savings and improved financial well-being (Bank for International Settlements [BIS], Citation2020).
Financial well-being refers to an individual’s ability to manage finances to achieve financial goals and maintain a satisfactory level of financial security and stability (Khera et al., Citation2021). Achieving financial well-being requires a comprehensive understanding of personal finances, financial management skills, and informed financial decisions (BIS, Citation2020).
Hypothesis 3.
Access to bank financial services together with digital finance positively impacts household by increasing financial wealth accumulation behavior.
2.4. Impact of access to bank financial services together with digital finance on inequality in household wealth accumulation
Many studies have focused on the effect of financial services on income inequality (Osakwe & Solleder, Citation2023). However, wealth inequalities differ and are more concentrated than income inequalities (Osakwe & Solleder, Citation2023). This result shows that wealth inequality goes beyond income inequality alone. Tiwari et al. (Citation2022) note the key role that formal financial services can play in reducing the wealth gap between the rich and poor. As it lowers financial constraints, access to financial services enhances household investment and income (Sodokin et al., Citation2023), thereby reducing wealth inequality (Wamalwa, Citation2022). Nevertheless, von Fintel and Orthofer (Citation2020) find that access to financial services benefits middle-income households more than low-income ones. In particular, they point to predatory lending by financial institutions that can reduce the wealth accumulation of poor households. Studying the impact of financial services on a panel of emerging countries, Cengiz and Manga (Citation2023) conclude that financial services increase inequalities in wealth accumulation. Osakwe and Solleder (Citation2023) find that access to financial services does not have a significant impact on wealth inequality. However, this study did not consider the role of technological change in finance. Indeed, Iftekhar et al. (Citation2020) find that efficient access to financial services is key to reduce wealth inequality. Therefore, the emergence of digital finance can be seen as a missing link in the formal financial system’s ability to improve the efficiency of financial service provision and make a significant contribution to reduce inequality in wealth accumulation.
Hypothesis 4.
Access to bank financial services together with digital finance use reduce inequalities in household wealth accumulation.
3. Methodology
This study assessed the causal impact of banking access and digital finance utilization on household wealth accumulation and savings disparity. Conventional techniques such as ordinary least squares (OLS) may exhibit bias and inconsistency due to non-random treatment allocation, thereby violating the zero conditional mean assumption (Stock & Watson, Citation2020). To mitigate this, we employ propensity score matching (PSM) to control for omitted variable bias (Stock & Watson, Citation2020; Wooldridge, Citation2015) and selection bias (Rosenbaum & Rubin, Citation1985) by pairing treated and untreated individuals based on observable characteristics. Furthermore, we use inverse probability-weighted adjusted regression to address specification concerns (Robins et al., Citation2007; Wooldridge, Citation2007) and examine the sensitivity of the estimated average effects to unobservable individual attributes using the Mantel-Haenszel test and the difference-in-differences approach (Khandker et al., Citation2010; Stock & Watson, Citation2020). To ascertain the causal influence of the treatment variables on savings inequality, we employ smooth instrumental variable quantile regression, accounting for distinct quintiles of the savings distribution and addressing potential endogeneity biases (Chernozhukov & Hansen, Citation2008; Kaplan, Citation2022; Kaplan & Sun, Citation2017; Kwak, Citation2010).
3.1. Specification of propensity score matching
The model estimated through PSM can be written as follows:
Where i represents the individuals, represents the outcome variables (global savings, bank savings, and investment in physical assets),
is the treatment indicator variable (access to bank financial services, use of digital finance, and access to bank finance, together with the use of digital finance) which takes the value 1 when the individual is in the treatment group and 0 otherwise, and ε is the error term.
Under the assumption of conditional independence and common support (Rosenbaum & Rubin, Citation1985), the average treatment effect on the treatment group is written as follows:
Where and
represent respectively treatment and control group sample, and
represents the probability of receiving the treatment. First, we use the maximum likelihood method to estimate this probability under the assumption of a normal distribution of error terms. This assumption seems reasonable insofar as our sample allows us to rely on asymptotic properties (Cameron & Trivedi, Citation2005; Ruud, Citation2000).Concretely, we estimate the probability
through a probit model where
is regressed on a set of individual characteristics. Then, the treatment effects are estimated through two matching algorithms: nearest neighbor and kernel matching.
3.2. Double difference method using differences as counterfactual
Given conditional exogeneity and common support assumptions, by matching two groups of individuals with similar characteristics, the PSM method produces a consistent estimator using a simple difference in means between the level of capital accumulation of treated households (those with access to bank financial services or using digital finance) and untreated households (those without access to bank financial services or not using digital finance). Nevertheless, we can use the difference in means as a counterfactual, particularly when we have data for at least two periods. This leads to the double difference estimator (Cameron & Trivedi, Citation2005; Khandker et al., Citation2010). In concrete terms, let’s consider the following equation:
Where is the treatment variable and t the time (t = 1 in 2018 and t = 0 in 2016). The variables
and t are included separately to capture any distinct average effect of time. Estimation of EquationEquation (3)
(3)
(3) with OLS yields the coefficient
which represents the average Double Difference effect of the treatment variable on the outcome Wealth accumulation. Indeed, since
in 2016 and 1 in 2018, the average level of wealth over the two years in the treated group (T) and the control group (C) is written as follows:
Subtracting EquationEquation (5)(5)
(5) from EquationEquation (4)
(4)
(4) , we find the
estimator of the double difference. Unlike the propensity score matching method, which uses a simple difference between the individuals in the 2016 database and those in the 2018 database, the double difference allows us to control for the effect of unobservable differences between individuals (Khandker et al., Citation2010; Stock & Watson, Citation2020) by simultaneously using the individuals in the 2016 and 2018 databases. It is easy to believe that some individuals are more savers than others, fewer consumers than others, or have a greater ability to use digital finance or understand how the formal banking system works. Assuming that these heterogeneities are stable over time and uncorrelated with the treatment over time, the double-difference method allows us to consider them in our estimates. This assumption is weaker than the conditional exogeneity assumption in the PSM method (Khandker et al., Citation2010). However, as noted above, Togolese households may differ in their observable characteristics. In this sense, to control for the effect of observable characteristics (Cameron & Trivedi, Citation2005; Stock & Watson, Citation2020), EquationEquation (3)
(3)
(3) is modified as follows:
Where, is a set of variables to control the effect of the treatment on Wealth accumulation and get a more efficient estimator
. Then to measure
, we use ordinary least squares regression and also fixed effects regression to control the evolution of observable variables over time. Concretely, we apply the Double differences (DD) methods only on individuals matched through the Propensity score matching and the estimator is calculated as follows:
Where is the weight assigned by PSM to individual
in the control group matched to individual
in the treatment group.
and
represent the wealth accumulation of an individual in the treatment group and the control group. Combine the advantages of the Propensity score matching method with those of the Difference method allow us to arrive to robust estimators based on less restrictive hypotheses (Khandker et al., Citation2010).
3.3. Quantile regression with instrumental variables
To study the causal effect of treatment variables on inequality in savings levels, we take different quintiles of the savings level distribution and estimate the impact of treatment variables on each quintile. Indeed, the effect of treatment may differ significantly depending on the quintile considered (Bang et al., Citation2016; Sodokin, Citation2021). To do this, we use the quantile regression with smooth instrumental variables described by (Kaplan, Citation2022; Kaplan & Sun, Citation2017). This method allows us to take into account different quintile distributions of the level of savings and to test our hypothesis that the treatment variables contribute to reducing inequalities in savings between households. Moreover, this method allows us to take into account the endogeneity bias. The advantages of this method as the most suitable for our purpose have been well documented in the literature by Koenker and Ng (Citation2005).
The quantile regression model at quantile of Savings is identified by:
Where T is the treatment variable, x is a vector of explanatory variables, z is a vector of excluded instruments correlated with the treatment variable T, but uncorrelated with the wealth accumulation variable. This situation leads to the following simplified “objective” function:
Where (.) is a weighted absolute value function that solves
quantile of Savings in the sample. By smoothing the moment underlying the “objective” function
is defined as the solution of the vector of smoothed estimation equations
(
) = 0 where:
3.4. Data and descriptive statistics
We used data from Finscope 2016 for 5,197 households and the Harmonized Living Standards Measurement Study (HLSMS) in 2018 and 2019 (INSEED, Citation2020) for 6,171 households. The Finscope Consumer Survey Togo 2016 (Finmark, Citation2016) was conducted by the National Institute of Statistics, Economic and Demographic Studies (INSEED-Togo) in collaboration with the FinMark Trust organization to describe the financial access landscape in Togo. The HLSMS survey, conducted by INSEED-Togo in 2018 and 2019 (INSEED, Citation2020) for the West African Economic and Monetary Union and World Bank, aimed to describe the living conditions of Togolese households. For the purposes of this study, we used these two databases from a comparative perspective because they were conducted by the same institute, and their samples were randomly selected from the same population (Khandker et al., Citation2010; Stock & Watson, Citation2020). In addition, they were performed using similar data-collection methods.
In Figure , we depict the histograms of the distribution of savings levels among Togolese households. Bars represent the number of households with different savings levels. The continuous curve represents the kernel density corresponding to the normal distribution approximation. We considered all savings levels on one side (Figure ) and, on the other side, savings levels above the minimum value. The distribution of savings was quite similar to the 2016 data (Figure ). However, compared to the 2018 data, the distribution was denser (Figures ). Indeed, the bars in Figure are significantly closer than those in Figure , reflecting less disparity in savings among households in 2018.
Figure 1. Distribution of the global savings in the samples.
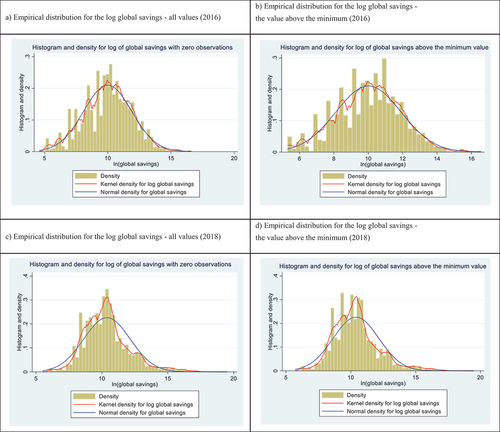
The descriptive statistics in Table are consistent with the illustrations in Figure , as the standard deviation of the overall savings in 2018 was slightly lower than that in 2016. Similarly, when we look specifically at bank savings or investments in physical assets, their dispersion is lower in 2018. Regarding the treatment variables, access to banking services declined between 2016 and 2018, while the average use of digital finance more than doubled.
Table 1. Descriptive statistics
In , we test the significance of the mean differences by treatment variables. In , for 2016, the average level of savings is not significantly different either with access to banking services as a treatment variable or with the use of digital finance. In contrast, in 2018, the table shows significant differences in the average savings. These patterns are similar to those observed in , where banking services are combined with digital finance. Furthermore, when we consider covariates, we observe significant mean differences between 2016 and 2018. In this sense, the mean differences found for the outcome variables across households may not solely be due to access to financial services or the use of digital finance. Indeed, they could also reveal the effects due to the specificities of each individual. Thus, the estimation methods used address these potential biases and clearly identify treatment effects.
Table 2. Difference in means by access to Bank financial services and by digital finance use
Table 3. Difference in means by access to Bank finance services with digital finance use
4. Results and discussion
4.1. Balance plot
Figures effectively illustrate the matching process. Figure depicts the distribution of individual characteristics between the control and treatment groups, whereas emphasizes the reduction in bias achieved through implementation of the propensity score matching method. In the propensity score distribution shown in Figure A1 in the appendix and in Figure , an overlap between the control and treatment groups was observed following the matching process. Consequently, individuals within the control group now exhibited characteristics similar to those found in the treatment group, a finding that is further corroborated by the data presented in .
Figure 2. Propensity score distribution.
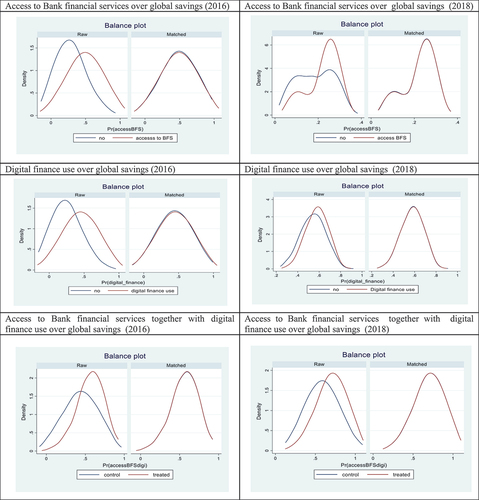
Table 4. Balancing test for propensity score matching
By employing the propensity score matching method, selection bias was reduced by an average of 95% in 2016 and 79% in 2018 (Figure in the appendix and Table ). Overall, this technique decreased the selection bias in our samples by 87%. Upon conducting propensity score matching, we can confidently conclude that, in terms of covariates, the individuals within the control and treatment groups no longer displayed significant differences, as shown in Figure .
4.2. Impact of access to financial access and digital finance on household wealth accumulation
The findings suggest that access to bank financial services significantly enhances household savings. Indeed, Table shows that access to financial services increases the overall savings level by an average of 9.4 percent. However, investment in physical assets was the component most affected by banking services, with an average increase of 8.9 percent. This situation implies that households primarily use banking facilities to borrow for the accumulation of physical assets, rather than to make regular deposits (Koomson et al., Citation2022). Bank savings are not significantly affected. In Table , the behavior of households in 2016 indicates that they did not use digital finance to increase their overall savings levels. Moreover, in 2018, the use of digital finance diverted households from bank savings. Indeed, households that do not use digital finance have higher average bank savings (48.4%). Finally, in Table , apart from a contraction in investment in physical assets, Togolese households do not achieve a significant improvement in wealth when digital finance is combined with banking services.
Table 5. Impact of access to bank financial services on household wealth accumulation
Table 6. Impact of digital finance use on household’s wealth accumulation
Table 7. Impact of access to bank financial services together with digital finance use on household wealth accumulation
4.3. Mantel-Hanszel sensitivity test
In Table , we perform the Mantel-Haenszel sensitivity test to analyze the sensitivity of our findings to unobservable variables. The Mantel-Haenszel sensitivity test is a statistical method used to determine if the results of a study are sensitive to the presence of confounding variables. The test is employed to assess the robustness of treatment effect estimates by examining the results’ sensitivity to the presence of unobserved variables. A p-value of zero suggests that the null hypothesis can be rejected, which in this case means that the treatment effects are not sensitive to unobservable variables. This situation implies that the treatment effects are robust to the presence of confounding variables, and the study results are likely reliable.
Table 8. Mantel-Haenszel sensitivity test
We perform the test for gamma values ranging from 1 to 1.05, and the null hypothesis is that treatment effects are sensitive to unobserved variables. For our three treatment variables, the p-values equal zero. Consequently, the estimated treatment effects are not sensitive to unobserved factors. In this sense, through propensity score matching, treatment is randomly assigned, and the difference between the average outcome of the treatment and control group accurately reflects the treatment effect. The average treatment effect in Tables indicates the real impact of access to bank financial services, digital finance use, and the combined variable, respectively.
4.4. The double difference results
Table ,Footnote1 presents the findings of the double-difference restricted to the sample matched by propensity score matching. The results showed that differences among individuals were reliably identified. Access to bank services does not encourage savings behavior among households (−61% for OLS and − 62% for fixed effects over the 2016-2018 period). This finding is consistent with the propensity score-matching results. This reflects credit-oriented banking services that do not result in tangible wealth accumulation. As it opens new channels for investments and consumption, digital finance use is specifically turning Togolese households away from bank savings. As with propensity score matching, no meaningful improvements in wealth accumulation were reported when Togolese households linked digital finance to banking services. Nevertheless, as this result does not discriminate households by wealth level, it should be viewed in the context of the initial wealth disparities among households.
Table 9. Results with double difference method
4.5. Impact of financial access and digital finance use on household savings inequality
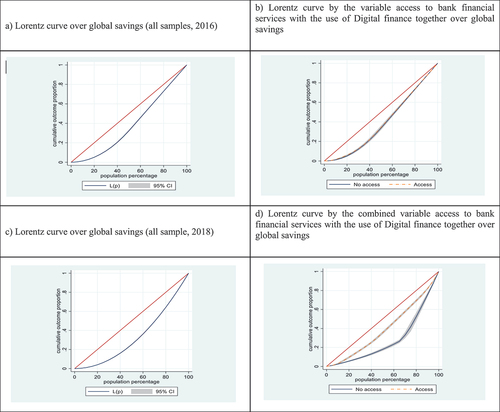
4.5.1. Lorenz curves for savings distribution among households
Figure illustrates the distribution of savings within different quintiles for the entire sample and by treatment variable. Notably, in 2016, Figure does not show a real difference between inequalities in savings among households with access and those without. In contrast, the 2018 data show a real difference (Figure ). Between the .15 and .95 quintiles, the distribution of savings is largely more equal among households with access to banking services using digital finance. Thus, Figure shows a strong reduction in inequality between the different savings quintiles through access to banking services and the use of digital finance.
Figure 3. Lorentz curves for all samples and by treatment variable over global savings.
4.5.2. Validity test for instruments
We use two instrumental variables to instrument our treatment variables. These are the landowners and residential areas. We assume that property owners and residential areas strongly correlate with our treatment variables. Banking and telecommunications structures develop their services more strongly in urban areas. Moreover, holding property titles facilitates access to banking services. The principle of relevance of the instrumental variables used is then respected. We also assume that the instrumental variables are used to respect the exclusion principle. Property owners do not directly impact household savings. It only influences the level of savings through its correlation with treatment variables. The same was true for residential areas. However, this hypothesis may seem relatively strong. To test this, we present results on the validity of the instruments used in .
Table 10. Instruments validity test
For the model 1 (access to bank financial services and impact on savings), the Kleibergen-Paap for the weakness of the instruments is F = 0.749 for the year 2016 and indicates that the instruments are weak, but finally, we have a Sargan-Hansen of 0.981 with a p-value = 0.322, which allows us not to reject the null hypothesis of the validity of the instruments used (Bang et al., Citation2016; Sodokin, Citation2021). For the year 2018, the Kleibergen-Paap for instrument weakness is F = 107.343, and the Sargan-Hansen is
0.230 with a p-value = 0.631 which suggests that the instruments are not weak and are valid. For the model 2 (access to digital finance and impact on savings), the Kleibergen-Paap for the weakness of the instruments is F = 5.372 for the year 2016 and suggests that the instruments are weak, but at the end of the errors, with a Sargan-Hansen of
0.631 and a p-value = 0.427, we can conclude the instruments’ validity. For the year 2018, the Kleibergen-Paap for the weakness of the instruments is F = 18.310, and the Sargan-Hansen is
0.222 with a p-value = 0.638 which suggests that the instruments are not weak and are valid. For the model 3 (access to bank financial services together with digital finance and impact on savings), the Kleibergen-Paap for the weakness of the instruments is F = 2.683 for the year 2016 and indicates that the instruments are weak, but finally, we have a Sargan-Hansen of
0.733 with a p-value = 0.392, which allows us not to reject the null hypothesis of the validity of the instruments used. For the year 2018, the Kleibergen-Paap for instrument weakness is F = 13.649, and the Sargan-Hansen is
3.290 with a p-value = 0.069 which suggests that the instruments are not weak and are valid for 1 and 5% significance levels (Baum et al., Citation2007).
4.5.3. Impact of access to bank financial services and digital finance use on savings inequality
Table ,Footnote2 shows the impact of access to banking services on the savings quintiles. Contrary to the results of the double difference, households significantly increased their overall level of savings through banking services. Moreover, access to banking services mitigates inequalities in savings levels among Togolese households. Indeed, the lowest quintile emerges with the highest variation in the overall savings. The same is true for investment in physical assets. In this sense, households with low savings benefit from a higher variation in their overall savings and investment in physical assets through banking services. The idea is that households choose to invest in physical assets such as real estate or stocks that can appreciate value over time. This situation can help increase their overall wealth and financial security, as well as provide them with a safety net in case of unexpected expenses or emergencies.
Table 11. Impact of bank financial services on household’s wealth accumulation
On the other hand, as with propensity score matching, households use banking services much more for borrowing than for regular deposits. This result was confirmed, regardless of the selected quintile (Table ). In fact, this result is too singular and may not reflect a generalization of the financial behavior of households. In practice, this statement may not necessarily be true for all households, as banking usage patterns can vary greatly depending on several factors, such as location, income, cultural background, and personal financial goals. Some households rely heavily on borrowing from banks for personal loans and credit cards. By contrast, others may primarily use bank services for deposits, such as savings and checking accounts. Technological change has made it easier for individuals to access various financial transaction products, so it is not uncommon for households to use both traditional banking services and alternative financial services, such as digital finance.
In Table Footnote3, the lowest quintiles raise their overall savings levels through the use of digital finance. Using digital finance by households in the highest quintile does not significantly boost their overall savings. Thus, like access to banking services, but with lower levels of variation, digital finance contributes significantly to reducing household savings inequalities. These results were also confirmed in terms of investments in physical assets. The results provide evidence that digital finance can substantially decrease inequality among household savings by offering access to financial products and services to underserved populations such as low-income individuals, rural communities, and minority groups. However, using digital finance diverts households from bank savings, which is confirmed for all quintiles but more strongly for the lowest quintile.
Table 12. Impact of digital finance use on household wealth accumulation
Finally, combining banking services with the use of digital finance further stimulates the overall savings level of households in the lowest quintiles (Table ),Footnote4 This statement is generally accurate and has been supported by several studies (Karlan et al., Citation2016; Li et al., Citation2021; Song et al., Citation2020). This result highlights the key role of the complementarity between banking services and digital finance in enabling households to access more resources. By linking digital finance with banking services, financial institutions have become more efficient in providing financial services to vulnerable segments of the population (Iftekhar et al., Citation2020). The results show that this complementarity is largely reflected in the significant increase in investment in physical assets among low- and middle-income households. This association has no significant effect on the overall savings of the richest households, although it stimulates investment in physical assets. The dynamics of households’ financial decisions lean towards an accumulation of physical assets. Thus, this association is a tool to reduce inequalities in wealth accumulation among Togolese households. The results highlight the key role of banking services and digital finance in reducing inequality in the accumulation of household wealth.
Table 13. Impact of access to bank financial services together with digital finance use on household’s wealth accumulation
5. Discussion
Consistent with Karlan et al. (Citation2016), our findings show that access to financial banking services enhances households’ aggregate wealth accumulation. By easing financial constraints, households can cope with shocks and build their resilience (Brune et al., Citation2014; Prina, Citation2015). When we discriminate between bank savings and investments in physical assets, the results reflect a greater willingness of households to use bank financial services to obtain credit rather than to make regular savings. However, this result may not reflect a generalization of household financial behavior, as banking usage patterns can vary considerably depending on several factors, such as place of residence, income, cultural background, and personal financial goals. The use of digital finance seems to have turned Togolese households away from bank savings. Digital finance opens up new investment and consumption opportunities for households. These results contrast with those of Loaba (Citation2022), who found a positive contribution from digital finance to household bank savings.
Overall, our results point to the substantial impact of bank financial services and digital finance use on household wealth accumulation, reinforcing the findings of Song et al. (Citation2020) and Li et al. (Citation2021). Moreover, the quantile regression results show that access to bank financial services and digital finance use contribute to reducing inequalities in wealth accumulation among Togolese households. These results were consistent with those reported by Tiwari et al. (Citation2022) and Wamalwa (Citation2022). However, they run counter to those of Cengiz and Manga (Citation2023) and Osakwe and Solleder (Citation2023), whose results conclude that access to financial services has no significant impact on inequalities in wealth accumulation. Furthermore, our results show the crucial role of the complementarity between digital finance and banking financial services in substantially reducing inequalities in wealth accumulation among Togolese households. By linking digital finance with banking services, low- and middle-income Togolese households have more resources at their disposal to invest. These results support the findings of von Fintel and Orthofer (Citation2020).
5.1. Implication for public policy
The implications of this study can stimulate policy discussion in several ways. Given that digital finance and banking services can significantly enhance financial inclusion and, in turn, stimulate wealth accumulation, especially among marginalized and low-income households, policy initiatives should aim to broaden the reach of these services, particularly in rural and underserved regions. A prominent example of such an initiative is India’s Pradhan Mantri Jan-Dhan Yojana Program, launched in 2014 with the aim of providing universal access to banking services. By 2021, the initiative has led to the creation of over 420 million new bank accounts, greatly facilitating financial inclusion (Isukul & Tantua, Citation2021; Mushtaq & Bruneau, Citation2019; Ray, Citation2022). Another crucial policy implication was the enhancement of financial literacy. A deeper understanding of banking and digital finance allows households to make informed decisions regarding savings and investments, leading to a more efficient wealth accumulation. Initiatives such as the Organization for Economic Co-operation and Development (OECD) International Network on Financial Education have played a significant role in promoting global financial literacy (Bongomin et al., Citation2020; Buenestado-Fernández et al., Citation2023).
In addition, policy initiatives should encourage innovation in financial technology to ensure that banking services and digital finance evolve to meet changing household needs. This could involve supporting startups that are developing novel financial technologies, as seen in countries such as Singapore, where the Monetary Authority of Singapore has implemented several measures to stimulate the country’s Fintech ecosystem (Alaassar et al., Citation2021). Finally, the importance of robust regulatory frameworks cannot be overstated as they ensure the secure and equitable use of digital finance and banking services. Policies should focus on aspects such as consumer protection, privacy, and cybersecurity while also promoting competition and innovation in the financial sector. A good reference point for this approach is Kenya’s policy regarding mobile money services, such as M-Pesa, which presents a remarkable example of a regulatory environment that encourages innovation while safeguarding consumer interests (Lashitew et al., Citation2019).
6. Concluding remarks
This study examines the influence of banking services and digital finance on wealth accumulation disparities among households, revealing diverse impacts based on the savings type. Households primarily use banking services for credit acquisition, not regular deposits, and digital finance appears to discourage bank savings unless integrated with bank services.
Exploring the savings quintiles, we find significant variations in households’ access to banking services at the lower end of the savings spectrum. However, digital finance does not significantly impact wealth accumulation among higher-saving households even when combined with banking services. This suggests that banking services and digital finance have diverse effects on household savings, depending on the initial savings level and type of savings.
The observed heterogeneity favoring households with lower initial savings suggests that banking services and digital finance can reduce savings disparities, thus supporting wealth accumulation and financial equality for lower-income households. Government incentives, including tax breaks for financial institutions serving lower-income populations, subsidies for financial literacy programs, and support for digital solution innovation could be instrumental in expanding access to these services. Therefore, government intervention can be critical to fostering an environment conducive to financial inclusion.
This study had several limitations that provide directions for future research. First, the scope of the study was limited, covering a relatively short period from 2016 to 2018, and the data were specific to Togo. This narrow focus hampers the ability to generalize the findings over an extended period or across diverse socioeconomic and cultural contexts. Second, there are unexplored factors that might influence wealth accumulation and savings disparities such as location, income, cultural background, and personal financial goals. These elements can significantly shape how households interact with the banking and digital finance services.
Disclosure statement
No potential conflict of interest was reported by the author(s).
Acknowledgement
The authors would like to express their sincere appreciation and thanks to the editor, the reviewing editor and four anonymous referees for their helpful comments and suggestions that have greatly helped to improve the paper.
Additional information
Notes on contributors
Koffi Sodokin
Koffi Sodokin is an Associate Professor at the Faculty of Economics of the University of Lome and member of the Research Center for Applied Economics and Management of Organisations (CREAMO). He has over ten years of experience teaching and supervising MSc students. His research focuses on money, finance, macroeconomics, and microeconomics of development.
Joseph Kokouvi Djafon
Joseph Kokouvi Djafon is a research assistant in the Research Center for Applied Economics and Management of Organisations (CREAMO) at the University of Lome-Togo. He has over 1 years of experience in field research focused on African countries. His research area includes Microeconomics, Development Economics, Banks and Finance.
Mawuli Kodjovi Couchoro
Mawuli K. Couchoro is a Full Professor and the Dean of the Faculty of Economics at the University of Lome and member of the Research Center for Applied Economics and Management of Organisations (CREAMO). He has over 15 years of teaching and research experience and supervision of Ph.D. and MSc students. His research interests include money, finance, macroeconomics, and microeconomics of development.
Akoété Ega Agbodji
Akoété Ega AGBODJI is a Full Professor at the Faculty of Economics of the University of Lome and member of the Research Center for Applied Economics and Management of Organisations (CREAMO). He has over 20 years of teaching and research experience and supervision of Ph.D. and MSc students. His research interests include microeconomics of development.
Notes
1. See Tables in appendix for details.
2. See Tables in appendix for details.
3. See Tables in appendix for details.
4. See Tables in appendix for details.
References
- Alaassar, A., Mention, A.-L., & Aas, T. H. (2021). Exploring a new incubation model for FinTechs: Regulatory sandboxes. Technovation, 103, 102237. https://doi.org/10.1016/j.technovation.2021.102237
- Allen, J., Carbo-Valverde, S., Chakravorti, S., Rodriguez-Fernandez, F., Ardic, O. P., & Bariviera, A. F. (2021). Assessing incentives to increase digital payment acceptance and usage: A machine learning approach. PLoS ONE, 16(12), e0276203. https://doi.org/10.1371/journal.pone.0276203
- Aportela, F. (1999). Effects of financial access on savings by low-income people. Mineo, Banco de Mexico.
- Atisophon, V., Bueren, J., De Paepe, G., Garroway, C., & Stijns, J.-P. (2011). Revisiting MDG cost estimates from a domestic resource mobilisation perspective. OECD Development Centre Research Areas: African Economic Outlook and Perspectives on Global Development. http://www.oecd.org/officialdocuments/publicdisplaydocumentpdf/?cote=DEV/DOC%282011%2902&doclanguage=en
- Bang, J., Mitra, A., & Wunnava, P. (2016). Do remittances improve income inequality? An instrumental variable quantile analysis of the Kenyan case. Economic Modeling, 58, 394–56. https://doi.org/10.1016/j.econmod.2016.04.004
- Bank for International Settlements (BIS). Committee on Payments and Market Infrastructures (CPMI) and World Bank Group. (2020). Payment aspects of financial inclusion in the fintech era. April 2020 Retrieved from https://www.bis.org/cpmi/publ/d191.pdf
- Baum, C. F., Schaffer, M. E., & Stillman, S. (2007). Enhanced routines for instrumental variables/GMM estimation and testing. The Stata Journal, 7(4), 465–506. https://doi.org/10.1177/1536867X0800700402
- Bayar, Y. (2014). Financial development and domestic savings in emerging Asian Countries. Theoretical and Applied Economics, 21(7), 55–66. https://www.researchgate.net/publication/333668204
- Beck, T., Demirguc-Kunt, A., & Levine, R. (2007). Finance, inequality and the poor. Journal of Economic Growth, 12(1), 27–49. https://doi.org/10.1007/s10887-007-9010-6
- Beck, T., Demirgüç-Kunt, A., & Merrouche, O. (2016). Islamic vs. conventional banking: Business model, efficiency and stability. Journal of Banking & Finance, 37(2), 433–447. https://doi.org/10.1016/j.jbankfin.2012.09.016
- Bharali, I., & Gill, I. (2019). Measuring the gap between ability and effort in domestic revenue mobilization. Future Development. Brookings Institution. https://www.brookings.edu/blog/future-development/2019/04/29/measuring-the-gap-between-ability-and-effort-in-domestic-revenue-mobilization/
- Bongomin, O. C., Ntayi, J. M., & Malinga, C. A. (2020). Analyzing the relationship between financial literacy and financial inclusion by microfinance banks in developing countries: Social network theoretical approach. International Journal of Sociology and Social Policy, 40(11/12), 1257–1277. https://doi.org/10.1108/IJSSP-12-2019-0262
- Brune, L., Giné, X., Goldberg, J., & Yang, D. (2014). Facilitating savings for Agriculture: Fields experimental evidence from Malawi. National Bureau of Economic Research Working Paper, 20946, 1–27. https://doi.org/10.3386/w20946
- Buenestado-Fernández, M., Ramírez-Montoya, M. S., Patiño, A., & Patiño, A. Digital competency as a key to the financial inclusion of young people in complex scenarios: A focus groups study. (2023). Research in Learning Technology, 22(1), 48–62. Advance online publication. https://doi.org/10.1177/14788047231170083
- Cameron, A., & Trivedi, P. (2005). Microeconometrics: Methods and applications. Cambridge University Press.
- Cengiz, O., & Manga, M. (2023). The influence of financial development on wealth inequality in capitalism: Fresh evidence from Emerging Countries. Research Square. https://doi.org/10.21203/rs.3.rs-2370989/v1
- Chatterjee, A., Czajka, L., & Gethin, A. (2021). Wealth inequality in South Africa, 1993-2017. The World Bank Economic Review, 36(1), 19–36. https://doi.org/10.1093/wber/lhab012
- Chernozhukov, V., & Hansen, C. (2008). Instrumental variable quantile regression: A robust inference approach. Journal of Econometrics, 142(1), 379–398. https://doi.org/10.1016/j.jeconom.2007.06.005
- Couchoro, M. K., Sodokin, K., & Koriko, M. (2021). Information and communication technologies, artificial intelligence, and the fight against money laundering in Africa. Strategic Change, 30(3), 281–291. https://doi.org/10.1002/jsc.2410
- Demirgüç-Kunt, A., & Klapper, L. (2013). Financial inclusion in Africa: An overview. In A. Ncube & Z. Brixiová (Eds.), Financial inclusion in Africa (pp. 31–73). Palgrave Macmillan.
- Dontsi, D. (2021). Les Effets DU système “Mobile Money” sur la Croissance Economique : Le cas des pays de la CEMAC. Journal of Small Business & Entrepreneurship, 35(1), 33–55. https://doi.org/10.1080/08276331.2021.1907699
- Dynan, K. E., Skinner, J., & Zeldes, S. P. (2004). Do the rich save more? Journal of Political Economy, 112(2), 397–444. https://doi.org/10.1086/381475
- Emara, N., & Kasa, H. (2020). The non-linear relationship between financial access and domestic savings: The case of emerging markets. Applied Economics, 53(3), 345–363. https://doi.org/10.1080/00036846.2020.1808174
- European Investment Bank. (2022). Finance in Africa: Navigating the financial landscape in turbulent times. Retrieved from https://www.eib.org/attachments/country/finance_in_africa_en.pdf
- Evans, O. (2018). Connecting the Poor: The internet, mobile phones and financial inclusion in Africa. Digital Policy, Regulation & Governance, 20(6), 568–581. https://doi.org/10.1108/DPRG-04-2018-0018
- Finmark. (2016). Finscope consumer survey Togo 2016, pocket guide (pp. 1–37). Retrieved from https://finmark.org.za/system/documents/files/000/000/255/original/Togo-pocket-guide_French_15-Feb-2017.pdf
- Friedman, M. (1957). The permanent income hypothesis. National Bureau of Economic Research. Retrieved from http://www.nber.org/chapters/c4405
- Gilenko, E., & Chernova, A. (2021). Saving behavior and financial literacy of Russian high school students: An application of a copula-based bivariate probit-regression approach. Children and Youth Services Review, 122, 105882. https://doi.org/10.1016/j.childyouth.2021.106122
- Horioka, C., & Terada-Hagiwara, A. (2012). The determinants and long-term projections of savings rates in developing Asia. Japan and the World Economy, 24(2), 128–137. https://doi.org/10.1016/j.japwor.2012.01.006
- Iftekhar, H., Horvath, R., & Mares, J. (2020). Finance and wealth inequality. International Money and Finance, 108, 102161. https://doi.org/10.1016/j.jimonfin.2020.102161
- INSEED. (2020). Note Synthétique sur les Résultats de Pauvreté-EHCVM 2018-2019. 1–5. Retrieved from https://fr.scribd.com/document/532742544/Pauvrete-EHCVM-Synthese-Des-Chiffres-de-Pauvrete-1
- International Monetary Fund. (2018). Regional economic Outlook: Sub-Saharan Africa. Domestic Revenue Mobilization and Private Investment, https://www.imf.org/en/Publications/REO/SSA/Issues/2018/04/30/sreo0518.
- International Monetary Fund. (2020). Togo: Sixth review under the extended credit facility arrangement and request for augmentation of access - press release; staff report; and statement by the executive director for togo. IMF Country Report No. 20/107. https://www.imf.org/en/Publications/CR/Issues/2020/05/13/Togo-Sixth-Review-Under-the-Extended-Credit-Facility-Arrangement-and-Request-for-Augmentation-49426
- Isukul, A., & Tantua, B. (2021). Financial inclusion in developing countries: Applying financial technology as a panacea. In M. Shahbaz, A. Soliman, & S. Ullah (Eds.), Economic growth and financial development (pp. 1–21). Springer International Publishing. https://doi.org/10.1007/978-3-030-79003-5_1
- Kaplan, D. M. (2022). Smoothed instrumental variables quantile regression. The Stata Journal, 22(2), 379–403. https://doi.org/10.1177/1536867X221106404
- Kaplan, D. M., & Sun, Y. (2017). Smoothed estimating equations for instrumental variables quantile regression. Econometric Theory, 33(1), 105–157. https://doi.org/10.1017/S0266466615000407
- Karlan, D., McConnell, M., Mullainathan, S., & Zinman, J. (2016). Getting to the top of mind: How reminders increase saving. Management Science, 62(12), 3393–3672. https://doi.org/10.1287/mnsc.2015.2296
- Keynes, J. M. (1936). The general theory of employment, interest and money. Palgrave Macmillan.
- Khandker, S., Koolwal, G., & Samad, H. (2010). Handbook on impact evaluation: Quantitative methods and pratices. World Bank. https://doi.org/10.1596/978-0-8213-8028-4
- Khera, P., Ng, S., Ogawa, S., & Sahay, R. (2021). Measuring digital financial inclusion in emerging market and developing economies: A new index. IMF Working Paper No. 2021/089. International Monetary Fund.
- Koenker, R., & Ng, P. (2005). Inequality constrained quantile regression. Indian Statistical Institute, 67(2), 418–440.
- Koomson, I., Villano, R. A., & Hadley, D. (2022). The role of fnancial literacy in households’ asset accumulation process: Evidence from Ghana. Review of Economics of the Household, 1–24. https://doi.org/10.2139/ssrn.4054089
- Kwak, S. (2010). The impact of intergovernmental incentives on student disability rate. Public Finance Review, 38(1), 41–73. https://doi.org/10.1177/1091142109358707
- Ky, S., C, R., & Sauviat, A. (2018). Does mobile money affect saving behaviour? Evidence from a developing country. Journal of African Economies, 27(3), 285–320. https://doi.org/10.1093/jafeco/ejx028
- Lashitew, A. A., van Tulder, R., & Liasse, Y. (2019). Mobile phones for financial inclusion: What explains the diffusion of mobile money innovations? Research Policy, 48(5), 1201–1215. https://doi.org/10.1016/j.respol.2018.12.010
- Li, J., Song, Q., Wu, Y., & Huang, B. (2021). The effects of online consumer credit on household consumption level and structure: Evidence from China. Journal of Consumer Affairs, 55(4), 1614–1632. https://doi.org/10.1111/joca.12390
- Loaba, S. (2022). The impact of mobile banking services on saving behavior in West Africa. Global Finance Journal, 53, 100620. https://doi.org/10.1016/j.gfj.2021.100620
- Lusardi, A. (2019). Money, financial literacy, and risk in the digital age: Evidence from ten European countries. Swiss Journal of Economics and Statistics, 155(1), 1–10. https://doi.org/10.1186/s41937-019-0027-5
- Lusardi, A., & Mitchell, O. S. (2014). The economic importance of financial literacy: Theory and evidence. Journal of Economic Literature, 52(1), 5–44. https://doi.org/10.1257/jel.52.1.5
- Merton, R. C., & Bodie, Z. (2005). Design of financial systems: Towards a synthesis of function and structure. Journal of Investment Management, 3(1), 1–23.
- Modigliani, F. (1966). The life cycle hypothesis of savings, the demand for wealth and the supply of capital. The Johns Hopkins University Press, 33(2), 160–217. https://www.jstor.org/stable/40969831
- Modigliani, F. (1986). Life Cycle, individual thrift, and the wealth of nations. American Association for the Advancement of Science, 234(4777), 704–713. https://doi.org/10.1126/science.234.4777.704
- Morawczynski, O. (2009). Exploring the usage and impact of “Transformational mobile financial services: The case of M-PESA”. Journal of Eastern African Studies, 3(3), 509–525. https://doi.org/10.1080/17531050903273768
- Mushtaq, R., & Bruneau, C. (2019). Microfinance, financial inclusion and ICT: Implications for poverty and inequality. Technology in Society, 59, 101154. https://doi.org/10.1016/j.techsoc.2019.101154
- Nandhi, M. A. (2012). Effects of mobile banking on the savings practices of low income users–The Indian experience. Institute for Money, Technology and Financial Inclusion. Retrieved from https://www.imtfi.uci.edu
- Osakwe, P. N., & Solleder, O. (2023). Wealth distribution, income inequality and financial inclusion: A panel data analysis. United Nations Conference on Trade and Development. Retrieved from https://unctad.org/system/files/official-document/wp-2023d3-no4_en.pdf
- Ouma, S., Odongo, T., & Were, M. (2017). Mobile financial services and financial inclusion: Is it a boon for savings mobilization? Review of Development Finance, 7(1), 29–35. https://doi.org/10.1016/j.rdf.2017.01.001
- Prina, S. (2015). Banking the poor via saving account: Evidence from a fields experiment. Journal of Development Economics, 115, 16–31. https://doi.org/10.1016/j.jdeveco.2015.01.004
- Rajan, R. G., & Zingales, L. (2003). Banks and markets: The changing character of European finance. In V. Gaspar, P. Hartmann, & O. Sleijpen (Eds.), The transformation of the European financial system (pp. 123–167). European Central Bank.
- Ray, K. K. (2022). Customer Perception Towards Pradhan Mantri Jan-Dhan Yojana (PMJDY): An empirical investigation from slum-dwellers perspective. Millennial Asia, 097639962211187. https://doi.org/10.1177/0976399622111872
- Robins, J., Sued, M., Lei-Gomez, Q., & Rotnitzky, A. (2007). Comment: Performance of double-robust estimators when “inverse probability” weights are highly variable. Statistical Science, 22(4), 544–559. https://doi.org/10.1214/07-STS227D
- Rosenbaum, P. R., & Rubin, D. B. (1985). Constructing a control group using multivariate matched sampling methods that incorporate the propensity score. The American Statistician, 39(1), 33–38. https://doi.org/10.1080/00031305.1985.10479383
- Ruud, P. (2000). An introduction to classical econometrics theory. Oxford University Press.
- Sachs, J. (2015). The age of sustainable development. Columbia University Press.
- Sahoo, P., & Dash, R. (2013). Financial sector development and domestic savings in South Asia. Economic Modelling, 33, 388–397. https://doi.org/10.1016/j.econmod.2013.04.018
- Skogqvist, J. (2019). The effect of mobile money on savings behaviors of the financially excluded. Sodertorn University.
- Sodokin, K. (2021). Comparative analysis, cash transfers, household investment and inequality reduction in Togo. Applied Economics, 53(23), 2598–2614. https://doi.org/10.1080/00036846.2020.1863324
- Sodokin, K. (2023). Public assistance, survival, and household trust during the containment period of the first wave of the SARS-CoV-2 pandemic in Togo. Journal of Social and Economic Development. https://doi.org/10.1007/s40847-023-00233-4
- Sodokin, K., Couchoro, M. K., & Tozo, K. W. (2022a). Macroeconomic channels of transmission of post-pandemic recovery strategies for African economies. Cogent Economics & Finance. https://doi.org/10.1080/23322039.2022.2125656
- Sodokin, K., Djafon, J., Dandonougbo, Y., Akapko, A., Couhoro, M., & Agbodji, A. (2023). Technological change, completeness of financing microstructures, and impact on well-being and income inequality. Telecommunications Policy, 47(6), 12571. https://doi.org/10.1016/j.telpol.2023.102571
- Sodokin, K., & Donou-Adonsou, C. (2010). Banks, Microfinance Institutions and Economic Growth in the West African Economic and Monetary Union. African Development Review, 22(4). https://doi.org/10.1111/j.1467-8268.2010.00245.x
- Sodokin, K., Koriko, M., Lawson, D. H., & Couchoro, M. K. (2022b). Digital transformation, banking stability, and financial inclusion in Sub-Saharan Africa. Strategic Change, 31(6), 623–637. https://doi.org/10.1002/jsc.2531
- Sodokin, K., & Nyatefe, V. (2021). Cash transfers, climate shocks vulnerability and households’ resilience in Togo. Discover Sustainability, 2(1), 1–25. https://doi.org/10.1007/s43621-021-00010-5
- Song, H., Yang, Y., & Tao, Z. (2020). How different types of financial service providers support small- and medium- enterprises under the impact of COVID-19 pandemic: from the perspective of expectancy theory. Frontiers of Business Research in China, 14(27). https://doi.org/10.1186/s11782-020-00095-1
- Stock, J., & Watson, M. (2020). Introduction to econometrics (International edition. 3rd ed.). Pearson/Addison Wesley.
- Suri, T., & Jack, W. (2016). The long-run poverty and gender impacts of mobile money. Science: Advanced Materials and Devices, 354(6317), 1288–1292. https://doi.org/10.1126/science.aah5309
- Tiwari, C., Goli, S., Siddiqui, M., & Salve, P. (2022). Poverty, wealth inequality and financial inclusion among castes in Hindu and Muslim communities in Uttar Pradesh, India. Journal of International Development, 34(6), 1227–1255. https://doi.org/10.1002/jid.3626
- von Fintel, D., & Orthofer, A. (2020). Wealth inequality and financial inclusion: Evidence from South African tax and survey records. Economic Modelling, 91, 568–578. https://doi.org/10.1016/j.econmod.2020.02.001
- Wamalwa, P. (2022). Financial inclusion, income, and wealth inequality in Kenya. Ghanaian Journal of Economics, 10(1). https://hdl.handle.net/10520/ejc-ghajecon_v10_n1_a1
- Wooldridge, J. (2007). Inverse probability weighted estimation for general missing data problems. Journal of Econometrics, 141(2), 1281–1301. https://doi.org/10.1016/j.jeconom.2007.02.002
- Wooldridge, J. (2015). Introductory Econometrics: A modern approach (5th ed.). South-Western.
- Yazid, M. (2007). Libéralisation financière et épargne des ménages : quel(s) lien(s)? (Financial Liberalization and Saving: Links and Evidence from Algeria). Cahiers du CREAD. http://doi.org/10.2139/ssrn.3468465
Appendix
Figure A1. The dot plot.
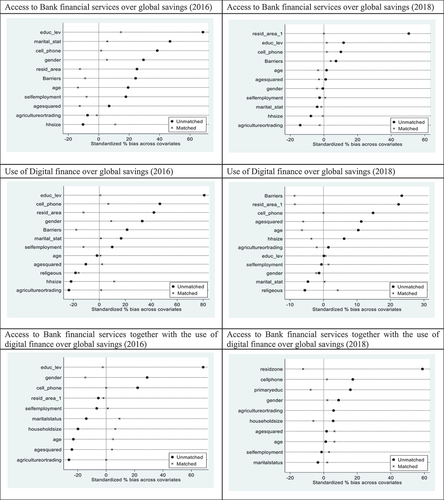
Table A1. Propensity Score Matching with Double Difference for Access to Bank financial services
Table A2. Propensity Score Matching with Double Difference for Digital financial use
Table A3. Propensity Score Matching with Double Difference for Access to Bank financial services with Digital financial use
Table A4. Impact of Access to Bank financial services on Global savings of Togolese households
Table A5. Impact of Access to Bank financial services on Bank savings of Togolese households
Table A6. Impact of Access to Bank financial services on Investment in physical assets of Togolese households
Table A7. Impact of Digital finance use on Global savings of Togolese households
Table A8. Impact of Digital finance use on Bank savings of Togolese households
Table A9. Impact of Digital finance use on Investment in physical assets of Togolese households
Table A10. Impact of Access to Bank financial services with Digital finance use on Global savings of Togolese households
Table A11. Impact of Access to Bank financial services with Digital finance use on Banks savings of Togolese households
Table A12. Impact of Access to Bank financial services with Digital finance use on Investment in physical assets of Togolese households