
 ?Mathematical formulae have been encoded as MathML and are displayed in this HTML version using MathJax in order to improve their display. Uncheck the box to turn MathJax off. This feature requires Javascript. Click on a formula to zoom.
Abstract
The government and other development practitioners in Ethiopia have promoted crop technologies like improved tef varieties to improve crop productivity of farmers and, in turn, their commercialization status. The commercialization impacts of these crops, however, were not thoroughly examined. This study examined the commercialization impact of adopting improved tef variety (Korra) in North-western Ethiopia using cross-sectional data of 479 tef producer farm households drawn from two districts, one from the adopters and the other from non-adopters. A multi-stage sampling procedure was followed to select the respondents. A semi-structured questionnaire was used as a principal primary data collection method to collect household survey data, and interviews were conducted with the relevant key informants of the study. The extent of smallholder commercialization was examined using the Household Commercialization Index (HCI), and the impact of Korra tef adoption on adopters’ commercialization was estimated using Propensity Score Matching (PSM). The HCI result revealed that 46.95% of sampled farmers sold tef during 2020; while it was 58.92% and 36.7% for the adopters and non-adopters, respectively. This indicated that the non-adopters and adopters were, respectively, semi- and commercialized. The PSM result also revealed a positive and significant impact on households’ tef commercialization, with the adopters’ commercialization rate exceeding the non-adopters by about 23.43%. Hence, efforts should focus on ensuring that farmers have access to sufficient quantities of high-quality improved Korra tef seed as well as encouraging improved access to institutional services for the same.
PUBLIC INTEREST STATEMENT
Tef (Eragrostis tef) is a staple food in the country, commonly used to prepare `Enjera`, the main public dish. As one of the newest superfoods of the twenty-first century, like the ancient Andean grain quinoa, its global adoption is rapidly increasing, and it is now riding the gluten-free wave as the next super grain on the market. With this, it is expected to become a new super crop, increasing global demand; and possibly the next super grain, and `Enjera` may be the world`s next superfood. However, little investment has been made to improve crop productivity or expand its market, and its desired contribution to improving producers` commercialization status is alleged to be inadequate. To that end, it is widely acknowledged that the lack of adoption of the high-yielding tef variety is one of the major reasons for the slow progress of its productivity and commercialization. As a result, the purpose of this research is to investigate the commercialization impact of the new tef variety called Korra on smallholder farmers.
1. Introduction
Agriculture is a mainstay of the Ethiopian economy. Through its contribution to employment, foreign exchange profits, industrial inputs, and food production, it has continued to play a significant role in the economy. Around 79% of the population is employed therein, it accounts for 79% of foreign earnings, contributes 27.5 billion dollars or around 33.88% of the GDP, and is the main source of raw materials and capital for investment and the market (Diriba, Citation2020; O’Neill, Citation2021; Wendimu, Citation2021). As a result, it has a huge impact on a considerable number of people’s livelihoods, food security, reduction of poverty, employment, income, socioeconomic development, and environmental sustainability (Diriba, Citation2020; Shikur, Citation2020; Welteji, Citation2018). However, the country’s smallholder farmers, who constitute the bulk of the rural poor of whom only 14% possess more than 2 hectares of farmland, are not fully benefited from the multiple functions of agriculture (Diriba, Citation2020; Wendimu, Citation2021). Only households that farm more than two hectares of land are currently able to achieve basic subsistence under normal circumstances (Diriba, Citation2020). Due to the practice of subsistence-oriented agriculture, studies showed that the majority of the country’s smallholder farmers have been excluded from the formal market system and corresponding income-mediated privileges (Beyene, Citation2018; Demeke & Haji, Citation2014). As a result, the level of agricultural commercialization for smallholders in the country remained low (Alemu & Berhanu, Citation2018; Tesfahun et al., Citation2021).
Since smallholder commercialization is the major pathway from a semi-subsistence agrarian society to a more diversified and food-secure economy, most development practitioners view it as a critical component of the structural transformation (Orr et al., Citation2021). Additionally, it is argued that smallholder commercialization can greatly increase income and welfare, support overall economic expansion, and lessen poverty (Shadreck et al., Citation2013). It is crucial for the development and expansion of economies of countries that depend heavily on agriculture (Cheber, Citation2018). In Ethiopia, one of the agrarian countries, the government’s agricultural development policies and plans have long been focused on transforming smallholder farmers’ subsistence-oriented production system into a market-oriented production system (Aman et al., Citation2014; Gebre-Ab, Citation2006). For example, to increase competitiveness in domestic, regional, and global markets, the Growth and Transformation Plans (GTP I and II) implemented from 2010–11 to 2019–2020 have encouraged the production and marketing of high-value agricultural products. As a result, significant resources have been channeled toward agricultural commercialization through regular agricultural extension activities and with the assistance of development partners (Gebremedhin & Jaleta, Citation2010; Getahun, Citation2020; Tesfahun et al., Citation2021).
One of the government’s partners in agricultural development is the Agricultural Growth Program phase 2 (AGP II). The program has promoted and supplied improved agricultural inputs to help smallholder commercialization and shift their production from subsistence to a market-oriented economy. According to the 2015 Program Design Document, the distribution and marketing of agricultural inputs would help farmers access the market by affecting the quantity and quality of their produce (MoA(a), Citation2015). With this justification, the program has focused on agriculturally promising areas while taking into account typical farm activities in the selected areas. In light of this, Wara-Jarsoworeda,Footnote1 the area where this study was conducted, is one of the program’s intervention areas basing the fact that tef (Eragrostis tef) is a common crop that is cultivated in all agro-ecological zones and altitudes of the area, and as the area is considered a potential for greater tef production.
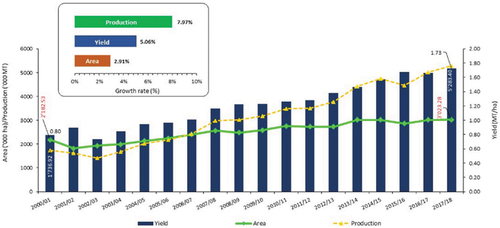
Ethiopia is the largest tef producer in the world (Lee, Citation2018). Tef is the most popularly grown and consumed cereal in Ethiopia. The crop has the largest area under cultivation, making up 29.5% of all cultivated land and producing 19.7% of all cereals (Diriba, Citation2020). Likewise, it is the main staple food crop in the study area and ranked first in terms of its contribution to overall grain output and market share, with wheat coming in second (Wara Jarso woreda Agriculture and Natural Resource Office, Citation2019). Besides home consumption, it is used as a cash crop, animal feed, and construction material. Its high resilience capacity withstanding periods of drought and flood as it attracts few insect pests and diseases, and its minimal post-harvest loss all increase its importance (Fufa et al., Citation2011; Minten et al., Citation2018). Solomon et al., (Citation2019) computed its trend of cultivation and production in Ethiopia from statistical reports of the Central Statistical Agency (CSA) of Ethiopia for the years 2000/01–2017/18 in which its increments in area, yield, and output have been demonstrated (Figure ).
Figure 1. Trend of tef cultivation and production in Ethiopia from 2000 to 2018 (Solomon et al., Citation2019, p. 755).
However, Ethiopia has yet to tap its tef production and market potential and develop an efficient tef value chain and marketing scheme (Lee, Citation2018). Grounded on this, AGP II has distributed the new high-yielding tef variety known as “Korra” in the study area as part of its strategy to enhance the crop productivity and commercialization of tef producer farmers. Despite the advocacy and promotion for the adoption of improved tef varieties by development practitioners like AGP II, studies examining the commercialization impacts of the adoption of improved tef varieties in general and Korra tef variety in particular on adopter farmers are uncommon. Additionally, previous studies on smallholder commercialization have neglected the commercialization impacts of the adoption of improved seed types in favor of focusing primarily on their market orientation and engagement. Some studies have indeed examined smallholder commercialization (Afework & Endrias, Citation2016; Gebre-Ab, Citation2006), the challenges they encounter (Boka, Citation2017), and the potential for sustainable intensification (Mutyasira, Citation2020). Others highlighted the smallholder commercialization processes, determinants, and impacts by emphasizing tef, wheat, maize, and other horticulture crops (Aman et al., Citation2014; Edosa, Citation2018; Endalew et al., Citation2020; Gebreselassie & Sharp, Citation2007; Getahun et al., Citation2019; Jaleta et al., Citation2009). Generally, little evidence exists on the commercialization impacts of producing tef in general and Korra tef variety in particular. Therefore, this study is planned to investigate the commercialization impact of the adoption of the Korra tef variety on smallholder farmers in Wara-Jarso woreda, North-Western Ethiopia, taking into account the Korra tef variety as a crop technology. Information on the impact of the tef‘s commercialization is needed to help the government in its efforts to encourage the adoption of improved tef varieties in general and its commercialization in particular.
1.1. Conceptual framework
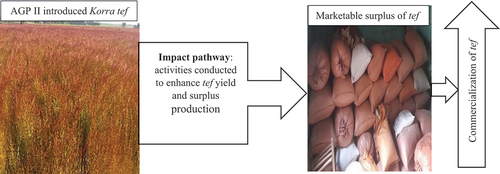
Based on studies that examined the impact of crop technology adoption on farm households’ status of crop commercialization, we developed the conceptual framework shown in Figure (Afework & Endrias, Citation2016; Assefa, Citation2022; Gebremedhin & Jaleta, Citation2010; Gerezgiher, Citation2016; Mazengia, Citation2016; Poulton, Citation2017; Shadreck et al., Citation2013; Tadele et al., Citation2017; Taffesse et al., Citation2012). To compare the characteristics of adopters and non-adopters of the Korra tef, we first identified the demographic, socioeconomic, and institutional traits that both groups’ farm households had in common on the left. The idea that the use of Korra tef leads to the production of surplus products, which in turn enables an improved tef commercialization, is given on the right side. Therefore, our conceptual framework’s main thesis is founded on the hypothesis that because the adopter and non-adopter farm households are often comparable in terms of the aforementioned characteristics, it is expected that the adoption of Korra tef has a positive impact on the commercialization of tef for the adopters through an increase in its yield.
2. Research methodology
2.1. Description of the study area
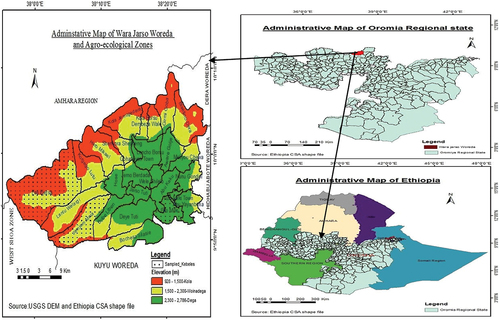
The study area was Wara-Jarso woreda. It is one of the woredas of the Oromia regional state in North-West Ethiopia. It is geographically located between 9°49’59.99“North latitude and 38° 14’ 60.00” East longitude (Figure ). Highland (7.3%), temperate (43.4%), and lowland (49.5%) are the three major agro-ecologies of the area (National Meteorological Agency of Ethiopia [NMAE], Citation2020). The woreda‘s diverse agro-climatic zones allowed local farmers to practice mixed farming and grow a range of crops. The major cereal crops grown in the woreda include tef, wheat, maize, and sorghum. The area is renowned for its greater production of tef, and the crop is grown in all agro-climatic zones of the area.
Figure 2. Korra tef adoption and farm households’ commercialization.
2.2. Research design and ethical procedures
The study used a mixed-methods research approach with a cross-sectional time frame. As per the Concurrent Embedded Strategy of the mixed method, the survey data was used as a guide and the qualitative data were embedded within the survey data to support the descriptive and explanatory functions (Creswell & Creswell, Citation2017). The Center for Rural Development Studies at Addis Ababa University provided ethical approval and clearance that were necessary to satisfy the ethical requirements for scientific research. Based on this, the aim and length of the study, and the right to stop participation at any time were all told to the study participants so that they could feel free to choose whether to participate in the study without facing any consequences or negative effects. Additionally, they were told that any information they provide will be held in the utmost secrecy that data will only be presented aggregately, and responses will not be linked to them on an individual basis. Based on these, the required data were collected after the verbal and written consents of the key informants and survey respondents were obtained.
2.3. Sampling procedures and data sources
The study’s target population was Wara-Jarso woreda“s Korra tef producer households. The sample households were selected by using a multi-stage sampling method. First, the study woreda was selected purposefully. Second, Korra tef adopters were identified with the assistance of the study woreda s AGP II coordination office and the DAs. Two kebelesFootnote2 from each agroecological zone were chosen based on the alleged classifications of high and medium Korra tef growers, and to ensure sample representativeness. As a result, the study kebeles were found to be six. The same procedures were employed to select the control woreda, the nearby Kuyu woreda, the respective kebeles, and the corresponding households within each kebele to estimate the counterfactual data. Tef producers, however, replaced the Korra tef producers criterion. Likewise, Kuyu woreda comprises three main agroecological zones and is comparable to Wara-Jarso woreda in terms of the crops grown there as well as other institutional, cultural, and socio-economic aspects. The lists of farm households for both groups were compiled by using the official records of the study kebeles. The sample size was computed by” (Yamane, Citation1967)s subsequent sample size determination formula on account of the finite character of the population under study.
Finally, 479 farm households were obtained with the 95% desired level of precision. 221 adopters from the treatment group and 248 non-adopters from the control group were selected to keep a balance between the two groups for the use of an impact assessment model. As shown in Table , the sample sizes in each kebele were calculated using the Probability Proportionate to Size (PPS) of the identified number of farm households.
Table 1. Distribution of population and sample households across the study kebeles
As it is indicated in the introduction section, tef is the most widely grown crop in the study area and is produced in all of its agro-climatic zones. Thus, AGP II has introduced the Korra tef variety into the study area as part of its effort to increase the yield and commercialization of tef. Non-mechanized farming and subsistence agriculture characterize the area, and farmers in the area are comparable in terms of the size of their farmland, credit use, livestock ownership, market distance, and family size among others. The program particularly considered the area because of its significant potential for tef production. Farm households in the area were chosen for the adoption of Korra tef based on several factors, including their willingness to grow it on a minimum of one hectare and to consult with local development agencies, and their level of readiness for the practice. Thus, provided that the program has apparent criteria for the selection of beneficiaries and the study accordingly considers these criteria, the probability of possessing a selection bias is narrow. In other words, even though the study area is purposively selected, the selection of samples from both adopter and non-adopter groups was randomly conducted. This in turn marks the non-occurrence of selection bias.
The study used both primary and secondary data. The main primary data (i.e. quantitative data) were collected from the Korra tef producers in the treatment woreda and non-Korra tef producers in the control woreda. The data was collected in September and October of 2020 using paper versions of semi-structured questions and trained enumerators. The questionnaire was originally developed in English, translated into Afan Oromo, and interviewed by the latter. A pilot test was conducted to determine whether the survey tool is well comprehended by the real responders. The supporting primary data (i.e. qualitative data) was obtained from DAs from each agro-ecology zone, the regional AGP II monitoring and evaluation officer, the zonal AGP II facilitator, the study woreda‘s AGP II coordinator, and six Korra tef producer farmers (two farmers from each agro-ecology labeled as high and medium producers). The study’s lead investigator collected it by using interview guides. Relevant journal articles, websites, and the study woreda‘s AGP II coordinating office were visited to obtain secondary data.
2.4. Tools and techniques of data analysis
Both econometric analysis and descriptive statistics were used to examine the quantitative data. The STATA version 16 Software Package was used for the analysis. The qualitative data were used to substantiate the interpretation of quantitative data. The demographic, socioeconomic, and institutional characteristics of farm households were examined and described using descriptive statistical analysis techniques like mean, standard deviation, proportions, frequency, and percentages. Gebremedhin & Jaleta, (Citation2010); Gerezgiher, (Citation2016); Govereh et al., (Citation1999); Osmani et al., (Citation2014) determined the level of commercialization in each household using HCI. Household Commercialization Index measures the ratio of the gross value of crop sales by household i in year j to the gross value of all crops produced by the same household i in the same year j, expressed in percentage.
As to them, the benefit of such a measure is that commercialization is regarded as a continuum, avoiding the crude distinction between households that are “commercialized” and those that are “non-commercialized.” It gives the degree of commercialization for each household individually. HCI has a value between 0 and 100%. A household that is entirely subsistence-oriented would have a value of zero, and the closer the index is to 100, the more commercialized the household is. As a result, this study has used the above indicator to determine how much more market-oriented the households of Korra tef adopters are than non-adopters.
The commercialization impact of Korra tef was measured by the method of Propensity Score Matching (PSM). The model was chosen due to the lack of baseline data and the ability of the matching technique to account for observed selectivity. It was also decided to examine the impact of receiving treatment (in this case, the Korra tef) since the random assignment of treatments to subjects is not feasible in this study. The conclusion was drawn from the Korra tef adopters based on the comparison with the non-adopter farm households. Hence, we turn in to determining the average treatment effect on the treated (ATT) since it is hard to know the outcomes for adopters when they have not adopted and non-adopters when they have adopted. According to (Rubin, Citation2001), the average treatment effect (ATE) can be calculated as follows:
The above equation) assumes that the commercialization level of the adopters before their adoption E (Y0 |D = 1) can be approximated by the commercialization level of non-adopters at times of data collection E (Y0 |D = 0). However, it is hard to precisely estimate ATE using the above-stated equation as we do not observe E (Y0 |D = 1) yet we do observe E (Y1 |D = 1) and (E (Y0 |D = 0). Additionally, the presence of self-selection bias emanating from the adoption of Korra through the placement of AGP II may result in a biased estimation. In other words, in the context of this study, the households considered in the treated group came into the category of adopters through the program placement of the AGP II. As a result, they are less likely to be statistically equivalent to the comparison group. In such a case, PSM adjusts for selection bias, minimizes the limitation from matching on many observed variables, and estimates counterfactual effects. The propensity score, p(x) conditional on a set of characteristics x according to (Rosenbaum & Rubin, Citation1983) is given as:
Where, d = {0, 1} is the indicator of exposure to treatment and
x is the multidimensional vector of pre-treatment characteristics.
Econometric literature suggests that the soundness of the outputs of the PSM method depends on the employability of two basic assumptions namely: the Conditional Independence Assumption (CIA) and the Common Support Condition (CSC). CIA (also known as Unconfoundedness Assumption) notes that the potential outcome variable (YO) is independent of the treatment status (adoption of Korra) conditional on a set of observable variables x. Thus, it is important to precisely detect the impact as it considers the difference between the treated and control groups to reduce the selection bias. This allows the units from the control group to be used to construct a counterfactual for the treatment group. The assumption of common support, on the other hand, enables appropriate comparison by facilitating a sufficient overlap in the features of the treated and untreated units to find adequate matches. Since the impact estimates calculated using propensity scores are highly sensitive to the matching method itself, robustness can be further improved by bounding matches only to adopters and non-adopters who have common support in the distribution of propensity scores (Smith & Todd, Citation2005). Hence, the four commonly used matching algorithms, namely nearest neighbor, radius, caliper, and kernel matchings were employed to find the optimal estimation model for the commercialization impact of adopting the Korra tef variety.
2.5. Definition of variables and working hypothesis
Commercialization of the study area’s smallholder farmers is a dependent variable, indicated by HCI, which is measured as the ratio of the gross value of Korra tef sales to the gross value of the Korra tef produced by the AGP II beneficiary smallholder farmers in the 2011/12 E.C cropping season, expressed in percentage. The use of Korra tef variety is the treatment variable of the study. A review of the theoretical and empirical literature on household commercialization indicated that the characteristics shown in Table are influencing the commercialization of smallholder farmers, and are considered the independent variables of the study.
Table 2. Definition and measurements of the independent variables used in the study
3. Results and discussion
3.1. Descriptive results
Tables give the summary statistics of the chi-square (x2) and t-test of the selected variables believed to be relevant in demonstrating the commercialization characteristics of the surveyed households. The x2 was used to test relationships between dummy and/or categorical variables (Table ), and the means of continuous variables are reported based on the adoption status of the study households (Table ). The explanatory variables used for estimation in the model were selected from these variables.
Table 3. Statistical summary of x2-test distribution for dummy and categorical variables
Table 4. Statistical summary of t-test for continuous variables
The analysis covers 479 households in total, of whom 221 (46.14%) adopt the Korra tef variety in 2020 and 258 (53.86%) do not. As shown in Table , a statistically insignificant difference was observed in the gender of the household heads of the two groups. However, 90.81% of the sample households are male-headed. This perhaps plays a positive role for both groups tef commercialization since male-headed households are believed to have a higher chance to participate in the market than women-headed due to higher social networks (Gebreselassie & Ludi, Citation2008). The x2 results also revealed a statistically insignificant difference in terms of their access to credit services, and whether they have attended a formal education or not. Whereas the two groups vary in terms of their marital status, and the cooperative and/or association they largely engaged in.
Access to market information could be an important factor in commercialization since it presents farmers with a range of options. With this, ownership of functional radio is imperative in the dissemination of information hence affecting smallholders’ commercialization. The majority of farm households, 264 (55.11%), lacked a functional radio. Only 111 (50.23%) adopters and 104 (40.31%) non-adopters, respectively, have functional radios. The qualitative data showed that most of the households in the area listened to both agricultural and non-agricultural programs. This may imply that households with access to information (whether agricultural or non-agricultural) are aware of numerous methods for improving the commercialization of their tef.
A significant difference was found between the groups in terms of experiences they have in tef farming and the average size of their families. The total sizes of farmland, livestock owned, average distance household travel from home to Farmers Training Center (FTC) and from home to input-output market, as well as the amounts of remittances received, are all comparable. The income from non-farm activities, however, shows a statistically insignificant difference between the two groups, suggesting that the non-farm income both groups received might be equally correlated with households’ level of commercialization or decision to sell their tef. The simple comparison of the two groups of households indicated that adopters and non-adopters differ significantly by the majority of the factors chosen as relevant to explain them (i.e. statistically significantly different in 10 variables and showed no significant difference in 3 variables) (see Tables ).
3.1.1. Farm inputs used in tef production
In the literature on smallholder commercialization, commercialization of the output side is often realized with the precondition of commercialization on the input side (Gebremedhin & Jaleta, Citation2010). It is also assumed that the use of improved farming inputs increases output-side commercialization (Getahun et al., Citation2019). In light of such allegations, describing farm inputs used for the production of tef is imperative. Farmers of the study area used different inputs for tef production in 2020. The common farm inputs used include improved seed, fertilizers, herbicides, insecticides, soil fertility reclamation, compost, and labor. The analysis took into account the costs of these inputs (by ETB) at the time.
As shown in Table , an average of 22.43 kg of improved seed and 91.93 kg and 109.3 kg of DAP and urea, respectively were used per hectare. On average, herbicide and pesticide used per hectare were 0.99 and 1.07 liters, respectively. Generally, the t-test result revealed a significant mean difference between the groups in the uses of the selected inputs at the p values of less than 0.01 and 0.05 in which the inputs usages of the adopter significantly surpassed their non-adopter counterparts except in the case of seed usage. The key informants as well confirmed the survey result that the Korra tef variety reduces the amount of seed sowed per hectare. In congruent with the survey result indicated in Table , a higher fertilizer usage of the Korra tef variety in general, and more usage of Urea than DAP, in particular, were also reported by all the key informants. As to them, the relatively higher usage of Urea has emanated from the fact that they added Urea twice and DAP only once. Thus, the adopters’ increased fertilizer use could have been influenced by the Korra tef variety’s higher fertilizer consumption. The same is true for the use of herbicide and pesticide; the key informants added that using the Korra tef variety has urged them to use more of these than they would have otherwise.
Table 5. Average input use for tef production by respondent types (kg or liter/ha)
Except for the applications of soil fertility reclamation and compost, significant mean differences between the two groups were observed in the costs of other major inputs used to produce tef (Table ). To begin with the cost of seed, some possible causes include the fact that 1 kg of Korra tef cost higher back then than other tef varieties—its price ranged from 48 to 52 ETB per kg, compared to its contemporaries’ range of 37 to 48 ETB—and the disparity in seed use between the two. The tiny differences in the costs of the fertilizers for the two groups could also emanate from the amount of their utilization since comparable prices of fertilizers were reported.
Table 6. Average input costs of tef production by respondent types (ETB/ha)
The key informants also confirmed that using more insecticide and herbicide on the Korra tef farm has increased the cost of production compared to growing other tef varieties. The mean difference in labor costs is in agreement with the qualitative finding that the production of the Korra tef variety needs more labor than the production of other tef varieties. This is in line with studies by (Abate et al., Citation2015; Coelli et al., Citation2005) which reported that higher-yielding varieties needed more labor but produced more output per unit of labor. As both groups engage in various soil erosion prevention techniques and supplement agricultural land with organic matter to increase its potential, the closeness in the costs of soil fertility restoration and compost could be signs of the presence of comparable soil types. The exceptions in the costs of soil fertility reclamation and compost could be indicators of the presence of comparable soil types as both groups correspondingly engage in various soil erosion prevention techniques and supplement agricultural land with organic matter to increase its potential.
Overall, a significant difference was observed between adopters and non-adopters in terms of the overall cost of tef production in the cropping season of 2020. This is in agreement with the assertion of key informants that the Korra tef farm incurs higher costs than the indigenous tef varieties. Similar findings came from a study on the Boset tef variety, where greater production expenses, particularly for fertilizer and seed, were noted (Natnael, Citation2019). Another study on Korra and Boset tef has consistently shown that they have a higher variable cost of production than local tef variants (Bekele et al., Citation2019).
3.1.2. Tef production and income
The mean production of tef for adopters and non-adopters were 2037.63 and 1434.26 quintals with standard deviations of 169.01 and 132.44, respectively (Table ). At a 1% level of significance, the result showed a significant mean difference between the tef produced by the groups. Even though it is impossible to infer causality from a mere descriptive finding, respondents who adopted the Korra tef have higher tef income. The average net income reported by all respondents from the tef farm was 48,354.46 Ethiopian Birr (ETB). The adopters’ and non-adopters average net earnings were 64,310.19 ETB and 34,686.96 ETB, respectively, and at a 1% probability level, there was a significant mean difference between the two groups.
Table 7. Average tef production and net income by respondent types
The mean production of tef for adopters and non-adopters was 2037.63 and 1434.26 quintals with standard deviations of 169.01 and 132.44, respectively (Table ). The result indicated the significant mean difference between tef produced by the groups at a 1% significance level. Even though a causal relationship cannot be exclusively generated from a mere descriptive finding, respondents who adopted Korra tef earn more tef income. The average net income reported by all respondents from the tef farm was 48,354.46 Ethiopian Birr (ETB). The adopters’ and non-adopters average net earnings were 64,310.19 ETB and 34,686.96 ETB, respectively, and, there was a significant mean difference between the two groups at a 1% probability level.
3.1.3. Categories and levels of commercialization of tef producers
Based on the taxonomy of commercialization by (Samuel and Kay, Citation2008; Tadele et al., Citation2017), the commercialization of smallholders is grouped into three categories: less commercialized farmers (those who sell up to 25% of their output), semi-commercialized farmers (those who sell between 25% and 50% of their output) and commercialized farmers (those who sell more than 50% of their output). The results showed that the majority of the sample households − 226 (47.12%)—are commercialized farmers and that 80 (16.70%) of them fall into the category of 1–25% commercialization index, suggesting that they are less commercialized in terms of tef output. Among 226 farm households in the category of “commercialized farmers”, the majority of them 190 (84.07%) belong to the adopter category selling up to 75.75% of their tef yield, while the remaining 36 (15.93%) are from the non-adopter category selling up to 66.67% of their tef produce (Tables ).
Table 8. Categories of commercialization of tef producers in 2020
Table 9. HCI of tef producers in 2020
Table presents the results that show the aggregate levels of household tef commercialization in the study areas. Considering the gross value of tef sold, the overall average level of commercialization of the Korra tef growers in the study area was 46.95%. This result is consistent with the national average which is about 46.53% of tef produced are sold in Ethiopia as reported by (CSA, Citation2020). It is also comparable with the findings of (Assefa, Citation2022; Degefa et al., Citation2022; Eshetu, Citation2018; Getahun et al., Citation2019), but outdistances some and lags behind others. This situation could be attributed to the reason that tef is the most commonly grown crop and used for consumption in the area. The qualitative data also evidenced that tef is extensively consumed and valued as a cash crop by local farmers. On the other hand, the HCIs were 58.92% and 36.7% for the adopters and non-adopters, respectively. This suggests that adopter and non-adopter farmers in the study areas sold 58.92% and 36.7% of their tef yield, respectively. This in turn indicates that the extent of commercialization of the adopter and non-adopter households, in general, was in the categories of commercialized and semi-commercial farmers, respectively. The adoption of the Korra tef variety could be attributed to the fact that adopter households are more commercially successful than non-adopter households. This is also an indicator that the adoption of Korra tef variety could be vital in enhancing its marketing. Detail of the impact of Korra on its growers’ commercialization status is addressed by the subsequent econometric analysis.
Figure shows the kernel density estimates of the commercialization index of the adopters, denoted by the red color, and non-adopters by the blue color.
3.2. Impact of Korra tef‘s variety on smallholder farmers’ commercialization
Hypothesis:
The adoption of the Korra tef variety increases the commercialization of tef in adopter farm households.
As indicated in the aforementioned hypothesis, the commercialization status of tef producer households is the outcome variable used to calculate the commercialization impact of adopting the Korra tef variety. The treatment and control groups, respectively, were households that adopted Korra tef and households that did not. The results of the counterfactual control, which is non-adoption, were compared to the observed outcomes of adoption of the Korra tef variety using the PSM. With this, the average treatment effects on the treated (ATT) is estimated purely emphasizing the effects of the adoption of Korra tef variety on the adopters. Since the intention of using the PSM is to develop an index that can be used to match the adopters and non-adopters, the choice of variables to be included in the propensity score estimation is key. Thus, basing the (Heckman et al., Citation1997) s notion that omitting important variables can increase the bias in the processes of estimation, demographic, socioeconomic, and institutional factors that are unaffected by whether a factor is adopted or not were chosen to determine the impact that adoption of the Korra tef variety has on the status of households tef commercialization (see Tables ). Yet, significant differences were found between the two groups in 10 of the 13 chosen variables (see Tables ). Fortunately, the PSM enables the extraction of a set of comparable households from non-adopters.
Before estimating the propensity score for the adopter and non-adopter households, the hypothesized explanatory variables were examined for the likelihood of multicollinearity. Tests of the Variance Inflation Factor (VIF) for continuous variables and Contingency Coefficient (C) for discrete variables were thus employed. The results showed that the value of VIF for each of the continuous variables was found to be less than 1.21 with a mean value of 1.09 (Appendix 1), and the value of C for the discrete variables did not exceed 0.75 (Appendix 2), indicating the independence of the study variables from one another (Tattao, Citation2007). Hence, there is no multicollinearity problem among all the conjectured explanatory variables included in the model. This gives us the assurance we need that the model is devoid of multicollinearity issues, enabling us to move forward with the regression.
3.2.1. Estimation of propensity score
A probit regression model was used to estimate the p-score of the selected variables for the adopter and non-adopter households. The p-score result shows that the two groups are statistically different in all explanatory variables except gender, marital status, access to credit, and income from non-farm activities (Table ). However, a high degree of covariate balance between the treatment and control samples is required before the estimation of the impact. Hence, it is implied that the variables need to be corrected before the estimation of ATT.
Table 10. Results of the propensity score of the two groups
3.2.2. Testing the balance of propensity score and covariates
As shown in Table , except for variables of sex, marital status, access to credit, and income from non-farm activities, the two groups significantly differed in other variables selected for estimating households’ commercialization status. The difference between them, however, was kept to a minimum after matching since the percentage of bias dropped from the ranges of 1.6 and 45.6 before matching to the ranges of 0.2 and 6.8 after matching. As a result, the percentage of bias has minimized to the level where it falls below the 20% cutoff point (Rosenbaum & Rubin, Citation1983), indicating the absence of a statistically significant correlation between the controlled and treated groups. The p-values in Table show the variations in the selected variables before and after matching, where the covariates of the variables exhibited significant differences were balanced. The presence of a balance of covariates between the two groups in turn allows for further impact estimation procedures.
Table 11. Propensity score and covariate matching for the variables used
3.2.3. Choice of matching algorithm
For a relatively better estimation algorithm, the four major matching estimators were tried with different bandwidths and trim levels by considering the PSM assumptions that the percentage of mean bias and value should be < 5 % and β < 25%, respectively (Caliendo & Kopeinig, Citation2008). As shown in Appendix 3, many of the matching estimates have fitted the’ (Rubin, Citation2001)s suggestion of the required balance in which the value of B is expected to lie below 25, of R between 0.5 and 2, and the mean bias below 5. All estimation algorithms have shown insignificant LR chi2, which is considered an additional indicator for the presence of a high degree of covariate balance between the adopters and non-adopters that are ready for use in the estimation process. The values of Ps R2 are also lower in all of the estimators. Nevertheless, we opted for the Kernel estimation algorithm with Bandwidth (0.1) as it has shown the lowest Ps R2, mean bias, and B and R values. A relatively lower Ps R2 (0.002 in the estimator we choose) confirms that adopter households do not exhibit many divergent characteristics.
Furthermore, as per the Minima and Maxima criterion, those observations whose propensity score is both smaller than and larger than that of the opposing group were eliminated while determining the common support region (Caliendo & Kopeinig, Citation2008). Fortunately, only six observations were shown outside of the common support region in all matching estimators calculated. As a result, observations whose propensity score is lower than the minimum of 0.065 and higher than the maximum of 0.893 in the opposite group were not included for matching (Table ).
Table 12. Distribution of estimated propensity scores
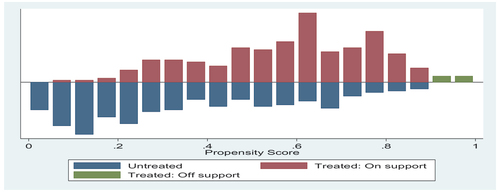
The propensity score of the density of distribution in adopters and non-adopters, as graphically depicted in Figure , indicates the presence of a wide common support region and the reasonable distribution of the pscore across both groups. This suggests that the fair balance required to estimate the impact of adopting the Korra tef variety on the adopters’ tef commercialization status has been attained.
Figure 4. Kernel density estimate of commercialization index.
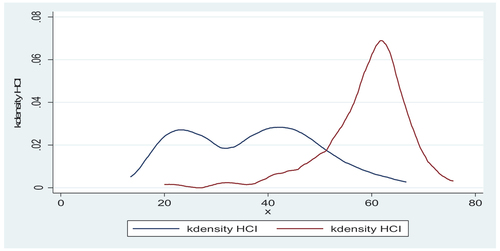
Figure 5. Distribution of propensity score generated from Kernel Matching.
3.2.4. Estimating treatment effect on the treated (impact of adoption on the adopters)
The PSM result shows that the adoption of Korra tef variety has a positive and significant impact on the adopters’ status of tef commercialization. As indicated in Table , the ATT is positive, and adopters were significantly (P < 0.01) more commercialized than non-adopters by about 23.43%. The result implied that the adoption of the Korra tef variety increased adopters’ commercialization of tef by about 23.43% more than the non-adopters. That is, the rate of commercialization among adopters is 23.43% higher than that of households in the matching control group. This result is consistent with the findings of (Degefa et al., Citation2022; Gebreselassie & Sharp, Citation2007; Mazengia, Citation2016) in which a positive and significant effect have observed from the adoption of improved tef varieties.
Table 13. Commercialization result of average treatment effect on the treated (ATT)
3.2.5. Sensitivity analysis
Sensitivity analysis is recommended for the estimation of unobservable biases from the result of the PSM (Liu et al., Citation2013). Appendix 4 displays the output of Rosenbaum bounds sensitivity analysis. A critical value known as e (Gamma) is used to estimate the hidden bias’s magnitude.
For the outcome variable of household commercialization, the lowest critical value (eγ) that includes zero is 34.5 (95% confidence interval). This showed that to label the obtained result as sensitive to unobserved factors than inferring the impact of the adoption of the Korra tef, the adopter and non-adopter households should have been different up to 3350% (eγ = 34.5) in terms of unobserved covariates which would appear improbable under normal circumstances. The result also implies that for the household commercialization status estimated, at various levels of critical value eγ, the p-critical values are significant which further indicates that important covariates that affected the outcome have been considered. Hence, the hidden bias magnitude confirms that significant differences between adopters and non-adopters in the commercialization of tef are insensitive to unobserved selection bias, in which the positive impact found could only be attributed to the adoption of the Korra tef variety.
3.3. Study limitations and areas for further studies
The lack of previous research on the study topic is the major limitation of this study. There are very few studies on the impact of adopting different tef varieties on the commercialization status of tef farm households in general and no similar research on our study topic in particular. This might impede the scope of the study under consideration. Thus, for a mature understanding of the commercialization impacts of Korra tef and to gain additional insight into its commercialization implications, future studies could address determinants of its adoption in the study area and/or other comparable areas. This would also help to identify the essential traits or actions of farmers that are linked to more dynamic paths of commercialization of Korra tef.
4. Conclusion and policy implications
Many studies have been conducted on the linkage of the adoption of an improved variety of tef seed and tef productivity and its contribution to households’ income gain from the same. However, a study on whether the adoption of the same crop technology has contributed to smallholders’ commercialization status has received little attention. The empirical literature on the possible direction of a relationship between the adoption of Korra tef and smallholder commercialization is not found. Micro-level information regarding the impact of the adoption of improved tef variety on the household commercialization status would be helpful for the design of pro-poor development policies and/or strategies. Hence, a comprehension of the impact of the adoption of crop technology on smallholder commercialization is imperative in implying development policies and strategies that revolve around farm households’ commercialization.
In this study, we consider households who adopted the AGP II introduced Korra tef variety as the treatment group from the AGP II intervention woreda and households who did not adopt Korra as the control group from the adjacent non-AGP II woreda. The average commercialization impact on the treated was estimated using the HCI for the descriptive analysis and PSM for econometrics analysis. Considering the volume of tef sold, the average level of commercialization of the sample households is 46.95%. The level of tef commercialization varies between adopter farm households and non-adopter farm households, with the former accounting for 58.92% and the latter for 36.7%, respectively. The majority of the adopter households 190 (84.07%) lie in the category of commercialized farmers while 144 (83.24%) of the non-adopters lie in the category of semi-commercialized farmers. The PSM estimative has also indicated that adoption of the Korra tef variety has a positive and significant effect on adopter households’ by which the rate of their tef commercialization was found to be 23.43% higher than non-adopters tef commercialization. This is indeed consistent with the qualitative finding in which it was alleged that adoption of the Korra tef promotes the adopters’ commercialization by enhancing their productivity, and hence, raising marketable surpluses of their tef.
The policy implication of our finding is that intensifying the adoption of improved varieties of tef (i.e. Korra in this case) is paramount to augment smallholders’ productivity. This in turn could support the commercialization of tef producers by creating a surplus of produce. Hence, policies, strategies, and programs designed to strengthen tef producer smallholders’ linkage to the output markets should need to consider the supply of improved tef varieties with all required packages. The concerned government structures at all levels in general and the agricultural offices, in particular, need to encourage the adoption of improved varieties of tef by strengthening extension services, availing supportive agricultural technologies, and enhancing market access.
Authors contribution
The corresponding author generated the research issues and title of the study. All the authors did conceptualize the research ideas and the study design. The corresponding author gathered the data, carried out the data analysis, and prepared a draft of the study report. The first co-author, Dr. Alemu Azemeraw supervised the fieldwork and reviewed the report. Dr. Solomon Tsehay helped with the statistics and visualization and read and edit the content. Dr. Alemseged Geregziher as well read and reviewed the manuscript. All authors have read and agreed to the published version of the manuscript.
Geolocation information
The study area, Wara-Jarso woreda, is located in the Oromia region, Northwest Ethiopia. It is found 185km far from Addis Ababa, the capital city of the country. It is situated at 38° 14’ 60.00“East longitude and 9° 49’ 59.99” North latitude.
Acknowledgments
We would like to thank the editorial board of Taylor and Francis: Journal of Cogent Economics and Finance for their constructive comments and support of the journal’s publication. We are also grateful to the sample farm households and key informants for volunteering their time. We also like to thank the Development Agents and other agricultural office workers of the study areas for providing and allowing us to collect the required data and engaged in the study as supervisors and enumerators.
Disclosure statement
No potential conflict of interest was reported by the author(s).
Data availability statement
The data used to support the findings of this study are available from the corresponding author upon request.
Additional information
Funding
Notes on contributors

Solomon Zewdu Leul
Solomon Zewdu Leul is a Doctoral candidate in development studies at Addis Ababa University, and a Lecturer of Sociology and Social Development at Debre Berhan University, Ethiopia. His research interest includes social dimensions of development, agriculture and rural development, environment, development economics, poverty, labor and social protection, social policy, project management, and impact evaluation.
Alemu Azmeraw Bekele
Alemu Azmerawu Bekele (Ph.D.) is an assistant professor of development studies at Addis Ababa University. His research interests include rural transformation and development, crop commercialization, productivity and management, the social dimensions of development, gender and development, conflict resolution, displacement management, land tenure, environment, natural resources management, project monitoring, management, impact evaluation, and rural water supply and management.
Alemseged Gerezgiher Hailu
Alemseged Gerezgiher Hailu (Ph.D.) is an assistant professor of development studies at Addis Ababa University. His research interests include entrepreneurship, small and medium enterprises, food security, local economic development, socioeconomic impact assessment, and rural poverty.
Solomon Tsehay Feleke
Solomon Tsehay Feleke (Ph.D.) is an assistant professor of Agricultural Economics at Addis Ababa University. His research interests mainly dwell on CGE modeling, linear and nonlinear programming (modeling), macroeconomic modeling, impact assessment, issues of poverty, food security and income inequality.
Notes
1. Woreda refers to the second smallest administrative level above the kebele and below the zone in Ethiopia, except the capital, Addis Ababa.
2. Kebele refers to the smallest administrative unit in Ethiopia, except the capital, Addis Ababa.
3. FTCs are structures established in rural Ethiopia to support smallholder farmers. They were established throughout the country to train farmers on the use of technological packages and to facilitate agricultural extension services.
4. ETB is the national currency of the Federal Democratic Republic of Ethiopia.
References
- Abate, T., Shiferaw, B., Menkir, A., Wegary, D., Kebede, Y., Tesfaye, K., Kassie, M., Bogale, G., Tadesse, B., & Keno, T. (2015). Factors that transformed maize productivity in Ethiopia. Food Security, 7(5), 965–29. https://doi.org/10.1007/s12571-015-0488-z
- Afework, H., & Endrias, G. (2016). Review on small holders agriculture commercialization in Ethiopia: What are the driving factors to focused on? Journal of Development and Agricultural Economics, 8(4), 65–76. https://doi.org/10.5897/JDAE2016.0718
- Alemu, D., & Berhanu, K. (2018). The political economy of agricultural commercialisation in Ethiopia: Discourses, actors and structural impediments. Working Paper-Agricultural Policy Research in Africa (APRA), No. 14, Future Agricultures Consortium. https://opendocs.ids.ac.uk/opendocs/handle/20.500.12413/13952
- Aman, T., Adam, B., & Lemma, Z. (2014). Determinants of smallholder commercialization of horticultural crops in Gemechis District, West Hararghe Zone, Ethiopia. African Journal of Agricultural Research, 9(3), 310–319. https://doi.org/10.5897/AJAR2013.6935
- Assefa, A. (2022). Smallholder farmers tef commercialization and its impact on food security: The case of andabet district [ PhD thesis].
- Bekele, A., Chanyalew, S., Damte, T., Husien, N., Genet, Y., Assefa, K., Nigussie, D., & Tadele, Z. (2019). Cost-benefit analysis of new tef (Eragrostis tef) varieties under lead farmers’ production management in the central Ethiopia. Ethiopian Journal of Agricultural Sciences, 29(1), 109–123.
- Beyene, A. (2018). Agricultural transformation in Ethiopia: State policy and smallholder farming. Bloomsbury Publishing. https://doi.org/10.5040/9781350218352.
- Boka, G. T. (2017). Climate change challenges, smallholders’ commercialization, and progress out of poverty in Ethiopia. Working Paper Series N° 253, African Development Bank. http://www.afdb.org/
- Caliendo, M., & Kopeinig, S. (2008). Some practical guidance for the implementation of propensity score matching. Journal of Economic Surveys, 22(1), 31–72. https://doi.org/10.1111/j.1467-6419.2007.00527.x
- Cheber, D. (2018). Smallholder agricultural commercialization for income growth and poverty alleviation: A review from Ethiopian context. College of Agriculture and Veterinary Medicine, Department of Rural Development and Agricultural Extension, Jimma University Ethiopia, PO Box, 307, 2225–2565.
- Coelli, T. J., Rao, D. S. P., O’Donnell, C. J., & Battese, G. E. (2005). An introduction to efficiency and productivity analysis. springer science & business media.
- Creswell, J. W., & Creswell, J. D. (2017). Research design: Qualitative, quantitative, and mixed methods approaches. Sage publications.
- CSA. (2020). Central statistical agency. Agricultural sample survey 2019/20(2012 E.C.) (September – December, 2019). Report on Farm Management Practices (Private Peasant Holdings, Meher Season).
- Degefa, K., Abebe, G., & Biru, G. (2022). Determinants of market participation decision and intensity of market participation in western Ethiopia: Evidence from smallholder tef producers. International Journal of Agricultural Science and Food Technology, 8(2), 125–133. https://doi.org/10.17352/2455-815X.000153
- Demeke, L., & Haji, J. (2014). Econometric analysis of factors affecting market participation of smallholder farming in Central Ethiopia. Journal of Agricultural Economics, Extension and Rural Development, 6(2), 94–104. https://mpra.ub.uni-muenchen.de/77024
- Diriba, G. (2020). Agricultural and rural transformation in Ethiopia: Obstacles, triggers and reform considerations policy working paper.
- Edosa, T. L. (2018). Determinants of commercialization of teff crop in Abay Chomen District, Horo Guduru wallaga zone, Oromia Regional State, Ethiopia. Journal of Agricultural Extension & Rural Development, 10(12), 251–259. https://doi.org/10.5897/JAERD2018.0970
- Endalew, B., Aynalem, M., Assefa, F., & Ayalew, Z. (2020). Determinants of wheat commercialization among smallholder farmers in Debre Elias Woreda, Ethiopia. Advances in Agriculture, 2020, 1–12. https://doi.org/10.1155/2020/2195823
- Eshetu, G. (2018). Commercialization of Smallholder Tef Producers in Jamma District, South Wollo Zone, Ethiopia [ PhD thesis]. Haramaya university.
- Fufa, B., Behute, B., Simons, R., & Berhe, T. (2011). Tef diagnostic report: Strengthening the tef value chain in Ethiopia. Case Study Ethiopian Agricultural Transformation Agency (ATA). https://www.fao.org/sustainable-food-value-chains/library/details/en/c/243930/
- Gebre-Ab, N. (2006). Commercialization of smallholder agriculture in Ethiopia. https://api.semanticscholar.org/CorpusID:197862724.
- Gebremedhin, B., & Jaleta, M. (2010). Commercialization of smallholders: Is market participation enough?
- Gebreselassie, S., & Ludi, E. (2008). Commercialisation in coffee growing areas of Ethiopia.
- Gebreselassie, S., & Sharp, K. (2007). Commercialisation of smallholder agriculture in selected Tef-Growing Areas of Ethiopia. Ethiopian Journal of Economics, 16(1). https://doi.org/10.4314/eje.v16i1.39824
- Gerezgiher, A. (2016). Small holder market access in Werie Leke District of Tigray National Regional State, Ethiopia: Implications for poverty reduction and food security [ PhD Thesis]. Addis Ababa university,
- Getahun, A. (2020). Smallholder farmers agricultural commercialization in Ethiopia: A review. Agriculture, Forestry and Fisheries, 9(3), 67. https://doi.org/10.11648/j.aff.20200903.14
- Getahun, A., Goshu, D., & Bekele, A. (2019). Determinants of commercialization of Tef: The case of smallholder farmers in Dendi District of Oromia, Central Ethiopia. International Journal of African and Asian Studies, 56, 1–14. https://doi.org/10.7176/JAAS
- Govereh, J., Nyoro, J., & Jayne, T. S. (1999). Smallholder commercialization, interlinked markets and food crop productivity: Cross-country evidence in Eastern and Southern Africa. Department of Agricultural Economics and the Department of Economics, Michigan State University (MSU). https://www.researchgate.net/profile/Thomas-Jayne/publication/238075353
- Heckman, J., Ichimura, H., & Todd, P. (1997). Matching as an econometric evaluation estimator: Evidence from evaluating a job training programme. The Review of Economic Studies, 64(4), 605–654. https://doi.org/10.2307/2971733
- Jaleta, M., Gebremedhin, B., & Hoekstra, D. (2009). Smallholder commercialization: Processes, determinants and impact. ILRI Discussion Paper.
- Lee, H. (2018). Teff, a rising global crop: Current status of teff production and value chain. The Open Agriculture Journal, 12(1), 185–193. https://doi.org/10.2174/1874331501812010185
- Liu, W., Kuramoto, S. J., & Stuart, E. A. (2013). An introduction to sensitivity analysis for unobserved confounding in non-experimental prevention research. Prevention Science: The Official Journal of the Society for Prevention Research, 14(6), 570. https://doi.org/10.1007/s11121-012-0339-5
- Mazengia, Y. (2016). Smallholders commercialization of maize production in Guangua district, northwestern Ethiopia. World Scientific News, 58, 65–83. http://www.worldscientificnews.com/wp-content/uploads/2016/06/WSN-58-2016-65-83.pdf
- Minten, B., Taffesse, A. S., & Brown, P. (2018). The economics of teff: Exploring Ethiopia’s biggest cash crop. Intl Food Policy Res Inst.
- MoA(a). (2015). FDRE ministry of agriculture. Agricultural Growth Program II (AGP-II) Program Design Document. https://eeas.europa.eu/archives/delegations/ethiopia/documents/financing_agreement/1._agp_ii_design_doc.docx
- Mutyasira, V. (2020). Prospects of sustainable intensification of smallholder farming systems: A farmer typology approach. African Journal of Science, Technology, Innovation & Development, 12(6), 727–734. https://doi.org/10.1080/20421338.2019.1711319
- National Meteorological Agency of Ethiopia. (2020). Meteorological grid data. https://scholar.google.com/scholar?hl=en&as_sdt=0%2C5&q=National+Meteorological+Agency+of+Ethiopia.+Meteorological+Grid+Data&btnG=
- Natnael, A. B. (2019). Impact of technology adoption on agricultural productivity and income: A case study of improved teff variety adoption in north eastern Ethiopia. Agricultural Research & Technology: Open Access Journal, 20(4), 556139.
- O’Neill, A. (2021). Ethiopia—Share of economic sectors in the gross domestic product 2020. Statista. https://www.statista.com/statistics/455149/share-of-economic-sectors-in-the-gdp-in-ethiopia/
- Orr, A., Tiba, Z., Congrave, J., Porázik, P., Dejen, A., & Hassen, S. (2021). Smallholder commercialization and climate change: A simulation game for teff in South Wollo, Ethiopia. International Journal of Agricultural Sustainability, 19(5–6), 595–608. https://doi.org/10.1080/14735903.2020.1792735
- Osmani, M. A. G., Islam, K., Ghosh, B. C., & Hossain, M. E. (2014). Commercialization of smallholder farmers and its welfare outcomes: Evidence from Durgapur Upazila of Rajshahi District, Bangladesh. Journal of World Economic Research, 3(6), 119–126.
- Poulton, C. (2017). What is agricultural commercialisation, why is it important, and how do we measure it? APRA Working Paper 6, Future Agricultures Consortium. https://eprints.soas.ac.uk/26527/1/APRA%20W.P%20number%206%20web.pdf
- Rosenbaum, P. R., & Rubin, D. B. (1983). The central role of the propensity score in observational studies for causal effects. Biometrika, 70(1), 41–55. https://doi.org/10.1093/biomet/70.1.41
- Rubin, D. B. (2001). Using propensity scores to help design observational studies: Application to the tobacco litigation. Health Services & Outcomes Research Methodology, 2(3), 169–188. https://doi.org/10.1023/A:1020363010465
- Samuel, G., & Kay, S. (2008). Commercialisation of smallholder agriculture in selected tef-growing areas of Ethiopia. Ethiopian Journal of Economics, 16(1), 55–86. https://doi.org/10.4314/eje.v16i1.39824
- Shadreck, Z., Isaac, J. M., & Bruce, M. (2013). Smallholder agricultural commercialization for income growth and poverty alleviation in southern Africa: A review. African Journal of Agricultural Research, 8(22), 2599–2608.
- Shikur, Z. H. (2020). Agricultural policies, agricultural production and rural households’ welfare in Ethiopia. Journal of Economic Structures, 9(1), 1–21. https://doi.org/10.1186/s40008-020-00228-y
- Smith, J. A., & Todd, P. E. (2005). Does matching overcome LaLonde’s critique of nonexperimental estimators? Journal of Econometrics, 125(1–2), 305–353. https://doi.org/10.1016/j.jeconom.2004.04.011
- Solomon, C., Setotaw, F., Tebkew, D., Tsion, F., Yazachew, G., Worku, K., Kidist, T., Tadele, Z., & Kebebew, A. (2019). Significance and prospects of an orphan crop tef. Planta, 250(3), 753–767. https://doi.org/10.1007/s00425-019-03209-z
- Tadele, M., Wudineh, G., Agajie, T., Ali, C., Tesfaye, S., Aden, A.-H., Tolessa, D., & Solomon, A. (2017). Analysis of wheat commercialization in Ethiopia: The case of SARD-SC wheat project innovation platform sites. African Journal of Agricultural Research, 12(10), 841–849. https://doi.org/10.5897/AJAR2016.11889
- Taffesse, A. S., Dorosh, P., & Gemessa, S. A. (2012). Crop production in Ethiopia: Regional patterns and trends. Food and Agriculture in Ethiopia: Progress and Policy Challenges, 53–83. https://www.researchgate.net/publication/290263344_Crop_production_in_Ethiopia_Regional_patterns_and_trends
- Tattao, L. A. (2007). Basic concepts in statistics (p. 7). Rex Book Store.
- Tesfahun, A., Alexeeva, M., Tomkuvienė, M., Arshad, A., Guragain, P., Klungland, A., Klimašauskas, S., Ruoff, P., & Bjelland, S. (2021). Alleviation of C⋅C Mismatches in DNA by the Escherichia coli Fpg Protein. Frontiers in Microbiology, 12, 9. https://doi.org/10.3389/fmicb.2021.608839
- Wara Jarso woreda Agriculture and Natural Resource Office. (2019). Population and geographical profile of Wara Jarso woreda. Wara Jarso woreda Administration Communication Office.
- Welteji, D. (2018). A critical review of rural development policy of Ethiopia: Access, utilization and coverage. Agriculture & Food Security, 7(1), 1–6. https://doi.org/10.1186/s40066-018-0208-y
- Wendimu, G. Y. (2021). The challenges and prospects of Ethiopian agriculture. Cogent Food & Agriculture, 7(1), 1923619. https://doi.org/10.1080/23311932.2021.1923619
- Yamane, T. (1967). Statistics: An introductory analysis.