
 ?Mathematical formulae have been encoded as MathML and are displayed in this HTML version using MathJax in order to improve their display. Uncheck the box to turn MathJax off. This feature requires Javascript. Click on a formula to zoom.
Abstract
This article examined the role of resilience and resilience pillars on household food consumption differentiated by socio-economic status. The cross-sectional data of 2228 rural households came from Zimbabwe Poverty, Income, Consumption and Expenditure Survey and principal component analysis was used for computing resilience capacity. The study employed dietary diversity and food consumption as outcome variables. Negative binomial regression and linear regression are used for analysis. Resilience capacity improved household food consumption across all socio-economic classes, and effects are more pronounced among poorer households. The resilience pillars—assets (AST), access to basic services and adaptive capacity (AC)—improved household food consumption, while social safety nets (SSN) improved food consumption among the poor only. Public and private sectors and policy makers should consider promoting interventions that increase AC, AST and basic services across all socio-economic classes of households with special focus on poor households and low rainfall areas. SSN should continue to be efficiently targeted to poorer households.
Public Interest Statement
Resilience is becoming a major topic of interest in development programming. Yet, few studies have systematically analyzed the association between resilience and food consumption. This manuscript investigates the role of resilience capacity on food consumption in a developing country context. Our manuscript adds to the existing literature by analyzing the association between resilience capacity and household food consumption in the presence of shocks. Resilience capacity improved food consumption across all socio-economic classes, and effects are more pronounced among poorer households. All the resilience pillars—assets (AST), access to basic services, adaptive capacity (AC) and social safety nets (SSN)—improved household food consumption. Public and private sectors and policy makers should consider promoting interventions that increase AC, AST, basic services and SSN across all socio-economic classes of households with special focus on poor households and low rainfall areas.
1. Introduction
Climatic, environmental, economic and health shocks including COVID-19 are causing much damage to the world and increasing at an alarming rate (Ansah et al., Citation2019; Chirisa et al., Citation2021; Muricho et al., Citation2019). Shocks and stressors for example COVID-19, droughts, cyclones, floods and food price increases can have far reaching and negative consequences on individuals, households and communities, and subsequently results in poor health, reduced income and food consumption (Chirisa et al., Citation2021; d’Errico et al., Citation2019; Harttgen et al., Citation2016; Mavhura et al., Citation2021). Resilience, which is the capability of individuals and households to maintain welfare and bounce back from shocks and stressors (Smith & Frankenberger, Citation2018), has gained tremendous attention in recent literature (Ansah et al., Citation2019; d’Errico et al., Citation2019; D. Haile et al., Citation2022; Lascano Galarza, Citation2020). Resilience is vital for enhancing food consumption and reduction of hunger by protecting and smoothing food consumption during shocks and helps individuals and households adapt to changing conditions (Barrett et al., Citation2021; d’Errico et al., Citation2018; Jones & d’Errico, Citation2019; Upton et al., Citation2022). An emerging body of literature have started investigating how resilience influences household welfare outcomes accounting for stressors, shocks and disasters (Ansah et al., Citation2019; d’Errico et al., Citation2018, Citation2019; D. Haile et al., Citation2022; Lascano Galarza, Citation2020; Malik et al., Citation2020; Murendo et al., Citation2020; Otchere & Handa, Citation2022; Upton et al., Citation2022). For instance, d’Errico et al. (Citation2018) highlighted that higher resilience capacity lowered the incidence of food insecurity in Uganda and Tanzania. In Malawi, Murendo et al. (Citation2020) noted that resilience improved food consumption. D. Haile et al. (Citation2022) found that resilience reduced food and nutrition insecurity among households in Ethiopia.
Over the past years, a growing number of United Nations agencies, donors and development partners, for example Green Climate Fund (GCF) World Food Program (WFP), Foreign, Commonwealth and Development Office (FCDO), United Nations Development Plan (UNDP), European Union (EU), Care International and Catholic Relief Services started promoting resilience building interventions to improve household welfare and reduce dependency syndrome in Zimbabwe and other developing countries (Béné et al., Citation2016; Otchere & Handa, Citation2022; Smith & Frankenberger, Citation2018; UNDP, Citation2019). From 2015 onwards, FCDO, UNDP, GCF, EU and WFP have started implementing rural and urban resilience projects to improve household and community welfare in Zimbabwe (UNDP, Citation2019).
A growing number of studies have analysed resilience or its dimensions in developing countries (Ado et al., Citation2019; Ansah et al., Citation2019; Asmamaw et al., Citation2019; d’Errico et al., Citation2018, Citation2019; Malik et al., Citation2020; Mashizha, Citation2019; Mavhura et al., Citation2021; Murendo et al., Citation2020; Muricho et al., Citation2019; Otchere & Handa, Citation2022; Smith & Frankenberger, Citation2018). Of these, only a few (Mashizha, Citation2019; Mavhura et al., Citation2021) analysed resilience in the context of Zimbabwe. For example, Mavhura et al. (Citation2021) studied the spatial variation in resilience to disasters in 91 districts in Zimbabwe and found out that urban districts were more resilient than rural ones.
Despite the increased interest on resilience, no study to the best of our knowledge has systematically investigated how resilience capacity influences household food consumption in Zimbabwe. Resilience capacities are expected to have different welfare effects depending on household socio-economic status (SES) and gender (Fuller & Lain, Citation2020; Sakyi-Nyarko et al., Citation2022). Yet, we are not aware of studies that analyse the role of resilience capacities on food consumption differentiated by household SES. This article addresses the above identified research gap by analysing the role of resilience capacity on food consumption differentiated by household SES in selected provinces of Zimbabwe. Thus, this study was designed to analyze the role of resilience capacity on household food consumption differentiated by household SES in selected provinces of Zimbabwe. Therefore, research questions, include (i) what is the role of resilience capacity and resilience pillars on food consumption in Zimbabwe? and (ii) what is the effect of resilience capacity and resilience pillars on food consumption differentiated by socio-economic status? The study findings aim to provide important policy insights on how government and development partners can build household resilience capacities to improve food consumption across different socio-economic groups. This paper is organized as follows. Section 2 describes the conceptual framework, followed by Section 3 on methodology and then Section 5 focuses on results and discussion. Sections 7 and 8 focus on conclusion and policy implications, respectively.
2. Conceptual framework
Resilience is complex and multi-dimensional. Approaches to measure it have relied on objective (Ansah et al., Citation2019; Béné, Citation2020; Béné et al., Citation2016; Cissé & Barrett, Citation2018; D. Haile et al., Citation2022; Lascano Galarza, Citation2020; Otchere & Handa, Citation2022; Upton et al., Citation2022) and subjective methods (Béné, Citation2020; Jones & d’Errico, Citation2019). Within the objective methodology, two approaches to resilience measurement have emerged. The first approach was developed by Cissé & Barrett (Citation2018). Using panel data from Kenya, Cissé and Barrett (Citation2018) used conditional moments to calculate the probability of the household being above the specified cut-off point. The calculated probability is the measure of resilience, and higher values denote a higher likelihood of reaching the cut-off (Cissé & Barrett, Citation2018; Otchere & Handa, Citation2022).
The second theory-based approach which is widely used is the Resilience Index Measurement and Analysis (RIMA) approach developed by Food and Agriculture Organization. This methodology views resilience as multidimensional and made up of four pillars, namely assets (AST), access to basic services (ABS), social safety nets (SSN) and adaptive capacity (AC) (Otchere & Handa, Citation2022; Upton et al., Citation2022). The indicators within each pillar are combined to create an index of resilience capacity using structural equations or principal component analysis (PCA) (Lascano Galarza, Citation2020; Otchere & Handa, Citation2022). Here, households with better AST, ABS, SSN and AC are assumed to be more resilient compared to their less endowed counterparts. The resiliency capacity index is useful to rank households from the least to most resilient and this is crucial for targeting purposes (Otchere & Handa, Citation2022). The subjective methodology uses self-assessed judgements to compute resilience score (Jones & d’Errico, Citation2019). About nine validated capacities and capitals are used with ratings ranging from strongly agree to strongly disagree (Jones & d’Errico, Citation2019). Although resilience can be measured using various approaches, in this article we rely on RIMA methodology to measure resilience (Lascano Galarza, Citation2020; Otchere & Handa, Citation2022). Figure shows the conceptual framework of the RIMA approach including the four main pillars used to compute the index of resilience (Ado et al., Citation2019).
Figure 1. Conceptual framework analysing association between resilience and food consumption using the Resilience Index Measurement and Analysis approach (Ado et al., Citation2019; Lascano Galarza, Citation2020; Otchere & Handa, Citation2022; Upton et al., Citation2022). V refers to variables used to construct the respective capacity.
AST are used to cope with shocks and stress. For example, AST could potentially be converted to generate income through sales (Smith & Frankenberger, Citation2018) during shock periods and are an important ingredient of resilience (Hoddinott, Citation2006; Murendo et al., Citation2020).
AC is the capability of individuals and households to adapt to evolving environment as well as respond to shocks (Ado et al., Citation2019; Smith & Frankenberger, Citation2018). In this regard, farm production and income diversification increase household ability to adapt and may reduce the negative consequences of stressors, shock and disasters (Ansah et al., Citation2019; Barrett et al., Citation2021).
ABS improves household resilience by providing most critical public services that facilitate the household to withstand shocks (Ado et al., Citation2019). For example, good transport and communication infrastructure reduces transaction costs and improves access to markets (Okoye et al., Citation2016), thereby enhancing food consumption. When these resilience capacities are strengthened and maintained, households are better placed to improve and sustain food security and livelihoods investments.
SSN redistribute resources to poor individuals or households to reduce poverty or protect them from shocks and stressors posed by diseases, loss of income and employment, climate and economic crisis (D. Haile et al., Citation2022; Paitoonpong et al., Citation2008; Upton et al., Citation2022). Safety nets can provide food, cash and other means to support vulnerable people's income and consumption when shocks happen, thereby improving their resilience (Otchere & Handa, Citation2022; Upton et al., Citation2022).
3. Methodology
3.1. Data
This manuscript use data extracted from the Agricultural Productivity Module (APM) which formed a sub-set of the Zimbabwe Poverty, Income, Consumption and Expenditure Assessment of 2017. The APM was collected by Zimbabwe National Statistics Agency (Mavhura et al., Citation2021; ZIMSTAT, Citation2018, Citation2019). The assessment utilized a stratified two-stage sampling design whereby random systematic sampling was combined with Probability Proportional to Size to collect information from 32,256 households in all the administrative districts of Zimbabwe. A total of 2552 households from 280 Enumeration Areas were sampled for the APM survey and these consisted of rural smallholder households engaged in agricultural activities (ZIMSTAT, Citation2019). Finally, 2228 households from 8 provinces (provincial sample in brackets) of Manicaland (290), Mashonaland Central (284), Mashonaland East (317), Mashonaland West (281), Matebeleland North (250), Matebeleland South (262), Midlands (248) and Masvingo (296) with full information on demographics, food security, AST and agriculture production formed the basis of this article.
3.2. Measurements
The choice of variables used to compute each resilience pillar was drawn from previous studies (Ado et al., Citation2019; Ansah et al., Citation2019; Barrett et al., Citation2021; Upton et al., Citation2022), using available variables in the Poverty, Income, Consumption and Expenditure Survey (PICES) 2017 dataset.
3.3. Adaptive Capacity
The variables used included household head education and whether the household head is employed and earns a wage income. Education and wage earner were measured as a dummy variable of having secondary education and above and whether household head is employed, respectively. The number of crops grown (ranged from 0 to 13) and animals were transformed to Tropical Livestock Units (TLU) (Maass et al., Citation2012) using conversion factors of heifers, oxen and cows (0.7); donkey (0.5); calves (0.25); pigs (0.2); goats and sheep (0.1); rabbits and chickens (0.01) (Arslan et al., Citation2015; K. K. Haile et al., Citation2020; Maass et al., Citation2012). Our TLU ranged from 0 to 40.24 and higher TLU is associated with high livestock numbers and diversification.
3.4. Asset
The AST included arable land owned by household in hectares, number of rooms, ownership of mouldboard plough, ox drawn cart and wheelbarrow. The plough, cart and wheelbarrow ownership are used to capture agricultural capital and are binary variables equated to 1 if these were owned and 0 otherwise. These variables were utilized to calculate an index of AST by employing PCA.
3.5. Access to Basic Services
The variables used to compute ABS index included dummy variables of whether household has access to electricity, any member with a mobile phone and has a hygienic toilet facility. The hygienic facility included a flush toilet. The fourth variable was number of extension topics or subjects that the household was trained on by extension staff using different training methods. A household that has received training on a wider range of agricultural topics is assumed to be more knowledgeable and better able to adopt resilience building interventions.
3.5.1. Social Safety Nets
This pillar measure the ability of households to access assistance from multiple sources (family, relatives, friends, non-governmental organizations (NGOs), international agencies and government (D. Haile et al., Citation2022; Otchere & Handa, Citation2022; Upton et al., Citation2022). The SSn was computed as a dummy variable, similar to other studies (Ado et al., Citation2019). The receipt of any form of assistance (e.g., remittances, relatives, government and NGOS) both in cash and in-kind was denoted as yes and zero otherwise.
3.6. Resilience Capacity Index
The computed indices of resilience pillars: AST, AC and ABS together with the dummy variable of SSN were utilized to calculate household resilience capacity index (RCI). The study relied on PCA to compute the AST, AC, ABS and RC indices. More recently, authors have used this approach (Ado et al., Citation2019; Barrett et al., Citation2021). All the indices had the Kaiser–Meyer–Olkin (KMO) statistic values greater than 0.5 indicating that the use of PCA was appropriate (Field, Citation2013). A positive and significant Bartlett test for sphericity also shows the suitability of using PCA (Field, Citation2013). The first principal factor with an eigenvalue equal to or greater than 1 is assumed to be our measure of underlying latent variable (Ado et al., Citation2019; Field, Citation2013; Vyas & Kumaranayake, Citation2006). A higher index means that the household has a higher capacity for that specific index.
3.7. Shock
Drought is the most common climatic shock affecting food security of most households in Zimbabwe (Mavhura et al., Citation2021). Respondents were asked during the survey whether drought affected their food availability, and this was coded yes or no. Despite its limitations, recent studies have also relied on respondent recall of the shock effects (D. Haile et al., Citation2022; Murendo et al., Citation2020).
3.8. Food consumption
Household dietary diversity (HDDS): HDDS was computed using the intake of 12 food groups (Pauzé et al., Citation2016). These groups included (a) roots, tubers; (b) cereals, nuts, pulses; (c) fruit; (d) vegetables;(e) fish; (f) meat, meat products; (g) eggs; (h) milk, milk products; (j) sugar, fats, oil; and (k) spices, condiments) over the last 24 h before the survey.
Food consumption score (FCS): was computed using food groups, frequency of food group consumption and nutritional value of food (Kennedy et al., Citation2010; Leroy et al., Citation2015; Murendo et al., Citation2020) group. The weights accounts for the protein, energy and densities of micronutrients for each food group.
3.9. Socio-Economic Status
SES is commonly denoted using income, education, occupational status or wealth (Turrell et al., Citation2003). The SES is employed to categorize households social standing into poorest, poor, medium, rich and richest. For example, Turrell et al. (Citation2003) used different indicators of education, income and education to measure socio-economic inequalities on dietary patterns. We used per capita consumption expenditure to compute five socio-economic quintiles to group households into different poverty profiles. The average per capita consumption expenditures were US$20.92 for poorest income group (quintile 1), US$29.97 for poor income group (quintile 2), US$40.31 for moderate income group (quintile 3), US$56.02 for rich income group (quintile 4) and US$118.28 for richest income group (quintile 5).
4. Estimation strategy
Here, our analysis sought to answer the degree to which resilience capacity and household food consumption are correlated. The correlation between resilience capacity and food consumption accounting for drought shock is assumed to be positive; thus, a higher RCI is expected to improve food consumption. In addition, covariate shocks may affect food consumption (d’Errico & Pietrelli, Citation2017; Murendo et al., Citation2020). The correlation between resilience and household food consumption is assessed using the following regression model:
where FC is the food consumption outcome variable (HDDS or FCS) for household ; RCI for household
is captured by RCI; Y captures the vector of other individual and household factors;
represents shock variable;
accounts for all variables not included in the model and
represent fixed-effects. The other independent variables used are gender of head, household size and whether household resides in low rainfall area. To capture agro-ecological variation across households, a dummy variable of low rainfall area (natural region 4, 5) that equals 1 if the household and zero high rainfall areas (natural regions 1, 2 and 3) was used. For detail discussion on classification of natural regions in Zimbabwe, see Musiyiwa et al. (Citation2017). It is expected that households in lower-rainfall areas are more likely to have lower farm production diversity and productivity and hence poor food consumption than households in higher-rainfall areas.
is the interaction term that shows how the effect of resilience capacity on food consumption changes as the shock intensity increases (Murendo et al., Citation2020). In this study, we estimate the correlation and not the causal relationship between resilience and household food consumption because we do not control for endogeneity. Endogeneity potentially stems from the interdependence among the resilience attributes and potential reverse causality among food security, shocks and resilience capacity (Ansah et al., Citation2019).
4.1. Regression model estimators
HDDS is a count variable. Count variables are not normally distributed and are best estimated using poisson regression (Cameron & Trivedi, Citation2010). The goodness-of-fit chi-squared tests were significant, showing that the poisson models are not appropriate for analysis. In such a case, we estimated EquationEquation 1(1)
(1) using negative binomial regression (NBR) (Murendo et al., Citation2018), appropriate for the case when poisson is not ideal (Wooldridge, Citation2010). The estimated coefficients of NBR are treated as semi-elasticities, which denote the degree of change in number of food groups eaten due to a unit change in explanatory variable (Cameron & Trivedi, Citation2010). FCS is a continuous variable (Leroy et al., Citation2015). Given that our outcome variable is continuous, we relied on linear regression model to study the linear relationship between FCS and resilience capacity (Cameron & Trivedi, Citation2010; Wooldridge, Citation2010).
5. Results and discussion
5.1. Descriptive analysis
The AC, AST and ABS indices were constructed using PCA. A dummy variable was used to measure SSN. AST, AC, ABS and SSN variables were then collapsed to compute RCI using PCA. Table shows the factor loadings and measures of sampling adequacy from computations of AC, AST, ABS and RCI indices. The KMO were above 0.5, and the Bartlett test was significant (Ado et al., Citation2019; Field, Citation2013; Murendo et al., Citation2020), indicating the appropriateness of PCA.
Table 1. Computation of resilience indices including factor loadings
Table shows the descriptive statistics of outcome variables and resilience indices for full sample and differentiated by gender. The gender comparisons are computed using independent sampled t-test. Male-headed households had higher dietary diversification, food consumption and resilience compared to their female counterparts, indicating that female-headed households face a number of challenges and are somewhat disadvantaged thus affecting levels of food consumption and resilience capacity. Interventions that help to build resilience capacities and improve food consumption should be inclusive and include female-headed households.
Table 2. Descriptive statistics for full sample and by gender of household head
We followed Pauzé et al. (Citation2016) and divided the sample into dietary diversity tertiles, which are classified as (a) low (0–5), (b) moderate (6–7) and (c) high (8–10) dietary diversity. The proportions of households who have high, moderate and low dietary diversity by socio-economic class are highlighted in Figure . Results show that low dietary diversity was pronounced among poorer households (quintile 1 and 2) compared to other classes. As expected, higher dietary diversity was mostly confined to richer income groups (quintiles 4 and 5). Approximately 18.4% and 28.2% of households had high dietary diversity in quintiles 4 and 5, respectively. About 57.9% and 43.3% of households in the poor income groups, quintiles 1 and 2 respectively had low dietary diversity. Therefore, the government’s ministries, departments and agencies, private sector and development agencies should promote nutrition-sensitive interventions to improve dietary diversity in the country, with special focus given to the poorer households.
Figure 2. Households having high, moderate and low dietary diversity by socio-economic class (%).
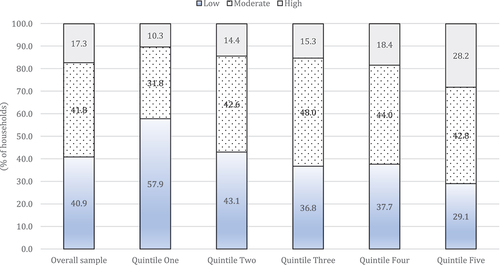
Figure shows the proportions of households who have acceptable, borderline and poor food consumption by socio-economic class. The thresholds used to determine household food consumption categories were (a) 0–21 (poor), (b) 21.5–35 (borderline) and (c) 35 and above for acceptable (Murendo et al., Citation2020). It was noted that a higher proportion of households (around 57%) had poor food consumption in the overall sample. These results highlight that the greater proportion of sampled respondents were food insecure. Additionally, from the results of socio-economic classes, the poorer income groups (quintiles 1 and 2) had higher proportions of households with poor food consumption compared to other classes. Relatively richer income groups (quintiles 4 and 5) had higher proportions of households with acceptable food consumption. About 27.4% and 32.7% of the households in quintiles 4 and 5 had acceptable food consumption, respectively. In order to determine food insecurity, we combined poor and borderline food consumption. Our findings show that 88.4% and 67.3% of households in the poorest and richest quintile, respectively, were food insecure. These results are plausible, given the widespread El’nino drought in 2014/16 and 2015/16 seasons which adversely affected agricultural productivity in Zimbabwe and the greater parts of Southern Africa. Therefore, programmes and policy interventions to improve food security should be implemented and streamlined across all the socio-economic classes. For instance, promoting resilience building and nutrition-sensitive agricultural programmes such as home gardens, aquaculture and small livestock production that have been documented as promising interventions to address nutrition gaps (Ruel et al., Citation2018).
Figure 3. Households having acceptable, borderline and poor food consumption by socio-economic class.
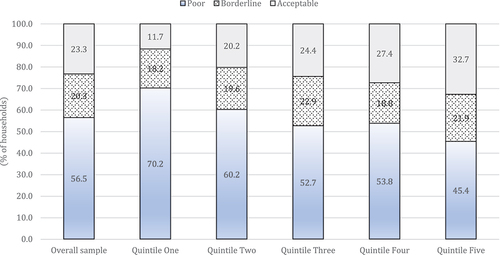
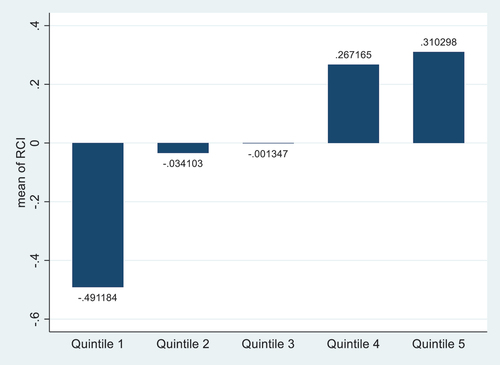
Figure presents the results of the mean resilience index by socio-economic class. It was shown that the mean RCI was −0.491 for poorest households, −0.001 for those in quintile 3 and 0.310 for those in the richest category (quintile 5). These results show that richer households have higher resilience capacity compared to poor households. Therefore, resilience building interventions should deliberately target the poor households in first, second and third quintiles in the country.
Figure 4. Mean resilience capacity by socio-economic class.
5.2. Econometric analysis
5.2.1. Household resilience capacity and dietary diversification
Table shows how household resilience capacity and dietary diversity are correlated while controlling for drought shock. In model 1, we estimated the relationship between drought and HDDS without introducing resilience indicators. Study findings show that drought reduced the count of food groups consumed by 12.4%. Taken into context, these results are of key relevance given the El’nino induced drought of 2014/15 and 2015/16 seasons were severe and characterised by widespread crop failure with negative ramifications on food consumption in the whole country. Hence, investments in climate proofing strategies, for example water harvesting and climate smart agricultural practices by government and development agencies are needed in the smallholder farming communities.
Table 3. Correlation between resilience capacity and dietary diversity
In the model 2, we included the resilience variables in our regression analysis. Higher resilience is positively correlated with improved dietary diversity. An index point increase in RCI increased the count of food groups consumed by 7.6%. Our analysis confirms the importance of promoting resilience building interventions for improving food consumption in rural areas of Zimbabwe. A couple of recent studies found similar results that improving resilience capacity is crucial for increased food consumption (d’Errico et al., Citation2018; D. Haile et al., Citation2022; Murendo et al., Citation2020). After the introduction of resilience variables (model 2), the impact of drought on HDDS drops by from 12.4% to 8.2%. The results also show that household size reduced food consumption. Adding another household member decreases the count of food groups consumed by 0.6%. Residence in low rainfall areas is associated with 4.9% decrease in HDDS. Our results show that drought and residence in low rainfall areas lower food consumption. There is need for interventions that enhance water availability and access in low rainfall areas and during drought periods. The government and development agencies need to invest in resilience building interventions, for example soil and water harvesting technologies, crop and livestock diversification, drought tolerant crops and adaptable livestock breeds in low rainfall areas to boost agricultural productivity and subsequently food consumption.
5.2.2. Resilience capacity and dietary diversity by SES
Results in Table show the influence of resilience capacity on HDDS differentiated by SES. The correlation between household RCI and HDDS is positive and statistically significant across all the socio-economic classes. An index point increase in resilience capacity results in 12.7% and 3.4% improvement in dietary diversification (food groups consumed) by poorest (quintile 1) and richest (quintile 5) households, respectively. The effect size of resilience capacity tends to be more pronounced among poorer household demonstrating socio-economic gradient and the need to rigorously promote resilience interventions among the poor. The negative effects of low rainfall tend to be more pronounced among the poorest and poor households. The promotion of climate smart agricultural practices should target poor households and those in low rainfall area as they are more vulnerable. The policy implication is that resilience and nutrition building interventions should prioritize targeting of poorer households and those residing in low rainfall areas.
Table 4. Correlation between household resilience capacity and dietary diversity by socio-economic status
5.2.3. Linking resilience capacity pillars and dietary diversity
We re-estimated the same equation as in (1), with ‘‘RCI” replaced by indices of the individual pillars—AC, AST, ABS and SSN. Table shows the results of the individual resilience capacity pillars on HDDS. Results in model 2 show that after the introduction of resilience capacity pillars, the detrimental effect of drought is reduced from 12.4% (model 1) to 9.6% (model 2). We proceed and interpret results in model 2. AC, AST and ABS are positively correlated with HDDS. Increasing ABS, AST and AC tend to improve the number of food groups consumed by 6.6%, 2.1% and 3.3%, respectively.
Table 5. Correlation between resilience capacity pillars and dietary diversity
Study findings confirm that the individual resilience capacities: ABS, AST and AC are important for food consumption in the country. Hence, households with better ABS, more AST and higher AC have improved food consumption compared to those with poor ABS, less AST and lower ACs in the same communities. Our findings are supported by recent empirical evidence. For example, Smith and Frankenberger (Citation2018) found that AST and access to services improved food security among households in Bangladesh. With regards to ABS, our findings are in tandem with Shively (Citation2017) who found that health and transport infrastructure buffer the negative effects of rainfall shortages on child nutrition in Nepal and Uganda. Furthermore, the interaction between AC and drought is significant and positive and this may suggest that AC smooth consumption during drought periods. For example, a household with higher AC (measured by education, employed, crop and livestock diversity) may be more resilient to drought shocks. This further emphasize the importance of AC for food consumption and resonates with studies highlighting food consumption smoothing (Ansah et al., Citation2019; Hoddinott, Citation2006).
5.2.4. Resilience pillars and dietary diversity by SES
Table shows how resilience pillars and dietary diversity are correlated differentiated by household SES. AC increases dietary diversity by 6.3% and 5.7% among poor (quintile 2) and moderate (quintile 3) households, respectively. AST positively increased HDDS among the poorest households only. Increasing AST by an index point results in 6.3% increase in food groups consumed among poorest households. This may indicate that poorer households rely on AST for smoothing consumption during drought periods. However, as drought intensifies the effect of AST for consumption smoothing tends to disappear as shown by the negative interaction term between AST and drought. Therefore, interventions that prevent distress sale of AST by poorer households during drought are needed. ABS is positively correlated with HDDS across all socio-economic classes. For example, an index point increase in ABS increases dietary diversity by 7.7% and 6.3% among the poorest (quintile 1) and richest (quintile 5) households, respectively. Overall results show that AC, AST and ABS are crucial for HDDS, but the effects vary depending on socio-economic class. The magnitude of the coefficients tends to be higher among poorer households compared to the non-poor.
Table 6. Correlation between individual resilience capacities and dietary diversity by socio-economic status
6. Robustness checks
There are several other indicators, beyond dietary diversity that are used to measure food consumption. For robustness checks, we separately estimated the models by using FCS as the dependent variable. The finding that household resilience capacity positively increases food consumption still holds (Table ). Results in Table show that resilience capacity positively increases food consumption across all socio-economic classes, except the quintile 5. Increasing RCI by an index point improves FCS by 7.5 and 4.3 units among the poorest (quintile 1) and rich (quintile 4) households, respectively. AC, AST and ABS were positively correlated with FCS, and the positive effects are more pronounced for AC and ABS (Table ). Results show that resilience pillars are important for FCS, but the effects vary depending on socio-economic class. AST, ABS and SSN enhance food consumption among the poorest. As discussed earlier, the magnitude of the coefficients tends to be higher among poorer households compared to the non-poor (Table ). SSN is only positive and significant among the poorest and as it is mostly the poor who are targeted to receive safety nets and safety nets alone are not be able to improve resilience (D. Haile et al., Citation2022). There is need to complement the rolling out of SSN with investments in livelihood activities, AST, AC and ABS. Overall, the study findings show that resilience index and its pillars—AC, AST, ABS and SSN are important drivers of food consumption regardless of how food consumption is measured. We interpret this as evidence that resilience capacity is crucial for food consumption and that interventions to improve resilience and food consumptions should deliberately target poorer households in the country.
7. Conclusion
The study examined the role of resilience and resilience pillars on household food consumption differentiated by SES in Zimbabwe. Cross-sectional data from 2228 rural households was collected from Zimbabwe Poverty, Income, Consumption and Expenditure Survey and PCA was used for computing the resilience indices. NBR and linear regression analyses were used for empirical analysis. In addition, we investigated the effect of resilience capacity and pillars on food consumption differentiated by household SES.
The descriptive statistics highlight that male-headed households had higher dietary diversification, food consumption and resilience capacity compared to their female counterparts. The econometric study findings show that resilience capacity improved household food consumption across all socio-economic classes and effects are more pronounced among poorer households. With regards to resilience pillars, the study findings highlight that AC, AST and ABS were correlated with better household food consumption while SSN positively improved food consumption among the poorest households only. Households residing in low rainfall areas had reduced food consumption.
Resilience improved food consumption across all the socio-economic classes. However, the magnitude of the effects is higher among poorer compared non-poor households. Turning to the resilience capacity pillars, results show that AC increased food consumption among households in quintiles 2 and 3 while AST and SSN positively improved food consumption among the poorest households only. ABS resulted in enhanced household food consumption across all the socio-economic classes. Overall, study findings show that resilience capacity pillars improved food consumption, but the effects vary depending on socio-economic class and the effect sizes tend to be higher among poorer households.
8. Policy implications
Four important policy implications emerge from the findings of this analysis. First, descriptive statistics highlighted that female-headed households had lower resilience capacity and food consumption than male-headed households. It is acknowledged that women in developing countries have little control of productive AST that are crucial for nutrition security. Therefore, interventions that deliberately focus on building resilience capacities and improving women empowerment and inclusiveness should be promoted through gender mainstreaming programming.
Second, drought reduced food consumption. In addition, households residing in low rainfall areas have lower food consumption. Hence, government, policymakers, program implementers and international development partners need to promote investments in climate smart agricultural practices to cushion household food consumption from negative effects of drought and low rainfall. Examples of climate smart agricultural practices potentially include drought tolerant crops and varieties, drought tolerant livestock breeds, soil and water conservation technologies.
Third, public and private sectors and policy makers should consider promoting interventions that increase AC, AST and ABS across all socio-economic classes of households with special focus on poor households and low rainfall areas. SSN should continue to be efficiently targeted to poorer households. Resilience building interventions (such as promoting crop and livestock diversification, home vegetable gardens, small livestock production and aquaculture) are particularly important for the country context and should be promoted to boost food consumption and maintain the environment. These should be complemented with interventions that improve human capital development, extension, road and telecommunication infrastructure.
Fourth, resilience building interventions should be promoted across all socio-economic classes of households. The effects of resilience capacity on food consumption tend to be higher among poorer households relative to the non-poor. The result that SSN is significant among the poor means that the public, private and civil society should continue providing safety nets to the poorer households. Thus resilience building interventions need to be inclusive of poorer and marginalized societies. Hence, government and development agencies should deliberately target poorer households and those residing in low rainfall areas and focus on improving their resilience capacities and food consumption.
9. Study limitations
The study findings need to be interpreted with caution given some limitations with the data. The choice of variables used to compute resilience pillars was limited by the data available, for example the data lacked sufficient variables to calculate SSN and we had to rely on one variable. Resilience is complex and multidimensional concept which is difficult to measure. In addition, the study is based on recall and not immune to the associated recall bias. The study used cross-sectional data which fail to account for seasonality in food consumption. Future studies that use longer panel data are recommended to account for causality and heterogeneity. In addition, the results are not generalized to the country owing to the small sample used in the analysis.
Ethics and consent
This study used data from public domain and permission were approved by ZIMSTAT.
Acknowledgment
The authors thank their mentor’s Dr Precious Zhikali and Dr Innocent Matshe for their useful review comments. They are also grateful to Dr Gibson Chigumira and Dr Rob Swinkels for their leadership.
Disclosure statement
No potential conflict of interest was reported by the author(s).
Additional information
Funding
Notes on contributors

Conrad Murendo
Conrad Murendo is the Collaboration, Learning and Adaptation Lead with CARE International, Zimbabwe. He holds a PhD in Agricultural Economics from the University of Goettingen, Germany. His research experiences are in food and nutrition security, gender, health economics, consumer finance, and technology adoption.
Givious Sisito
Givious Sisito is a Chief Research Officer in the Ministry of Lands, Agriculture, Water and Rural Resettlement, Zimbabwe. He holds an MSc in Operations Research from National University of Science and Technology, Zimbabwe. His research experience is on livestock production systems, climate and economic modelling, agricultural development, and community stakeholder engagements.
Grown Chirongwe
Grown Chirongwe is an Economist at Zimbabwe National Statistics Agency. He holds a MSc in Economics from the University of Zimbabwe. His research experiences are in poverty analysis, financial economics and international development.
This study contributes to the literature on resilience, food consumption, and socio-economic disparities in a developing country context.
References
- Ado, A. M., Savadogo, P., & Abdoul-Azize, H. T. (2019). Livelihood strategies and household resilience to food insecurity: Insight from a farming community in Aguie district of Niger. Agriculture and Human Values, 36(4), 747–23. https://doi.org/10.1007/s10460-019-09951-0
- Ansah, I. G. K., Gardebroek, C., & Ihle, R. (2019). Resilience and household food security: A review of concepts, methodological approaches and empirical evidence. Food Security, 11(6), 1187–1203. https://doi.org/10.1007/s12571-019-00968-1
- Arslan, A., McCarthy, N., Lipper, L., Asfaw, S., Cattaneo, A., & Kokwe, M. (2015). Climate smart agriculture? Assessing the adaptation implications in Zambia. Journal of Agricultural Economics, 66(3), 753–780. https://doi.org/10.1111/1477-9552.12107
- Asmamaw, M., Mereta, S. T., Ambelu, A., & Muneepeerakul, R. (2019). Exploring households’ resilience to climate change-induced shocks using climate resilience index in Dinki watershed, central highlands of Ethiopia. PLoS One, 14(7), e0219393. https://doi.org/10.1371/journal.pone.0219393
- Barrett, C. B., Ghezzi-Kopel, K., Hoddinott, J., Homami, N., Tennant, E., Upton, J., & Wu, T. (2021). A scoping review of the development resilience literature: Theory, methods and evidence. World Development, 146, 105612. https://doi.org/10.1016/j.worlddev.2021.105612
- Béné, C. (2020). Resilience of local food systems and links to food security – a review of some important concepts in the context of COVID-19 and other shocks. Food Security, 12(4), 805–822. https://doi.org/10.1007/s12571-020-01076-1
- Béné, C., Headey, D., Haddad, L., & Grebmer, K. V. (2016). Is resilience a useful concept in the context of food security and nutrition programmes? Some conceptual and practical considerations. Food Security, 8(1), 123–138. https://doi.org/10.1007/s12571-015-0526-x
- Cameron, A. C., & Trivedi, P. K., 2010. Microeconometrics using Stata. Stata Press, College Station Tex., xlii, 706.
- Chirisa, I., Mavhima, B., Nyevera, T., Chigudu, A., Makochekanwa, A., Matai, J., Masunda, T., Chandaengerwa, E. K., Machingura, F., Moyo, S., Chirisa, H., Mhloyi, M., Murwira, A., Mhandara, L., Katsande, R., Muchena, K., Manjeya, E., Nyika, T., & Mundau, L. (2021). The impact and implications of COVID-19: Reflections on the Zimbabwean society. Social Sciences & Humanities Open, 4(1), 100183. https://doi.org/10.1016/j.ssaho.2021.100183
- Cissé, J. D., & Barrett, C. B. (2018). Estimating development resilience: A conditional moments-based approach. Journal of Development Economics, 135, 272–284. https://doi.org/10.1016/j.jdeveco.2018.04.002
- d’Errico, M., Letta, M., Montalbano, P., & Pietrelli, R. (2019). Resilience thresholds to temperature anomalies: A long-run test for rural Tanzania. Ecological Economics, 164, 106365. https://doi.org/10.1016/j.ecolecon.2019.106365
- d’Errico, M., & Pietrelli, R. (2017). Resilience and child malnutrition in Mali. Food Security, 9(2), 355–370. https://doi.org/10.1007/s12571-017-0652-8
- d’Errico, M., Romano, D., & Pietrelli, R. (2018). Household resilience to food insecurity: Evidence from Tanzania and Uganda. Food Security, 10(4), 1033–1054. https://doi.org/10.1007/s12571-018-0820-5
- Field, A. P. (2013). Discovering statistics using IBM SPSS statistics: And sex and drugs and rock ‘n’ roll/Andy Field (4th ed.). SAGE.
- Fuller, R., & Lain, J. (2020). Are female-headed households less resilient? Evidence from Oxfam’s impact evaluations. Climate and Development, 12(5), 420–435. https://doi.org/10.1080/17565529.2019.1637330
- Haile, D., Seyoum, A., & Azmeraw, A. (2022). Food and nutrition security impacts of resilience capacity: Evidence from rural Ethiopia. Journal of Agriculture and Food Research, 8, 100305. https://doi.org/10.1016/j.jafr.2022.100305
- Haile, K. K., Nillesen, E., & Tirivayi, N. (2020). Impact of formal climate risk transfer mechanisms on risk-aversion: Empirical evidence from rural Ethiopia. World Development, 130, 104930. https://doi.org/10.1016/j.worlddev.2020.104930
- Harttgen, K., Klasen, S., & Rischke, R. (2016). Analyzing nutritional impacts of price and income related shocks in Malawi: Simulating household entitlements to food. Food Policy, 60, 31–43. https://doi.org/10.1016/j.foodpol.2015.03.007
- Hoddinott, J. (2006). Shocks and their consequences across and within households in Rural Zimbabwe. The Journal of Development Studies, 42(2), 301–321. https://doi.org/10.1080/00220380500405501
- Jones, L., & d’Errico, M. (2019). Whose resilience matters? Like-for-like comparison of objective and subjective evaluations of resilience. World Development, 124, 104632. https://doi.org/10.1016/j.worlddev.2019.104632
- Kennedy, G., Berardo, A., Papavero, C., Horjus, P., Ballard, T., Dop, M., Delbaere, J., & Brouwer, I. D. (2010). Proxy measures of household food consumption for food security assessment and surveillance: Comparison of the household dietary diversity and food consumption scores. Public Health Nutrition, 13(12), 2010–2018. https://doi.org/10.1017/S136898001000145X
- Lascano Galarza, M. X. (2020). Resilience to food insecurity: Theory and empirical evidence from international food assistance in Malawi. Journal of Agricultural Economics, 71(3), 936–961. https://doi.org/10.1111/1477-9552.12397
- Leroy, J. L., Ruel, M., Frongillo, E. A., Harris, J., & Ballard, T. J. (2015). Measuring the food access dimension of food security: A critical review and mapping of indicators. Food and Nutrition Bulletin, 36(2), 167–195. https://doi.org/10.1177/0379572115587274
- Maass, B. L., Musale, D. K., Chiuri, W. L., Gassner, A., & Peters, M. (2012). Challenges and opportunities for smallholder livestock production in post-conflict South Kivu, eastern DR Congo. Tropical Animal Health and Production, 44(6), 1221–1232. https://doi.org/10.1007/s11250-011-0061-5
- Malik, A., d’Errico, M., Omolo, D., & Gichane, B. (2020). Building resilience in Somalia; evidence from field data collection. Journal of Development Effectiveness, 12(4), 323–340. https://doi.org/10.1080/19439342.2020.1840421
- Mashizha, T. M. (2019). Building adaptive capacity: Reducing the climate vulnerability of smallholder farmers in Zimbabwe. Business Strategy & Development, 2(3), 166–172. https://doi.org/10.1002/bsd2.50
- Mavhura, E., Manyangadze, T., & Aryal, K. R. (2021). A composite inherent resilience index for Zimbabwe: An adaptation of the disaster resilience of place model. International Journal of Disaster Risk Reduction, 57, 102152. https://doi.org/10.1016/j.ijdrr.2021.102152
- Murendo, C., Kairezi, G., & Mazvimavi, K. (2020). Resilience capacities and household nutrition in the presence of shocks. Evidence from Malawi World Development Perspectives, 20, 100241. https://doi.org/10.1016/j.wdp.2020.100241
- Murendo, C., Nhau, B., Mazvimavi, K., Khanye, T., & Gwara, S. (2018). Nutrition education, farm production diversity, and commercialization on household and individual dietary diversity in Zimbabwe. Food & Nutrition Research, 62. https://doi.org/10.29219/fnr.v62.1276
- Muricho, D. N., Otieno, D. J., Oluoch-Kosura, W., & Jirström, M. (2019). Building pastoralists’ resilience to shocks for sustainable disaster risk mitigation: Lessons from West Pokot County, Kenya. International Journal of Disaster Risk Reduction, 34, 429–435. https://doi.org/10.1016/j.ijdrr.2018.12.012
- Musiyiwa, K., Harris, D., Filho, W. L., Gwenzi, W., & Nyamangara, J. (2017). An assessment of smallholder soil and water conservation practices and perceptions in contrasting agro-ecological regions in Zimbabwe. Water Resources and Rural Development, 9, 1–11. https://doi.org/10.1016/j.wrr.2016.09.001
- Okoye, B. C., Abass, A., Bachwenkizi, B., Asumugha, G., Alenkhe, B., Ranaivoson, R., Randrianarivelo, R., Rabemanantsoa, N., Ralimanana, I., & Elliott, C. (2016). Effect of transaction costs on market participation among smallholder cassava farmers in Central Madagascar. Cogent Economics & Finance, 4(1), 318. https://doi.org/10.1080/23322039.2016.1143597
- Otchere, F., & Handa, S. (2022). Building resilience through social protection: Evidence from Malawi. The Journal of Development Studies, 58(10), 1958–1980. https://doi.org/10.1080/00220388.2022.2075733
- Paitoonpong, S., Abe, S., & Puopongsakorn, N. (2008). The meaning of “social safety nets”. Journal of Asian Economics, 19(5–6), 467–473. https://doi.org/10.1016/j.asieco.2008.09.011
- Pauzé, E., Batal, M., Philizaire, Y., Blanchet, R., & Sanou, D. (2016). Determinants of diet quality among rural households in an intervention zone of Grande Anse, Haiti. Food Security, 8(6), 1123–1134. https://doi.org/10.1007/s12571-016-0615-5
- Ruel, M. T., Quisumbing, A. R., & Balagamwala, M. (2018). Nutrition-sensitive agriculture: What have we learned so far? Global Food Security, 17, 128–153. https://doi.org/10.1016/j.gfs.2018.01.002
- Sakyi-Nyarko, C., Ahmad, A. H., & Green, C. J. (2022). The gender-differential effect of financial inclusion on household financial resilience. The Journal of Development Studies, 58(4), 692–712. https://doi.org/10.1080/00220388.2021.2013467
- Shively, G. E. (2017). Infrastructure mitigates the sensitivity of child growth to local agriculture and rainfall in Nepal and Uganda. Proceedings of the National Academy of Sciences of the United States of America, 114(5), 903–908. https://doi.org/10.1073/pnas.1524482114
- Smith, L. C., & Frankenberger, T. R. (2018). Does resilience capacity reduce the negative impact of shocks on household food security?: Evidence from the 2014 Floods in Northern Bangladesh. World Development, 102, 358–376. https://doi.org/10.1016/j.worlddev.2017.07.003
- Turrell, G., Hewitt, B., Patterson, C., & Oldenburg, B. (2003). Measuring socio-economic position in dietary research: Is choice of socio-economic indicator important? Public Health Nutrition, 6(2), 191–200. https://doi.org/10.1079/PHN2002416
- UNDP, 2019. ZRBF resilience knowledge hub: Langworthy, M., Aziz, T., and Stack, J. 2019.: ZRBF outcome monitoring survey: Round one program learning report,
- Upton, J., Constenla-Villoslada, S., & Barrett, C. B. (2022). Caveat utilitor: A comparative assessment of resilience measurement approaches. Journal of Development Economics, 157, 102873. https://doi.org/10.1016/j.jdeveco.2022.102873
- Vyas, S., & Kumaranayake, L. (2006). Constructing socio-economic status indices: How to use principal components analysis. Health Policy and Planning, 21(6), 459–468. https://doi.org/10.1093/heapol/czl029
- Wooldridge, J. M. (2010). Econometric analysis of cross section and panel data (2nd ed.). MIT.
- ZIMSTAT, 2018. Income, consumption and expenditure survey 2017 report. Zimbabwe National Statistics Agency.
- ZIMSTAT, 2019. Zimbabwe smallholder agricultural productivity survey 2017 report. Zimbabwe National Statistics Agency.
Annex
Robustness checks using food consumption score as the dependent variable
Table A1. Correlation between resilience capacity and household food consumption score
Table A2. Correlation between resilience capacity and household food consumption score by socio-economic status
Table A3. Correlation between resilience capacity pillars and food consumption score
Table A4. Correlation between resilience pillars on food consumption score by socio-economic status