
 ?Mathematical formulae have been encoded as MathML and are displayed in this HTML version using MathJax in order to improve their display. Uncheck the box to turn MathJax off. This feature requires Javascript. Click on a formula to zoom.
Abstract
Our study uses the quantile vector autoregressive (QVAR) network approach to compare the median-based and tail connectedness in BRICS equity markets using daily time series spanning from 3rd March 2020 to 9th September 2022. The study is conducted on both returns and volatility series, and the findings from our static and dynamic analysis can be summarized as follows. From the static perspective, we observe stronger connectedness and spillover effects on the left and right (right only) tails for returns (volatility) series. For the returns series, China and South Africa (Brazil, Russia and India) are net receivers (transmitters) of shocks at the left tail and median quantiles whilst China and Russia (Brazil, India and South Africa) are net receivers (transmitters) at the right-tail, whereas for the volatility series China and India (Brazil, Russia and South Africa) are the net receivers (transmitters) at both quantile tails, whilst Brazil (Russia, India, China and South Africa) is (are) the net receiver(s) (transmitters) at the median. From a dynamic perspective, time-varying total connectedness is higher at the median (tail-end) quantile(s) during the COVID-19 pandemic (Russia–Ukraine war). Moreover, the time-varying market-specific analysis distinguishes which individual equities are most or least vulnerable to systemic tail-risk transmission effects during the COVID-19 pandemic and more recent Russia–Ukraine. Ultimately, these findings are relevant for investors in their search for better hedging opportunities in equity markets as well as for market regulators who can use systematic risk as an early warning signal for contagion and market crash.
1. Introduction
Understanding tail connectedness amongst financial assets during Black Swan events, such as the COVID-19 pandemic and Russia–Ukraine conflict’, is important for investors and policymakers in measuring and evaluating systemic market risk. This is because these black swan episodes are “extreme” and “rare” events which cause much panic and turmoil in financial markets and the return/risks associated with financial assets during these periods is often concentrated at the tails or extreme ends of their probability distributions. For instance, global equity markets have widely fluctuated to extreme values since the start of the pandemic, reaching lows during the initial declaration of the virus as a pandemic in March 2020 (Zhang et al., Citation2020), to reaching record highs subsequent to the announcement of the Omicron variant in November 2021 (Ozkan, Citation2021), to sharply declining stock prices experienced during the more recent Russia–Ukraine (Vo et al., Citation2022).
Nonetheless, most studies which have investigated connectedness in equity markets during these recent black swan events have relied on “mean-based” estimation techniques which ignore tail-risk connectedness existing at the tail-end distribution of the data (Amar et al., Citation2021; Bossman et al., Citation2022; Costa et al., Citation2022; Lui et al., Citation2022; Naeem et al., Citation2022; Rehman et al., Citation2022; Yu et al., Citation2021). Interestingly, some recent studies have found significant tail-risk behavior in cryptocurrency markets (Bouri et al., Citation2021; Urom et al., Citation2022), the oil-stock nexus (Liu et al., Citation2021), commodities markets (Jena et al., Citation2022; Mensi et al., Citation2021; Shahzad et al., Citation2019) during the COVID-19 pandemic but no empirical research, to the best of our knowledge, has focused on tail-risk connectedness in equity markets during the more recent Russia–Ukraine conflict.
Notably, the “origins” of the most recent “black swan” events have emerged from within the BRICS countries, with the COVID-19 virus being firstly detected in Wuhan, China, and the Russia–Ukraine conflict being triggered by the invasion of Russia into Ukraine. Moreover, the first cases of the Beta, Gamma, Delta and Omicron variants of the COVID virus were documented in South Africa (May 2020), Brazil (November 2020), India (October 2020) and South Africa (November 2021), respectively (Vo et al., Citation2022). The recent war-induced geopolitical tensions between the G7 countries and Russia have created opportunity to strengthen (and possibly expand) the BRICS alliance through increased business, trade and financial ties (Boubaker et al., Citation2022). For instance, the divestment of multinational companies from Russia, who have either withdrawn or suspended their operations in the country, has created an opportunity for Chinese companies to “fill the investment void” in Russia whilst India and China have increased their energy dependence on Russia and currently account for over half of the country’s oil exports (Glambosky & Peterburgsky, Citation2022). Another major development occurred at the most recent 14th BRICS summit, with the introduction of a new currency reserve as an attempt to reduce the unipolar dominance of the dollar (Koyuncu, Citation2022). The cumulation of these recent events makes the BRICS countries an interesting case study for investigating tail risk connectedness amongst equity markets as these nations are not only epicenters of the recent black swan events but continue to strengthen their economic and financial ties amidst the increasing geopolitical tensions and global uncertainty.
Our study investigates the tail risk connectedness amongst BRICS stock markets across the COVID-19 pandemic and Russia–Ukraine war using the quantile connectedness approach of Ando et al. (Citation2022). This method applies the quantile vector autoregressive (QVAR) model to estimate the median and tail-ended spillovers within the Diebold and Yilmaz (Citation2009, 2012) connectedness framework. In following recent literature (Ando et al., Citation2022; Bouri et al., Citation2021; Jena et al., Citation2022; Liu et al., Citation2021; Mensi et al., Citation2021; Shahzad et al., Citation2019, Urom et al., Citation2020), we define the upper (95th), middle (50th) and lower (5th) quantiles of the QVAR regression as being analogous to measuring stock market spillover effects during bull, normal and bear markets, respectively. This, in turn, allows us to identify the individual net transmitters and net receivers of systemic shocks as well as to detect the system-wide connectedness and contagion build-up effects at different states of the market.
Our proposed methodological approach differs from the estimation techniques used in most previous BRICS-related studies such as the generalized autoregressive conditional heteroscedasticity (GARCH)-type model (Bhar & Nikolova, Citation2009; Bonga-Bonga, Citation2017, Citation2018; Malik et al., Citation2022; Panda & Thiripalraju, Citation2018), time varying parameter vector autoregressive (TVY-VAR) models (Chen, Citation2022; Shi, Citation2021), wavelet clustering and artificial neural network forecasting (Mati et al., Citation2022) and cointegration tests (Siddiqui et al., Citation2022) which all ignore tail-end connectedness in their empirical design. Moreover, with the exception of Shi (Citation2021) and Yu et al. (Citation2021), previous studies use data corresponding to periods prior to the COVID-19 pandemic and thus neglect the impact which more recent black sawn events have had on BRICS equity market spillovers. Our study is also motivated by the mixed empirical evidence obtained in these previous BRICS-related literatures, and for reference sake we summarize the findings of these previous studies in Table in the Appendix.
Our study adds new knowledge to the literature by examining the connectedness of BRICS equities across different states of the markets during the COVID-19 pandemic and Russia–Ukraine war. Our findings will help identify the net transmitters and receivers of shocks at systemic-wide and country-specific levels amongst the BRICS countries across bears markets, bull markets and normal periods and further inform if contagion effects amongst BRICS equities differ across different states of the market. Policymakers would be interested in our findings as they can be used to assess whether the strengthening of geopolitical ties during the “new normal” could be of mutual benefit to all BRICS countries through risk-sharing (Bonga-Bonga, Citation2018). Our findings would also be useful to market regulators as they can serve as “early warning system” in evaluating global market risk (An et al., Citation2022). Finally, investors and fund managers may benefit from our findings in their quest to improve their portfolio selection and risk management strategies.
The remainder of the study is structured as follows. Section 2 presents the literature review. Section 3 outlines the study’s methodology. Section 4 presents the data whilst section 5 presents the empirical results. Section 6 concludes the study with policy implications and avenues for future research.
2. Literature review
Many authors have categorized the COVID-19 pandemic and the Russia–Ukraine war as the most recent “black swan events” since they satisfy all attributes of the definition proposed by Taleb (Citation2007), i.e. “ … First, it is an outlier, as it lies outside the realm of regular expectation. Second, it carries an extreme impact. Lastly, in spite of its outlier status, human nature makes us concoct explanations for its occurrence … ” (Antipova, Citation2021; Yousaf et al., Citation2022, Citation2022; Zhang et al., Citation2020). In his seminal work, Taleb (Citation2007) criticized Gaussian-based theoretical models, such as the Modern Portfolio Theory (MPT) and the Black-Scholes-Merton model, as being inefficient in estimating the tail events. Taleb (Citation2005) further argued that fat tails observed in equities prices during Black Swan events, such as the Great Market Crash (Black Monday) of 1987, are contagious, such that two stock market processes, one of finite variance and the other of infinite variance, will co-evolve as infinite processes in accordance with the power law of distribution. Forbes and Rigobon (Citation2002) more formally define this concept as “contagion effects” which can be measured as systematic financial spillover effects exceeding their normal levels of connectedness.
The literature is filled with methods which have been used to quantify tail-risk connectedness within financial markets. Amongst the most popular of these methods is the Conditional value-at-risk (CoVaR) model introduced by Adrian and Brunnermerier (Citation2016) as a tail dependency measure of an institution’s loss distribution conditional on other institutions being in distress and is used to compute an institution’s contribution to overall systemic risk. Engle and Manganelli (Citation2004) extend the CoVar at conditional quantiles over time using a set of autoregressive (AR)-type models, i.e. Conditional autoregressive Value-at-Risk (CaViaR) model. White et al. (Citation2015) further build on Engle and Manganelli’s (Citation2004) CaViaR model to the multivariate vector autoregressive (VAR) case, i.e. VAR for VaR model. Hautsch et al. (Citation2015) and Hardle et al. (Citation2016) present high dimensional, tail-event driven network (TENET) analysis which applies LASSO as a variable selection technique to a single indexed model (SIM) estimated within a generalized quantile regression. This method allows for ranking of systemic transmitters and receivers of tail-shocks within the network.
Other methods used to measure tail-risk connectedness include the co-exceedances approach introduced by Bae et al. (Citation2003) which uses a multinominal logit model to compute the probability of extreme returns under a quantile approach, i.e. co-incidences of joint extreme returns. Chan-Lau et al. (Citation2004) use extreme value theory as a statistical approach to measuring co-exceedances in financial markets. Cappiello et al. (Citation2006) propose a semi-parametric strategy to estimate the systemic tail codependence between assets in “co-movement box” using time-varying quantile regressions and measure contagion or quantile exceedance as the conditional probability of co-movements amongst markets being above some threshold level. Zhu et al. (Citation2019) develop a network quantile autoregression (NQAR) model to measure tail-connectedness in complex financial networks using a high-dimensional set-up. More recently, Ando et al. (Citation2022) build on the Diebold and Yilmaz (Citation2012) approach for network connectedness by using a quantile vector autoregressive (VAR) framework to capture tail-connectedness at extreme ends of the model.
Several studies have used the discussed methods to evaluate tail risk connectedness in equity markets. For instance, Baur and Schulze (Citation2005), Christian and Ranaldo (Citation2009) and Markwat et al. (Citation2009) all use the multinominal logit model of co-exceedances of Bae et al. (Citation2003) to measure tail-connectedness amongst various stock markets. Beine et al. (Citation2010) apply the co-exceedances of Cappiello et al. (Citation2006) to 17 mature markets and find that financial liberalization had a positive effect on the left tail of stock returns. Qian et al. (Citation2020) adopt the LASSO quantile regression and network analysis of Hardle et al. (Citation2016) to model the network tail-connectedness amongst 49 US industries and find that Coal (Gold) sector is the most consistent transmitters (receivers) of systemic risk across all distributional quantiles. Zhang et al. (Citation2020) also use the TENET framework to Chinese companies and observe higher network connectedness when the market is exposed to higher volatility, with utilities and finance being the most influential sectors in the network. Salisu et al. (Citation2022) use the CaViaR model of Engle and Manganelli (Citation2004) to Canadian, US and six European equities and find strong tail risk between US and Canada as well as between the US and EU markets but not between Canada and the EU.
Some recent studies, which are closer in nature to our research, have applied the quantile connectedness method of Ando et al. (Citation2022) to various markets and confirm strong tail spillover effects amongst cryptocurrency markets (Bouri et al., Citation2021; Urom et al., Citation2020), the oil markets (Liu et al., Citation2021) and commodities markets (Jena et al., Citation2022; Mensi et al., Citation2021; Shahzad et al., Citation2019). A consensus from these studies is that market connectedness is more concentrated at the quantile ends of distribution and the rankings of net transmitters and receivers of tail-end shocks within the system vary across time as well as across different markets. This differs from the analysis presented by other studies using probability-based models, such as the CoVaR and CaViaR, which analyze a single-point on the tail-end distribution and assume that rankings of net transmitters and receivers only vary across quantiles but remain static over time (Cappiello et al., Citation2006).
Our study contributes to the literature by applying the QVAR-based connectedness model to investigate the tail-risk connectedness for BRICS equity markets for periods covering the COVID-19 pandemic and Russia–Ukraine war and, to the best of our knowledge, is the first of its kind. Whilst we acknowledge some recent studies which have assessed the impact of the “war” on equity markets (Ahmed et al., Citation2022; Boubaker et al., Citation2022; Boungou & Yatie, Citation2022; Federle et al., Citation2022; Mohamad, Citation2022; Ngwakwe, Citation2022; Sun & Zhang, Citation2022; Yousaf et al., Citation2022), these previous studies employ mean-based estimation techniques that ignore tail-end connectedness. Our study fills this empirical gap.
3. Methodology
To investigate the quantile connectedness among the BRICS equity markets, we applied the QVAR to the return and volatility series of BRICS equities. Basically, our estimation procedure follows two stages. First, the conditional volatility for each equity market return is generated using the univariate GARCH model. Second, the QVAR approach is applied to capture both the static and dynamic connectedness of return and volatility among the BRICS equity markets. The details of the estimation procedures are presented and discussed in the subsection below.
3.1. Conditional volatility
We generate the conditional volatility series for each equity markets return following the univariate GARCH model developed Bollerslev et al. (Citation1992). Specifically, the univariate GARCH (1,1) model is fitted to each return process as:
where EquationEquation 1(1)
(1) and EquationEquation 2
(2)
(2) represent the return and volatility process, respectively. Also,
denotes the return from each BRICS equity market;
and
are the ARCH and GARCH parameters which are non-negative shocks and persistent parameters; and the conditional variance,
measures the volatility of each equity return. After generating the return and condition volatility, the next stage is to apply the QVAR model.
3.2. Quantile connectedness
To compute the quantile connectedness and spillover among the BRICS equities, we defined the infinite order-based vector moving average specification of QVAR as:
where and
are dimensional vector of return and conditional volatility generated from EquationEquation 1
(1)
(1) and EquationEquation 2
(2)
(2) . The quantile
) ranges from 0 to 1. We specified the quantiles for this paper as 5th, 50th and 95th, corresponding to lower (left tail), median, and upper (right tail) quantiles, respectively. The quantiles also represent different market conditions, namely the bearish, normal, and bullish markets, respectively.
Following the generalised forecast error variance decomposition (GFEVD) frameworks developed by Koop et al. (Citation1996) and Pesaran and Shin (Citation1998), the H-step-ahead forecast error variance decomposition matrix is expressed as:
where is a zero vector with unity on the
position. The decomposition matrix is normalised as:
Based on the Diebold and Yilmaz (Citation2012, Citation2014), different measures of connectedness and risk spillover can be obtained based on the GFEVD. We obtained the total connectedness index (TCI) at each quantile by using the expression:
where TCI index measures the average contribution of shocks to the forecast error variance among the BRICS markets. In addition, the direction of return and volatility spillover can be determined. That is, spillovers transmitted to (TO) a given market ( from other BRICS markets
as well as the amount of spillovers received by other BRICS markets (
from (From) market
can be obtained using the expression in EquationEquation 7
(7)
(7) and EquationEquation 8
(8)
(8) below:
Following EquationEquation 7(7)
(7) and EquationEquation 8
(8)
(8) , the net directional spillover for each BRICS market can be calculated as the difference between the gross return/volatility transmitted from market
to other markets (
and gross return/volatility received by market
from other financial markets (
. This is expressed as:
From EquationEquation 9(9)
(9) , a positive net value indicates that the market under consideration is a net transmitter while a negative value indicates a net receiver.
4. Data
Our analysis of quantile connectedness among the BRICS equity markets uses daily closing stock price index over the period from 11 March 2020 – 30 June 2022. The sample period in this paper is defined based on the World Health Organisation (WHO) declaration of COVID-19 outbreak as a global health pandemic on 11 March 2020. Also, the sample covers the first four months of the Russia–Ukraine war. All the equity price indexes were obtained from the Investing.com website. We transformed the index into return by taking the first difference of natural logarithms of each index by
, where
is the equity price index at time
and
.
Table reports the descriptive statistics for the return (panel A) and volatility (panel B) over the sample period. The report in panel A shows that South Africa (0.08%) and India (0.07%) recorded the highest average daily returns while Russia reported negative return of −0.65%. However, the report reveals that variations in returns as measured by the standard deviation are higher for Russia (3.92%), followed by Brazil (1.97%), India, South Africa, and China. The skewness coefficients are all negative, indicating that the return series have heavy left-tail distribution. Also, the kurtosis coefficients indicate a heavy tailed distribution as they are all greater than 3. The Jarque–Bera test indicates non-normality the equity return series.
Table 1. Descriptive statistics
We further explored the behaviour of return and volatility over the sample period by presenting their time-varying patterns in Figure . Looking at the return plot in the upper half of the figure, we identified two major episodes of volatility clustering. First, we noted evidence of volatility clustering around the early stage of the COVID-19 pandemic (March 2020 – June 2020) as indicated by the number of spikes. Second, evidence of volatility clustering is also witnessed during the period from November 2021 – June 2022, which is associated with the discovery of the Omicron variant of COVID-19 and Russian-Ukraine war. This finding is consistent with the ARCH and Ljung-Box (LB) test results, showing evidence of volatility clustering. Therefore, this result supports the use of GARCH framework in generating the conditional volatility.
Figure 1. Evolution of return and volatility.
Like panel A, the analysis of daily equity market volatility in panel B of Table reveals some interesting information. It is evident that Russian experienced the highest fluctuation with an average daily conditional volatility of 14.26%, followed by Brazil (3.88%), India (2.58%), South Africa (2.14%) and China (1.28%). Also, the standard deviation confirms similar results, indicating that Russia has the highest rate of volatility, whereas China is the least volatile market. As in the upper half of Figure , we identified the same patterns in the lower half of the figure which shows the volatility behaviour over the period. The ARCH and LB test results show there is no further clustering, which indicates the robustness of the estimated GARCH(1,1) model. The detailed estimate of the GARCH model is reported in Table of the Appendix. Lastly, the unit root test results show that both return and volatility series are stationary. In addition, we applied the Zivot-Andrews structural break unit root test and show that all the return series are stationary except for China (return) and South Africa (volatility). While the break point date for the return series differs among the BRICS, the break point for volatility series appears to cluster around the beginning of the Russia–Ukraine war. The detailed results of Zivot–Andrews unit root test are reported in Table in the Appendix. Given these findings, the following section provides the empirical results from the QVAR model used to analyse tail risk among the BRICS equity markets.
5. Empirical results
In this section, we present the results of the static and dynamic connectedness among the BRICS equity markets. We analysed the extreme tail connectedness and spillover using 10-step-ahead forecast horizon with automatic lag selection based on the Akaike Information criteria (AIC) and 150-days rolling window. Our empirical results are divided into two parts. The first part considers the static connectedness and spillover, while the second part focuses on the time-varying connectedness and net directional spillover among the markets.
5.1. Static connectedness and spillover
We report the static connectedness and spillover among the BRICS in Tables for return and volatility across the three quantiles (lower, median and upper). Focusing on the return connectedness in Table , we report that the total connectedness index (TCI) among the BRICS equity markets is highest in the lower tail (71.43%), followed by upper tail (69.58%) and median (25.97%). This result implies asymmetric behaviour among the BRICS equity market returns. Importantly, it suggests that the BRICS market returns are more sensitive during bearish and bullish market conditions compared to normal period. These findings are in line with the studies by Billah et al. (Citation2022) and Bossman and Gubareva (Citation2023) who provided evidence of asymmetric behaviour among emerging and G7 equities and between energy commodities and BRIC markets, respectively. Considering the net spillover, the results show that Chinese equity is predominantly a net recipient of spillover across all the quantiles. While South Africa is a net recipient of spillover during bearish and normal market conditions, it is a net transmitter during bullish market condition. At the other end of the spectrum, Brazil and India are consistently the net transmitters of systemic shocks to other BRICS markets, while Russia switched from net transmitter during the bearish and normal markets conditions, to receiver during bullish market condition.
Table 2. Static connectedness and spillover (return)
Table 3. Static connectedness and spillover (volatility)
In terms of the static volatility connectedness in Table , we report strong evidence of volatility connectedness among the BRICS at upper tail (78.08%) compared to lower (35.17%) and median (23.17%) tails. While this result suggests asymmetric behaviour, it also indicates that BRICS markets are more sensitive during upside market risk than any other period. In other words, these markets are more connected during upward market condition. This result is consistent with the studies by Billah et al. (Citation2022) and Tiwari et al. (Citation2022) who found higher upper tail volatility connectedness between commodity and equity markets. On a net basis, there are variations across the three quantiles. At the lower quantile, South Africa (1.08%) is observed as the largest transmitter, followed by Brazil (1.07%) and Russia (0.66%), while China (−1.45%) and India (−1.36%) are the recipients of the systemic shocks. Also, it is observed that Brazil is the only receiver of shocks from all other BRICS markets under normal with South Africa (5.73%) and Russia (3.89%) as the major contributors. In contrast, under bullish market condition, China is the only transmitter of the systemic shocks to all other BRICS markets with India (−22.49%) and Brazil (−12.04%) as the largest recipient of the systemic shock.
Altogether, the static analysis of connectedness and spillover for return and volatility provides two key interesting results. First, the analysis shows that the extent of connectedness varies across quantiles, indicating evidence of asymmetric behaviour for return and volatility. Such behaviour suggests that investors should consider different investment strategies under various market conditions. Second, the finding shows that BRICS market returns are mostly impacted by extreme negative event whereas volatility is impacted by extreme positive event. This finding is not surprising given the growing evidence of extreme tail connectedness in financial market literature (Billah et al., Citation2022; Tiwari et al., Citation2022; Urom et al., Citation2022; Yousaf et al., Citation2022).
5.2. Dynamic connectedness and net directional spillover
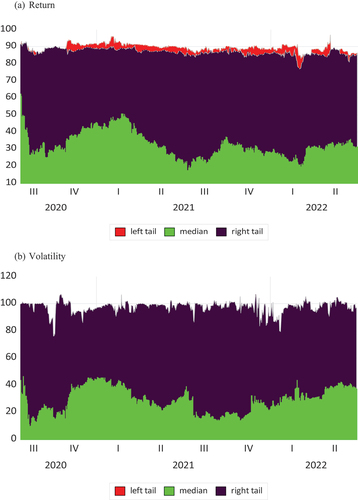
The time-varying plot for return and volatility connectedness over the sample period are presented for the three quantiles in Figure (a) and (b), respectively. We noted from Figure that the extent of return connectedness is higher at the lower (left) and upper (right) quantiles compared to the median quantile. In particular, the TCI for the lower and upper quantiles exceed 90% and 80%, respectively, while median quantile is mostly below 50%. This is consistent with the result of static analysis in Table . Also, we observed evidence of time-varying behaviour, which is more visible during normal market condition. Specifically, increased connectedness is observed during different waves of COVID-19 pandemic and Russian-Ukraine war. In terms of total volatility connectedness in Figure , we observe more connectedness at the upper quantile compared to lower and median quantiles, which is consistent with the results in Table . Like the return connectedness in Figure , we noted similar cyclical movements for volatility over the sample period in Figure . These findings suggest tail dependence and increased vulnerability among the BRICS markets during period of extreme market events.
Figure 2. Total connectedness index.
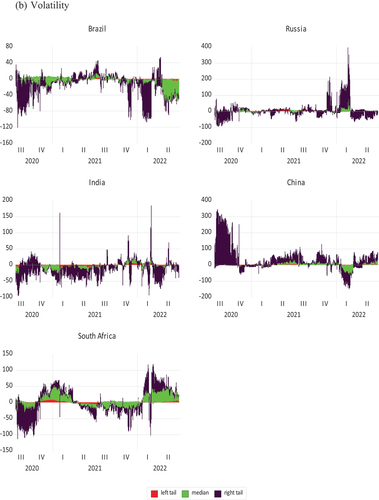
Next, we consider the net directional spillover presented in Figures for return and volatility, respectively. In both figures, a positive net value is indicated in the positive region (above the zero line), implying a net transmitter. Similarly, a negative net value is indicated in the negative region (below the zero line), implying a net receiver. Focusing on the analysis of return spillover in Figure , it is shown that the BRICS markets act as both transmitters and receivers at different periods. Specifically, we observe that the Chinese market is more of a receiver at the lower and median quantiles. Interestingly, we noted that Brazil, Russia and India are predominantly the net transmitters of systemic shocks during the first year of COVID-19 pandemic, while South Africa and China are mostly the net receivers over the same period. As in Figure , the analysis of net volatility spillover in Figure shows that the markets swing between net transmitters and receivers at different times. However, the Brazilian and Indian markets appear to be predominantly the net receivers under the median and upper quantiles, whereas China appears to be main source of the systemic shocks. These findings are consistent with static result presented in Tables .
Figure 3. Net directional spillover.
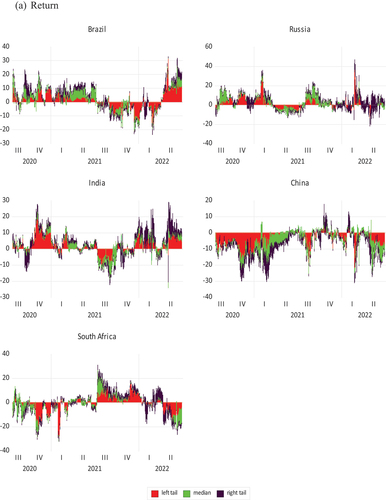
Figure 3. (Continued).
In general, the analysis of the dynamic connectedness and net directional spillover provides two major information. First, there is evidence of time-varying return and volatility behaviour with high tail dependence during the period of COVID-19 and Russia–Ukraine war. This finding is consistent with the Naeem et al. (Citation2022) who found evidence of time-varying behaviour between oil shocks and BRICS after the global financial crisis. Also, the tail risk implied by this finding suggests that using a mean-based approach is likely to underestimate this type of risks. Second, individual BRICS markets exhibit evidence of net receiver and transmitter of systemic shocks at different times. These results provide useful information about tail risk vulnerability and time-specific spillover among the BRICS markets.
6. Conclusions
This paper investigated the connectedness and spillovers among the BRICS equity market during COVID-19 pandemic and Russia–Ukraine conflict using the QVAR and daily data from 11 March 2020, to 30 June 2022. The goal of this paper is to explore the dependency structure of the BRICS equities under extreme risk events. Our main findings can be summarized as follows: We find that return and volatility connectedness is higher at the lower and upper tails relative to the median, indicating asymmetric response to extreme market conditions (bearish and bullish). Meanwhile, the quantile connectedness varies over time, emphasizing the changing dependence structure at the extreme tails. Also, we find that BRICS equity markets are receivers as well as transmitters of systemic risk at different quantiles. More specifically, the analysis returns spillover shows the dominance of Brazil and India as net transmitters, while China is a net receiver with Russia and South Africa switching between receiver and transmitter at different quantiles. However, the analysis of volatility spillover shows shifting market roles over time with China dominating other markets at the median and upper tails.
Our findings offer timely and useful information for policymakers, investors, and portfolio managers as financial markets continue to face persistently unpredictable and extreme events such as the COVID-19 pandemic and Russia–Ukraine war. The novelty of our findings shows that the degree of connectedness among the BRICS equities is dependent on varying market conditions, which is vital in designing appropriate risk management strategies. Importantly, under periods of extreme events, the best risk management strategy is to be well informed about market dynamics and asset behaviour as provided the findings of this paper. Therefore, for policymakers, our results offer useful insights regarding the return and volatility connectedness. Such information can be used to design or redesign the existing policies in the face of extreme events to ensure market stability. To investors and portfolio managers, our findings offer early-warning signs and provide support for investment decisions and diversification strategies. In particular, we recommend that diversification strategies should depend on the nature of market condition given the asymmetric and time-varying behaviour of return and volatility.
Disclosure statement
No potential conflict of interest was reported by the author(s).
References
- Adrian, T., & Brunnermeier, M. (2016). CoVaR. American Economic Review, 106(7), 1705–19. https://doi.org/10.1257/aer.20120555
- Agyei, S. K. (2023). Emerging markets equities’ response to geopolitical risk: Time-frequency evidence from the Russian-Ukrainian conflict era. Heliyon, 9(2), e13319. https://doi.org/10.1016/j.heliyon.2023.e13319
- Agyei, S. K., Owusu, J. P., Bossman, A., Asafo-Adjei, E., Asiamah, O., & Adam, A. M. (2022). Spillovers and contagion between BRIC and G7 markets: New evidence from time-frequency analysis. PloS One, 17(7), e0271088. https://doi.org/10.1371/journal.pone.0271088
- Ahmed, S., Hasan, M., & Kamal, M. (2022). Russia–Ukraine crisis: The effects on the European stock market. European Financial Management forthcoming, https://doi.org/10.1111/eufm.12386
- Amar, A., Belaid, F., Youssef, A., & Guesmi, K. (2021). Connectedness among regional financial markets in the context of the COVID-19. Applied Economic Letters, 28(20), 1789–1796. https://doi.org/10.1080/13504851.2020.1854434
- Ando, T., Greenwood-Nimmo, M., & Shin, Y. (2022). Quantile connectedness: Modelling tail behaviour in the topology of financial markets. Management Sciences, 68(4), 2401–2431. https://doi.org/10.1287/mnsc.2021.3984
- Antipova, T. (2021). Coronavirus Pandemic as Black Swan Event. In T. Antipova (Ed.), Integrated Science in Digital Age 2020. ICIS 2020. Lecture Notes in Networks and Systems (Vol. 136). Springer. https://doi.org/10.1007/978-3-030-49264-9_32
- An, H., Wang, H., Delpachitra, S., Cottrell, S., & Yu, X. (2022). Early warning system for risk of external liquidity shock in BRICS countries. Emerging Markets Review, 51(A), e100878. https://doi.org/10.1016/j.ememar.2021.100878
- Asafo-Adjei, E., Bossman, A., Boateng, E., Owusu, J. P., Idun, A. A., Agyei, S. K., Adam, A. M., & Li, Y. (2022). A nonlinear approach to quantifying investor fear in stock markets of BRIC. Mathematical Problems in Engineering, 2022, 1–20. https://doi.org/10.1155/2022/9296973
- Bae, K., Karolyi, G., & Stulz, R. (2003). A new approach to measuring financial contagion. Review of Financial Studies, 16(3), 717–763. https://doi.org/10.1093/rfs/hhg012
- Beine, M., Cosma, A., & Vermeulen, R. (2010). The dark side of global interaction: Increasing tail dependence. Journal of Banking and Finance, 34(1), 184–192. https://doi.org/10.1016/j.jbankfin.2009.07.014
- Bhar, R., & Nikolova, B. (2009). Return, volatility spillovers and dynamic correlation in the BRIC equity markets: An analysis using a bivariate EGARCH framework. Global Finance Journal, 19(3), 203–218. https://doi.org/10.1016/j.gfj.2008.09.005
- Billah, M., Karim, S., Naeem, M., & Vigne, S. (2022). Return and volatility spillovers between energy and BRIC markets: Evidence from quantile connectedness. Research in International Business and Finance, 62, e101680.
- Bollerslev, T., Chou, R., & Kroner, K. (1992). ARCH modeling in finance: A review of the theory and empirical evidence. Journal of econometrics, 52(1–2), 5–59.
- Bonga-Bonga, L. (2017). Assessing the readiness of the BRICS grouping for mutually beneficial financial integration. Review of Development Economics, 21(4), 204–219. https://doi.org/10.1111/rode.12324
- Bonga-Bonga, L. (2018). Uncovering equity market contagion among BRICS countries: An application of the multivariate GARCH model. The Quarterly Review of Economics & Finance, 67, 36–44. https://doi.org/10.1016/j.qref.2017.04.009
- Bossman, A., & Gubareva, M. (2023). Asymmetric impacts of geopolitical risk on stock markets: A comparative analysis of the E7 and G7 equities during the Russian-Ukrainian conflict. Heliyon, 9(2), e13626. https://doi.org/10.1016/j.heliyon.2023.e13626
- Bossman, A., Owusu, P., & Tiwari, A. (2022). Dynamic connectedness and spillovers between Islamic and conventional stock markets: Time- and frequency-domain approach in COVID-19 era. Heliyon, 8(4), e09215. https://doi.org/10.1016/j.heliyon.2022.e09215
- Bossman, A., Teplova, T., Umar, Z., & Wang, G. J. (2022). Do local and world COVID-19 media coverage drive stock markets? Time-frequency analysis of BRICS. Complexity, 2022, 1–14. https://doi.org/10.1155/2022/2249581
- Boubaker, S., Goodell, J., Pandey, D., & Kumari, V. (2022). Heterogenous impacts of wars on global equity markets: Evidence from the invasion of Ukraine. Finance Research Letters, 48, e102934. https://doi.org/10.1016/j.frl.2022.102934
- Boungou, W., & Yatie, A. (2022). The impact of the Ukraine-Russia war on the world stock market returns. Economics Letters, 215, e110516. https://doi.org/10.1016/j.econlet.2022.110516
- Bouri, E., Saeed, T., Vo, X., & Roubaud, D. (2021). Quantile connectedness in the cryptocurrency market. Journal of International Financial Markets, Institutions and Money, 71, e101302. https://doi.org/10.1016/j.intfin.2021.101302
- Buar, D., & Schulze, N. (2005). Coexceedances in financial markets—A quantile regression analysis of contagion. Emerging Markets Review, 6(1), 21–43. https://doi.org/10.1016/j.ememar.2004.10.001
- Cappiello, L., Gerad, B., Kadareja, A., & Manganelli, S. (2006). Measuring comovements by regression quantiles. Journal of Financial Econometrics, 12(4), 645–678. https://doi.org/10.1093/jjfinec/nbu009
- Chan-Lau, J., Mathieson, D., & Yao, J. (2004). Extreme contagion in equity markets. SSRN Electronic Journal, 386–408. https://doi.org/10.2139/ssrn.382502
- Chen, S. (2022). Research on spillover effect of financial market based on TVP-VAR model – evidence from the BRICS stock markets. World Scientific Research Journal, 3(1), 174–182. https://doi.org/10.6911/WSRJ.202203_8(3).0022
- Christian, C., & Ranaldo, A. (2009). Extreme coexceedances in new EU member states’ stock markets. Journal of Banking and Finance, 33(6), 1048–1057. https://doi.org/10.1016/j.jbankfin.2008.10.014
- Costa, A., Matos, P., & da Silva, C. (2022). Sectoral connectedness: New evidence from US stock market during the COVID-19 pandemics. Finance Research Letters, 45, e102124. https://doi.org/10.1016/j.frl.2021.102124
- Diebold, F., & Yilmaz, K. (2009). Measuring financial asset return and volatility spillovers, with an application to global equity markets. The Economic Journal, 119(534), 158–171. https://doi.org/10.1111/j.1468-0297.2008.02208.x
- Diebold, F., & Yilmaz, K. (2012). Better to give than to receive: Predictive directional measurement of volatility spillovers. International journal of forecasting, 28(1), 57–66. https://doi.org/10.1016/j.ijforecast.2011.02.006
- Diebold, F., & Yilmaz, K. (2014). On the network topology of variance decompositions: Measuring the connectedness of financial firms. Journal of econometrics, 182(1), 119–134.
- Engle, R., & Manganelli, S. (2004). CaViaR: Conditional autoregressive value at risk by regression quantiles. Journal of Business and Economic Statistics, 22(4), 367–381. https://doi.org/10.1198/073500104000000370
- Federle, J., Meier, A., Muller, G., & Sehn, V. (2022). Proximity to war: The stock market response to the Russian invasion of Ukraine. CEPR Discussion Paper No. DP17185.
- Forbes, K., & Rigobon, R. (2002). No contagion, only interdependence: Measuring stock market comovements. The Journal of Finance, 57(5), 2223–2261. https://doi.org/10.1111/0022-1082.00494
- Glambosky, M., & Peterburgsky, S. (2022). Corporate activism during the 2022 Russian invasion of Ukraine. Economic Letters, 217, e110650. https://doi.org/10.1016/j.econlet.2022.110650
- Hardle, W., Wang, W., & Yu, L. (2016). TENET: Tail-event driven network risk. Journal of Econometrics, 192(2), 499–513. https://doi.org/10.1016/j.jeconom.2016.02.013
- Hautsch, N., Schaumburg, J., & Schienle, M. (2015). Financial network systematic risk contributions. Review of Finance, 19(2), 685–738. https://doi.org/10.1093/rof/rfu010
- Jena, S., Tiwari, A., Abakah, E., & Hammoudeh, S. (2022). The connectedness in the world petroleum futures markets using a quantile VAR approach. Journal of Commodity Markets, 27, e100222. https://doi.org/10.1016/j.jcomm.2021.100222
- Koop, G., Pesaran, H., & Potter, S. (1996). Impulse response analysis in nonlinear multivariate models. Journal of econometrics, 74(1), 119–147.
- Koyuncu, M. (2022). The 14th BRICS summit: Did pandora’s box open? Ankara center for crisis and policy studies. Retrieved July 4, 2022, from https://www.ankasam.org/the-14th-brics-summit-did-pandoras-boxopen/?lang=en.
- Liu, Z., Shi, X., Zhai, P., Wu, S., Ding, Z., & Zhou, Z. (2021). Tail risk connectedness in the oil-stock nexus: Evidence from a novel quantile spillover approach. Resources Policy, 74, e102381. https://doi.org/10.1016/j.resourpol.2021.102381
- Lui, Y., Wei, Y., & Lui, Y. (2022). International stock market risk contagion during the COVID-19 pandemic. Finance Research Letters, 45, e102145. https://doi.org/10.1016/j.frl.2021.102145
- Malik, K., Sharma, S., & Kaur, M. (2022). Measuring contagion during the COVID-19 through volatility spillovers of BRIC countries using diagonal BEKK approach. Journal of Economic Studies, 49(2), 227–242. https://doi.org/10.1108/JES-05-2020-0246
- Markwat, T., Kole, E., & van Djik, D. (2009). Contagion as a domino effect in global stock markets. Journal of Banking and Finance, 33(11), 1996–2012. https://doi.org/10.1016/j.jbankfin.2009.05.008
- Mati, M., Vukovic, D., Vyklyuk, Y., & Grubisic, Z. (2022). BRICS capital markets co-movement analysis and forecasting. Risks, 10(5), 88. https://doi.org/10.3390/risks10050088
- Mensi, W., Lee, Y., Vo, W., & Yoon, S. (2021). Quantile connectedness among gold, gold mining, silver, oil and energy sector uncertainty indexes. Resources Policy, 74, e102450. https://doi.org/10.1016/j.resourpol.2021.102450
- Mohamad, A. (2022). Safe flight to which haven when Russia invades Ukraine? A 48-hour story. Economics Letters, 216, e110558. https://doi.org/10.1016/j.econlet.2022.110558
- Naeem, M., Farid, S., Arif, M., Paltrinieri, A., & Alharthi, M. (2022). COVID-19 and connectedness between sustainable and Islamic equity markets. Borsa Instabul Review, 23(1), 1–21. (forthcoming). https://doi.org/10.1016/j.bir.2022.06.001
- Ngwakwe, N. (2022). Stock market volatility during rumours of war and actual war: Case of Russia-Ukraine conflict. Acta Universitatis Danubius OEconomica, 18(3), 55–70. https://dj.univ-danubius.ro/index.php/AUDOE/article/view/1727
- Ozkan, O. (2021). Impact of COVID-19 on stock market efficiency: Evidence from developed countries. Research in International Business and Finance, 58, e101445. https://doi.org/10.1016/j.ribaf.2021.101445
- Panda, P., & Thiripalraju, M. (2018). Return and volatility spillover amongst stock markets: BRICS countries experience. Afro-Asian Journal of Finance and Accounting, 8(2), 148–166. https://doi.org/10.1504/AAJFA.2018.091057
- Pesaran, H., & Shin, Y. (1998). Generalized impulse response analysis in linear multivariate models. Economic Letters, 58(1), 17–29.
- Qian, Y., Hardle, W., & Chen, C. (2020). Modelling industry interdependency dynamics in a network context. Studies in Economics and Finance, 37(1), 50–70. https://doi.org/10.1108/SEF-07-2019-0272
- Rehman, M., Ahmad, N., Shahzad, S., & Vo, X. (2022). Dependence dynamics of stock markets during COVID-19. Emerging Markets Review, 51(B), e100894. https://doi.org/10.1016/j.ememar.2022.100894
- Salisu, A., Gupta, R., & Pierdzioch, C. (2022). Predictability of tail risks of Canada and the U.S. over a century: The role of spillovers and oil tail risks. The North American Journal of Economics & Finance, 59, e101620. https://doi.org/10.1016/j.najef.2021.101620
- Shahzad, S., Rehman, M., & Jammazi, R. (2019). Spillovers from oil to precious metals: Quantile approaches. Resources Policy, 61, 508–521. https://doi.org/10.1016/j.resourpol.2018.05.002
- Shi, K. (2021). Spillovers of stock markets among the BRICS: New evidence in time and frequency domains before the outbreak of COVID-19 pandemic. Journal of Risk and Financial Management, 14(3), 112. https://doi.org/10.3390/jrfm14030112
- Siddiqui, A., Shamim, M., Asif, M., & Al-Faryan, M. (2022). Are stock markets among BRICS members integrated? A regime shift-based co-integration analysis. Economies, 10(4), 87. https://doi.org/10.3390/economies10040087
- Sun, M., & Zhang, C. (2022). Comprehensive analysis of global stock market reactions to the Russia-Ukraine war. Applied Economic Letters, 1–8. (forthcoming). https://doi.org/10.1080/13504851.2022.2103077
- Taleb, N. (2005, March). Fat tails, asymmetric knowledge, and decision making: Essay in honor of Benoit Mandelbrot’s 80th birthday. Technical Paper Series, 56–59. Wimott.
- Taleb, N. (2007). The black swan: The impact of the highly improbable. Random House.
- Tiwari, A., Abakah, E., Adewuyi, A., & Lee, C. (2022). Quantile risk spillovers between energy and commodity markets: Evidence from pre and during COVID-19 pandemic. Energy Economics, 113, e106235. https://doi.org/10.1016/j.eneco.2022.106235
- Umar, Z., Bossman, A., Choi, S., & Vo, X. (2022). Are short stocks susceptible to geopolitical shocks? time-frequency evidence from the Russian-Ukraine conflict. Finance Research Letters 52, 103388. (forthcoming). https://doi.org/10.1016/j.frl.2022.103388
- Urom, C., Ndubuisi, G., Lo, G., & Yuni, D. (2022). Global commodity and equity market spillovers to Africa during COVID-19 pandemic. Emerging Markets Review 55, 100948. (forthcoming). https://doi.org/10.1016/j.ememar.2022.100948
- Vo, D., Ho, C., & Dang, T. (2022). Stock market volatility from the COVID-19 pandemic: New evidence from the Asia-Pacific region. Heliyon, 8(9), e10763. https://doi.org/10.1016/j.heliyon.2022.e10763
- White, H., Kim, T., & And Manganelli, S. (2015). VAR for VaR: Measuring tail dependence using multivariate regression quantiles. Journal of Econometrics, 187(1), 169–188. https://doi.org/10.1016/j.jeconom.2015.02.004
- Yousaf, I., Patel, R., & Yarovaya, L. (2022). The reaction of G20+ stock markets to the Russia-Ukraine conflict “Black-swan” event: Evidence from event study approach. Journal of Behavioural and Experimental Finance, 35, e100723. https://doi.org/10.1016/j.jbef.2022.100723
- Yu, Z., Bai, L., & Li, Y. (2021). Analysis of integration and dynamic linkages of BRICS stock markets. Advances in Economics, Business and Management Research, 166, 755–761. https://doi.org/10.2991/aebmr.k.210319.140
- Yu, H., Chu, W., Ding, Y., & Zhao, X. (2021). Risk contagion of global stock markets under COVID-19: A network connectedness approach. Accounting and Finance, 61(4), 5745–5782. https://doi.org/10.1111/acfi.12775
- Zhang, D., Hu, M., & Ji, Q. (2020). Financial markets under the global pandemic of COVID-19. Finance Research Letters, 36, e101528. https://doi.org/10.1016/j.frl.2020.101528
- Zhang, W., Zhuang, X., Wang, J., & Lu, Y. (2020). Connectedness and systemic risk spillovers analysis of Chinese sectors based on tail risk network. The North American Journal of Economics & Finance, 54, e101248. https://doi.org/10.1016/j.najef.2020.101248
- Zhu, X., Wang, W., Wang, H., & Hardle, W. (2019). Network quantile regression. Journal of Econometrics, 212(1), 345–358. https://doi.org/10.1016/j.jeconom.2019.04.034
Appendix
Table A1. Review of previous studies on BRICS equity market spillovers
Table A2. Robustness test for the GARCH model
Table A3. Zivot-Andrew structural break unit root test result