
 ?Mathematical formulae have been encoded as MathML and are displayed in this HTML version using MathJax in order to improve their display. Uncheck the box to turn MathJax off. This feature requires Javascript. Click on a formula to zoom.
Abstract
The interconnection of stock markets offers valuable insights into the broader dynamics of global financial markets. This study uses the Diebold and Yilmaz index model to analyze and measure volatility spillovers and interconnectedness among APEC stock markets. The objective is to identify major transmitters of volatility spillovers and assess the magnitude of different crisis cycles. The results show that the US is the major contributor (69.54%) to volatility spillovers in APEC stock markets, followed by Canada (52.92%) and Mexico (37.09%). These three economies are part of the highly integrated regional bloc, say, North American Free Trade Agreement (NAFTA). New Zealand has the highest net inflow of spillovers, while spillovers account for 32.86% of the error variance across APEC equity markets. Moreover, notable spikes in volatility spillovers have been observed as a result of various events, including the Chinese stock bubble, the Global Financial Crisis (2007–2008), European debt crises, the Chinese stock market crash, the cryptocurrency crash, the COVID-19 pandemic, and the Russia-Ukraine conflict. The study’s findings imply that policymakers should enhance economic integration and cooperation within APEC countries to manage volatility spillovers effectively. The research highlights market interactions for a large sample, aiding in identifying investment opportunities and risk management strategies.
PUBLIC INTEREST STATEMENT
The interconnectedness of global financial markets has greater relevance in a turbulent world with interconnected economies; therefore, understanding the spillover effect is crucial for investors, policy makers, and the public. Analysis of stock market spillover is vital for promoting economic growth, financial resilience and fostering cooperation among APEC countries. By disseminating knowledge about these dynamics, this research serves the public interest by contributing to a more stable and secure financial portfolio for individuals. This can help the investor make more informed decisions, manage risk and diversify their portfolio effectively in APEC economies. This study also reminds us of the importance of considering major events and crises when studying how markets are connected.
1. Introduction
The efficient market hypothesis (EMH) is a widely accepted theory in finance that suggests that financial markets are efficient and reflect all available information. However, recent research has shown that events in one market can have significant spillover effects on other markets, challenging the EMH assumption of complete market efficiency (Diaconaşu et al., Citation2022; Kakran et al., Citation2023). The concept of volatility spillover (VS) was initially derived from the integration between the markets. By examining the impact of major global events on risk transmission and VS, the authors aim to provide insights into the dynamics of financial markets that go beyond the traditional EMH framework.
Since the late 1980s, regional economic integrations have emerged all over the globe as a result of the accelerating regionalization of economic activity and the deregulation of financial markets (Oman, Citation1996; Yamazawa, Citation1992; Yeung, Citation2000). The free trade area of Asia-Pacific (FTAAP) (alluded to in 2004) opened the doors for a regional trade framework focusing Asia Pacific economic cooperation (APEC)Footnote1 (represents more than 38% of the world population, 47% of world trade, and over 60 % of global GDP) by targeting 21 significant economies (Australia, Vietnam, China, Canada, Chile, China, Chinese Taipei, Indonesia, Malaysia, Hong Kong, Mexico, Papua New Guinea, Peru, Russian Federation, Singapore, USA, Japan, South Korea, Philippines, New Zealand, Thailand) (adverted from two regional blocks North American free trade agreement (NAFTA) and European Union (EU). Such liberalization opens the possibilities for favorable economic development that may result in stock market integration (Errunza, Citation2001; Ho et al., Citation2023). Although over the decade, different factors affected the global stock market in the form of VS or contagion due to financial strain and financial crises like the recent Russia-Ukraine war (Babar et al., Citation2023; Bouri et al., Citation2023; Mnif et al., Citation2023), the health crisis brought on by the COVID-19 epidemic (Akhtaruzzaman et al., Citation2021; Al-Nassar et al., Citation2023; Batten et al., Citation2022; Hassan et al., Citation2022; Khan et al., Citation2023), European debt crisis (He et al., Citation2020; Jebabli et al., Citation2022; Samarakoon, Citation2017) , GFC (2007–2009) (Baur, Citation2012; Kenourgios & Dimitriou, Citation2014). The abovementioned literature confirmed that the stock markets are vulnerable to different types of crises, which are transferred as uncertainty shocks in the form of spillover due to interconnectedness (directly or indirectly) in the markets.
With the expansion of financial deregulation, the strengthening of economic and financial cooperation, and the growth of mutual investments, APEC stock markets are becoming more integrated on a regional level (Kuroda & Kawai, Citation2004). International investors are increasingly looking to the Asia-Pacific equities markets as a critical component of their portfolios due to the region’s high return and risk potential (Anwer et al., Citation2022; Wu et al., Citation2020). Subsequently, it was founded, APEC has worked tirelessly to promote regional integration and free capital movement, and the member’s collaboration on the economic front has grown enormously.
This increasing integration and connectedness create a conducive environment for studying volatility spillovers, as demonstrated by the linkages between news transmission, uncertainty, and volatility in stock prices across markets (Bekaert et al., Citation2005; Forbes & Rigobon, Citation2002; Luk et al., Citation2020; Zhang et al., Citation2020). From the perspective of the interconnectedness of stock markets, contagion has emerged as a black swan with an abnormal increase in market co-movements due to a crisis (Forbes & Rigobon, Citation2002; Yarovaya et al., Citation2022). Especially during times of crisis or shock, the economy is vulnerable to contagion effects that might impede progress (Bekaert et al., Citation2005). The linkage between news transmission and uncertainty is shown via VSs (Luk et al., Citation2020). It might also apply to changes in equity-return volatility across markets (Zhang et al., Citation2020). Several papers revealed robust VSs between markets (Baur & Jung, Citation2006; Hamao et al., Citation1990; Savva et al., Citation2009; Seth & Sidhu, Citation2021).
The study of stock market reactions to volatility in economies with less developed financial systems and the effects of foreign market volatility on domestic markets has been extensively explored (Habiba et al., Citation2021; Muharam et al., Citation2019).
Various econometric and non-econometric models have been utilized to investigate market contagion, risk spread, and correlations, including studies by Forbes and Rigobon (Citation2002) and Bessler and Yang (Citation2003) on financial market interconnectedness for returns volatilities. Diebold and Yilmaz (Citation2009, Citation2012) developed a methodology using variance decompositions in vector autoregressions (VAR) to measure return and volatility spillovers accurately. Their approach allows for the assessment of directional spillovers and provides insights into information-sharing mechanisms and the negative impacts of contagious periods, making it a benchmark in studying dynamic network spillovers.
Additionally, since portfolio output is dependent on the association of portfolio resources, examining the spillover among APEC financial markets for portfolio diversification is becoming increasingly important. Moreover, if a country has negative or low correlations within some countries, it presents foreign investors with diversification investing options (Caliari et al., Citation2023). The literature indicates the urgency of this study since there is a substantial research gap caused by the absence of systematic research on stock market connectivity and VSs, especially among APEC members. Diebold and Yilmaz’s (Citation2012) technique, based on the GFEVD framework, is applied to a sample of 19 APEC countries in order to determine the direction and magnitude of VSs. Diebold and Yilmaz (Citation2012) devised a unique and innovative approach to understanding volatility spillover in equity markets. Their methodology involves utilizing generalized forecast-error variance decompositions (GFEVD) to break down the sources of volatility spillover. Specifically, they analyze the contribution of a particular stock market’s shock versus the impact of a shock in a different stock market. This enables a comprehensive and detailed understanding of the drivers of volatility spillover and sheds light on the complex interconnections between different equity markets. By utilizing GFEVD, Diebold and Yilmaz’s approach represents a significant step forward in accurately measuring and quantifying volatility spillover. This shows how much the two markets depend on each other, mapped by two significant theories, i.e., financial integration theory and information transmission theory.
The importance of this study lies in understanding the dynamics of volatility spillovers among APEC stock markets and their interconnectedness in the global financial system. By addressing the research problem of identifying major transmitters of spillovers and analyzing the magnitude of volatility spillover, specially at the onset of various crises cycle, this study fills a research gap in the literature. While previous studies have explored the interconnectedness of global financial markets, there is a lack of comprehensive analysis, specially focusing on the APEC economic bloc. This study’s results imply that the degree of connectivity changed over time and that the changes occurred in cycles related to important events and shocks in the equity market. The highest degree of volatility transmission remains in other markets except for the US, Canada, and Mexico, as there are identified as spillover transmitters. The findings contribute to effective risk management strategies, investment decisions, and policy measures to enhance financial stability and resilience in the APEC region.
This study has three significant contributions to the literature. First, it focuses on identifying and analyzing variation in VS among APEC economies; second, it unveils the impact of specific events on market interconnectedness and provides a basis for further analysis and risk management strategies. Overall, this research expands the literature on volatility spillover in APEC countries, providing policy makers, investors, and researchers with valuable information for decision-making, risk assessment, and portfolio management. Further, the study is alienated into six sections as follows: Section 1 shows a brief literature review, methodology, and data enclosed in Section 2, and Section 3 presents an interpretation of the analysis. Section 4 indicates the conclusion, Section 4.1 represents regulatory implications, and Section 6.1 covers recommendations to investors.
2. Literature review
In the existing literature, only seven studies on the APEC group were identified in the context of VS in stock markets. Lin and Rajan (Citation1999) investigated the Thai baht crisis (1997), resulting in the international standing of ASEAN and APEC being severely damaged during the crisis period. Bende Nabende et al. (Citation2003) investigated the FDI, output, and various spillover variables (international trade, human capital, capital stock, employment, and new technology); also it revealed the positive (developed to less developed countries) and negative (less developed to developed countries) spillovers between the APEC countries. Valdes et al. (Citation2016) discussed Agri based business stock indices, and Li and Rose (Citation2008) indicated different extreme correlations and market integration. Lee et al. (Citation2012) showed that intra-regional goods trade impacted stock market integration in APEC. Idrees and Sarwar (Citation2022) investigate international implications on the availability of innovative resources leading to the formation of “global convergence clubs.” It resulted that when a country is geographically close to another with a high innovation performance, strong economic integration, and high trade, they share the spillover effect’s advantages. Sun et al. (Citation2023) revealed that the liberalization of China’s capital markets policies has considerably improved risk connections between China and foreign stock markets which ultimately boosted the Chinese stock market’s capacity to withstand external risk shocks.
For mapping an in-depth literature review, core-related studies were considered. Previous research has employed asset pricing and statistical integration models to investigate the effects of market integration and diversification. According to the mean-variance hypothesis, assets traded on different exchanges should fall into similar groups along the security market line. Nonetheless, if security prices across markets tend to move together over time, the statistical integration model would say that the markets are integrated. The extent to which foreign markets are integrated has significant ramifications for investors’ investment portfolios and capital-efficient markets, making this research field more popular in recent years. When market integration grows, the advantages of variety may disappear. Moreover, when price series are cointegrated, the weak form market efficiency may be undermined since it involves an error-correcting representation of the security prices (Granger, Citation1986). Financial market integration produces a world in which rewards and volatility are inextricably intertwined. No matter how far apart, financial markets across the globe have grown more linked because of the growth of digital communications and the liberalization of international commerce.
The word “spillover” refers to the influence of more significant connections across global financial markets on disseminating newly available information from one country to another. Due to its significance in asset pricing and risk assessment, this dependency has piqued the interest of scholars, as has the appraisal of international portfolio diversification. The spillover effect has two components: return spillover and VS First, information on stock returns and volatility travels internationally, demonstrating the global interconnectedness of financial markets. Historically, stock returns have been seen as a barometer for market level. Second, stock volatility is seen as a proxy for market risk. Therefore, most portfolio theories assess the return-to-risk trade-off by analyzing the average and variation of asset returns (Markowitz, Citation1952). Five techniques for examining the spillover effect based on statistical integration models have been developed in the empirical literature. The first method accounts for the spillover effect using conditional or unconditional correlation coefficients (Liu et al., Citation2020; Zhong & Liu, Citation2021). The second method utilized the co-integration framework to quantify the spillover influence (Athari et al., Citation2022; Kannadas & Viswanathan, Citation2022; Longin & Solnik, Citation1995). The third method examines the highest prices in various marketplaces (Harrison & Moore, Citation2009; Melvin, Citation2003; Milunovich & Thorp, Citation2006). The VAR and GARCH model is the fourth option, and it’s also one of the most popular since it can be used to study both return and VSs (Ahmed et al., Citation2022; Campbell & Hamao, Citation1992; Engle et al., Citation1990; Eun & Shim, Citation1989; Hamao et al., Citation1990). The fifth method employs the spillover index. Based on variance decomposition, this indicator appropriately assesses how much one market influences another (Bonilla & Sepúlveda, Citation2011; Diebold & Yilmaz, Citation2012; Kang et al., Citation2019; Panda et al., Citation2021).
Regional location may be one of the factors causing spillover effects. Throughout the past several decades, governments worldwide, particularly in Asia’s financial markets, have changed their policies to facilitate foreign investment. Thomas et al. (Citation2017) investigate the established, emerging, and frontier markets in the Asia-Pacific area through time, considering the impact of global and regional shocks. According to the results, the stock markets in China, Thailand, Sri Lanka, and Pakistan vary from those in the rest of the Asia-Pacific region. As a result, foreign investors might profit from the diversification opportunities offered by these markets. Also, the findings of the bidirectional co-integration test show that emerging and frontier markets influence established markets. As a result, it is reasonable to infer that the cliché “more is better” does not apply in today’s economy. Kirkulak Uludag and Khurshid (Citation2019) observed the influence of the Chinese market on the E7 and G7 markets from 1995 to 2015 through the stock market channel. The most substantial volatility spillover occurs between China and India for the E7, whereas between China and Japan for the G7, the optimum weights and hedging ratios results show that investors should allocate more shares to G7 countries than E7 countries. Therefore, liberalization policies typically result in more regional and global market returns convergence and more cross-national spillover effects are expected.
Zhong and Liu (Citation2021) demonstrated a positive dynamic conditional connection between China and five Southeast Asian stock markets, which peaked in 2015, just around the period of the Asian financial crisis, the GFC (2007–2009). Chen and Wang (Citation2021) studied the interdependence and risk spillover effects between the Chinese and ASEAN-6 stock markets from 2010 to 2021. Using the Copula-TV-GARCH-CoVaR and the MES model, the study found that, except for Vietnam, these stock markets were interconnected. The Chinese and Singaporean markets exhibited the highest reliance, while the Chinese and Vietnamese markets displayed the lowest. These findings are distinct from prior research, which produced inconsistent results.
Consequently, spillover effects may vary over time and between circumstances. During a crisis, the financial contagion effect increases the strength of linkages between markets. Such research, however, has concentrated on the time-varying character of market integration by high and low volatility periods (Kirikkaleli & Athari, Citation2020; Kondoz et al., Citation2021). Xiao (Citation2020) investigates the impact of Chinese stock market volatility on crucial East Asian markets during calm and turbulent periods (2014–2018). He discovered some noteworthy discoveries using direct CoVaR, such that negative and positive spillovers differ throughout stormy and peaceful periods (during that time, China’s only significant partnerships were with Japan and South Korea.).
Although global or regional financial crises are known to have spillover effects, there is some evidence that these effects multiply across certain periods (Daly et al., Citation2019; Krishnan & Dagar, Citation2022; Shaikh et al., Citation2021). Gulzar et al. (Citation2019) analyzed Asian financial systems during the GFC (2007–2009) using daily stock returns (2005 to 2015), indicating that US and emerging markets became more cointegrated post-crisis, with US financial market shocks having a momentary effect on developing markets. Only South Korea and India experienced cross-market news and volatility spillovers during the crisis, while post-crisis information boosted India and Russia but hit Malaysia and China. Samitas et al. (Citation2022) studied the impact of COVID-19 on 51 established and emerging stock markets using dependency dynamics and network analysis. The study found that the pandemic led to swift financial contagion, with an ongoing investigation into the possibility of excessive risk spreading among the markets. Su (Citation2020) studied high-risk spillovers between G7 and BRICS stock markets from 1998 to February 2017. While some G7 markets transmitted high-risk spillovers, not all did, and no BRICS markets were net receivers. The UK, Japan, and Italy benefited from high-risk spillovers, while Brazil was a major transmitter. Only pairwise direction spillovers occurred between G7 and BRICS markets. The study found time variability in severe risk spillovers, with the US, Germany, France, and Canada as net transmitters and the UK, Italy, and BRICS markets as net recipients. Some publications’ findings, on the other hand, disagree. Studies by Chan-Lau and Ivaschenko (Citation2003) and Bayoumi and Swiston (Citation2007) show that the “Wall Street Virus” and spillovers from the US have affected Asian economies. Fujiwara and Takahashi (Citation2012) identified the US as the primary driver of market movements despite China’s financial growth. Trung (Citation2019) found that US policy uncertainty shocks significantly drove fluctuations in the global economic cycle, using a GVAR framework and data from 32 countries. In conclusion, the impact of US policy uncertainty on other countries varies depending on their characteristics. Kang et al. (Citation2019) found that directional spillovers from world stock markets to ASEAN-5 stock markets were greater than the reverse. The degree of spillover varied over time across ASEAN-5 stock markets, with an increase in return and volatility spillovers during financial crises. The study analyzed data from 2003 to 2019 and corroborated the power of information transmission during instability. Jebran et al. (Citation2017) found evidence of bidirectional volatility spillovers between the Indian and Sri Lankan stock markets using daily data in both periods. However, volatility spillovers between other emerging Asian markets varied from normal to turbulent circumstances (Lohan et al., Citation2023; Sidhu et al., Citation2021). The study also highlighted the integration of the US and worldwide stock markets as a prominent issue in finance. Zhang et al. (Citation2020) examine the geographical connections of volatility spillovers in G20 stock markets from 2006 to 2018 using the GARCH-BEKK model. The study finds extensive volatility contagion and superposition occurrences in the network. Unstable markets amplify the intensity of spillover interactions and raise the volatility rate. According to Mensi et al. (Citation2021), stock markets in Japan, New Zealand, Brazil, and Russia are net recipients of spillover effects, while the US, Canada, France, Indonesia, Korea, India, and Taiwan are net transmitters. Most Asian countries were responsible for sending negative shocks to other markets in 2016, and negative shocks outnumbered positive ones. Emerging economies such as India, Thailand, China, Taiwan, Brazil, and Russia have experienced heightened negative volatility due to asymmetric spillover. Bala and Takimoto (Citation2017) researched volatility spillover (VS) between emerging and developed stock markets, using weekly data from 1994 to 2016 and multivariate-GARCH models. Their findings showed that during crises, correlations between emerging markets increased, and VS effects were larger within emerging markets than across them. Additionally, they found significant asymmetry in mature markets but only modest evidence in emerging markets. Trihadmini and Falianty (Citation2020) used the DCC-GARCH model to investigate the volatility spillover effect from four developed stock markets to five ASEAN countries during the crisis. They found that the spillover impact was greater in the crisis period, except for Malaysia, and that the influence of volatility on stock returns decreased. The study suggests market imperfections may be responsible for slower reactions to identical information. Internal spillovers are traced over time by the sluggish dissemination of foreign information (Strohsal & Weber, Citation2015). Second, it is sluggish to respond to new information since local investors do not get knowledge of international market movements until after the deal has already occurred (Strohsal & Weber, Citation2015). Strohsal and Weber’s (Citation2015) study of the link between international stock market contact and financial volatility focuses on financial VS. They demonstrate how volatility-dependent spillovers across markets may be read in two ways: as a sign of information flow or uncertainty. Volatility indicates the information (uncertainty) if higher (lower) volatility in one market causes higher (lower) reactivity in another. Nevertheless, within behavioral finance theory, the herding behavior hypothesis has arisen as a significant alternative explanation (Gong et al., Citation2021; Yasir & Önder, Citation2022; Zhang & Giouvris, Citation2022). From 2001 to 2013, Leung et al. (Citation2017) investigated VS between the DJI, FTSE 100, and N225 equities markets; they discovered evidence of market contagion caused by irrational investor activity.
From the above literature, two significant theories are related to this research for VS, i.e., financial integration theory and information transmission theory. Financial integration is a mechanism through which an economy’s financial institutions and stock markets become more tightly connected with those in other nations or the rest of the globe. Moreover, financial integration highlights three core features, i.e., 1) It does not have interdependence on regional financial structures, 2) integration through asymmetric or symmetric effect due to the presence of the fraction, 3) it differentiates two constituents of the equity market, i.e., supply and demand for investment opportunities (Stavarek et al., Citation2012). Information transmission theory indicates that transmitting information through different channels significantly impacts stocks. An event study by Fama et al. (Citation1969) focused on three hallmarks 1) an enormous array of information events, 2) multiple channels or mechanisms of information transmission, and 3) the content of news or information backed by non-numeric information. Investors’ beliefs are caused by the dissemination of information that often leads to the convergence or divergence of investors’ beliefs, which may or may not be based on rational grounds. Various theoretical frameworks emphasize the significance of divergent perspectives among investors in comprehending the dynamics of asset valuation and transactional activity. Similarly, Tetlock (Citation2010) posits that the impact of public information on trading activity is contingent upon its ability to mitigate information irregularity and facilitate the conjunction of traders’ views.
Therefore, there is a research gap in understanding the extent and dynamics of volatility spillover among the APEC economies, especially considering the region’s diverse economic conditions, financial market structures, and policy frameworks. Addressing this research gap would contribute to a better understanding of the interdependence and interconnectedness of stock markets within the APEC economies, which is crucial for investors, policymakers, and market participants in managing risk and making informed investment decisions.
The research questions of the study are as follows-
RQ1:
What is the extent and magnitude of volatility spillover among the APEC stock market?
RQ2:
What are the main drivers of the observed spillover effects among APEC stock markets?
RQ3:
What are the implications of APEC stock market spillovers for portfolio diversification strategies?
3. Data and methodology
3.1. Methodology
To Investigate the interconnectedness among APEC stock markets, this study applies the Diebold and Yilmaz (Citation2012) technique. Using the FEVD within a GVAR framework measure of volatility spillovers, this study examines the spillovers across and within markets. Unlike traditional methods, the GFEVD is order-invariant, allowing each variable to simultaneously examined the spillovers across and within markets impacted by shocks to itself and the primary variables. Diebold and Yilmaz’s (Citation2012) spillover index is a method that allows us to examine the transmission of information and shocks across different markets. It employs a vector autoregressive (VAR) model to decompose the variance of prediction errors. This approach enables us to analyze the impact of directional spillovers by assessing markets’ net exposure to other regions’ information exchange mechanisms (Kashyap, Citation2023). To measure directional spillovers, one can calculate the net effect of information flow between stock markets in Asia and other global regions and within Asia itself. This involves examining these markets’ directional returns and volatility to identify the extent of spillovers occurring between them. By studying these spillover effects, we can gain insights into the interconnections and dependencies among different markets and regions.
VDs may be performed using an N-variable VAR(q) process, as shown in EquationEquation 1(1)
(1) , which can be expressed in an endless moving average (MA) form, as shown in EquationEquation 2
(2)
(2)
In EquationEquation 2(2)
(2) ,
is a
coefficient matrix, where j51, … , q.
is
is an identity matrix, while
for
. Assessing the interconnectedness between variables using hundreds of MA coefficients can be a difficult and confusing task. As MA coefficients require specific transformations, insights into system dynamics can be gained through IRFs or VDs. In particular, VDs are important for identifying which parts of each variable’s forecast error variance (FEV) are attributable to different tremors in the system. By using VDs, it’s likely to measure the proportion of FEV of a particular market (i) caused by shocks to another market (j), allowing us to understand the interdependencies between variables more clearly,
for each
:
In this context, it symbolizes the covariance matrix of the error vector; the standard deviation of the error term for the jth equation is represented by
, and the selection vector
is 1 for the jth element and 0 for all others. The coefficient matrix in the infinite MA representation is
. GFEVD incorporates interrelated shocks instead of orthogonalizing them, allowing for a better understanding of the interdependence between variables. However, the sum of contributions of the jth market to the ith market may not equal one, as the row sum of the VD matrix’s elements. Thus, Diebold and Yilmaz (Citation2012) suggest normalizing each part of the VD matrix by the row sum, as shown in EquationEquation 4
(4)
(4) .
Each element of the VD matrix has a column sum of one, denoted as and
. Volatility spillovers can be measured as the proportion of error variances used in forecasting the volatility of stock market “i” caused by shocks to the stock market “j.” This is represented by the sum of cross-variance shares, known as the total spillovers index (TSI), and can be calculated using EquationEquation (5)
(5)
(5) .
In addition, it is worth noting that EquationEquation (6)(6)
(6) depicts the directional VSs that market i receives from all other markets j, while EquationEquation (7)
(7)
(7) illustrates the VSs that market i transmits to all other markets j. As a result, EquationEquation (8)
(8)
(8) shows the net directional VSs, which is the difference between EquationEquation (7)
(7)
(7) and EquationEquation (6)
(6)
(6) . This net spillover measurement is crucial as it provides valuable insights into whether a particular stock exchange is a net transmitter or recipient of shocks.
From others to market i:
To others from the market i:
Net Volatility Spillover:
The spillover estimate depends on three factors: (1) the variables being monitored, (2) the H-step-ahead prediction horizon for error VDs, and (3) a dynamic process (L) that captures time-varying spillovers. Increasing the prediction horizon widens the window for spillovers, allowing for not only contemporaneous but also long-run spillovers. This analysis uses a 10-day forecast horizon (H) and a rolling window width (W) of 200 days. A 10-day forecast horizon corresponds to the 10-day value at risk (VAR), while the rolling window approach is simple and suitable for time-varying parameter systems. A W of 200 days is commonly used for daily data analysis, and a W of 5767 days is used for robustness testing.
3.2. Data description
We have obtained daily closing price data (4 January 2001- 10 February 2023) of APEC benchmark stock indices (19 countries)Footnote2 from Bloomberg. Due to the late establishment of some stock markets in emerging economies and non -the availability of data, this current study obtained data from 4 January 2001. This sample size covers events during the time series that unveil the integration or connectedness. Logarithm returns (rt) for different indices are computed using the daily closing price of stock market indices. The summary data for the log return series are shown in Table . It comprehensively analyzes the daily stock index returns across various markets. Examining the average daily returns, we observe that all markets exhibit positive mean values, indicating an overall positive performance.
Table 1. Summary statistics of the APEC countries
Peru IGBVL 0.000504, followed by Russia (IMOEX) 0.000488, giving maximum returns and Hongkong market (HSI) 0.000068, followed by the Chinese market (SHCOMP) 0.000075 showing the lowest returns. But the overall view suggests that the daily returns have a relatively low magnitude. The return variability or volatility analysis reveals different risk levels among the markets. For instance, the Chinese stock market (SHCOMP) demonstrates the highest standard deviation (0.014581), indicating greater volatility, while the Malaysian market (FBMKLCI) displays the lowest standard deviation (0.00755), suggesting lower volatility. The skewness values shed light on the asymmetry of the return distributions. In this case, all markets exhibit negative skewness, implying a higher frequency of negative returns than positive returns. Kurtosis, which measures the peakedness of the return distributions, indicates that all markets have kurtosis values greater than 3. This suggests fat tails and a distribution with thicker tails than a normal distribution. Therefore, there is a higher likelihood of extreme events or outliers in the stock market returns. To assess the normality of the data, the Jarque-Bera test is employed. The extremely low P-values (0.00) for all markets indicate a rejection of the null hypothesis of normality.
Table indicates that for the majority of the countries’ stock market indices, such as Australia (AS51 Index), Canada (SPTSX Index), Chile (IPSA Index), and others, the ADF test, PP test, and KPSS test statistics are lower than the critical values. This implies that these indices are likely stationary, indicating a relatively stable pattern over time. Additionally, the Break Point unit root test examines whether there is a structural break in the unit root properties of the index. The test statistic is compared to the critical value, and a higher test statistic suggests the presence of a structural break. The results indicated that most analyzed stock market indices are likely stationary and do not exhibit a structural break in their unit root properties. Moreover, the empirical results conclude that all series are stationary at I (0).
Table 2. Stationarity table - -ADF, PP test, KPSS test, and break-Point test of APEC countries
4. Results and discussions
Table displays a comprehensive matrix of the VS for 19 APEC region stock markets, which includes the stock market indices of Australia (AS51), Canada (SPTSX), Chile (IPSA), Japan (NKY), Hong Kong (HSI), Indonesia (JCI), South Korea (KOSPI), Malaysia (FBMKLCI), Mexico (MEXBOL), Peru (IGBVL), Philippines (PCOMP), Russia(IMOEX), Singapore (STI), Taiwan (TWSE), Thailand (SET), US (SPX), Vietnam (VNINDEX), China (SHCOMP), and New Zealand (NZSE50). The Variance decomposition (VD) matrix has off-diagonal elements of 24 × 24 dimensions that indicate the contribution to the FEV of a specific equity market due to shockwaves from other markets, except itself. The spillover’s directionality is presented in the “from others” column and the “to others” row that show off-diagonal column sums and row sums, respectively. The net VSs can be calculated by subtracting the “from others” column from the “to others” row. The top row of the table shows the total spillover index (TSI), which indicates the extent to which cross-market spillovers occur in either direction. The “total” row aggregates the effects of a market shock on its variance and that of other markets. Directional spillovers “to others” from every 19 equity markets illustrate significant differences in the transmitted VSs. The contribution of an equity market shock projecting the volatility of other financial markets concerning the error variance exhibits more significant variability than the spillovers received by stock markets from others. The contribution of variance to different needs varies widely across countries, from 16.29% in Vietnam to 133% in the US. Likewise, spillovers received by stock markets from other markets also range significantly, from 33.74% in Vietnam to 70.27% in Hong-Kong. In terms of VS transmitter, the results indicated the US (69.54%) as the major transmitter, followed by Canada (52.92%), Mexico (37.09%), Chile (13.20%), Peru (10.42%), Hong-Kong (5.61%) and others to the error variance (Table ). Over the years (2001, 2021) (total trade with the US) (in billion US $), Canada ($ 446.24, $ 664.77), Mexico ($112.63, $ 779.08) were the major trading partner of the US (US Census Bureau, Citation2023). The results of this study aligned as Canada had maximum trading with the US over the years, in a similar sequence level of net spillover identified (Statsapec, Citation2023). It indicates cyclic trading between the countries, resulting in strong connectedness among them. Moreover, the US, Canada, and Mexico have strong connectedness due to a free trade agreement indicating strong trading ties through a regional bloc, i.e., North Atlantic Free Trade Agreement (NAFTA). Conversely, In Latin America, Chile is the third largest bilateral goods trading partner (Hong Kong $ 20.9 billion) in 2021. Yousaf and Ahmed (Citation2018) also indicated positive volatility spillover among the US and major Latin America (Mexico, Argentina, Chile, and Peru). Johnson and Soenen (Citation2003) also resulted that Canada and Mexico have same-day solid Intermarket reactions (at least 91%). Argentina, Brazil, Chile, and Peru have 50% same-day Intermarket response as they interact considerably on the same day, indicating excellent market integration and efficiency. Moreover, In 2022, the Canada-Chile commercial relationship celebrated the 25th anniversary of the Canada-Chile Free Trade Agreement (CCFTA) (the agreement covers trade in goods, services, and investments and includes side agreements on the environment and labour relations), the cornerstone of Canada’s strong trade and investment relationship with Chile (Government of Canda, Citation2023).
Table 3. Representation of static volatility spillover among APEC countries
Although Russia has lowest net spillover (0.01%) as it almost infuses and diffuse equivalent spillover among APEC countries, in 2001 (in USD million), Russia had highest exports (2001, 2021) with China ($3942.6, $66305.3), US ($2897.6, $16622.8) and imports (2001, 2021) with China ($1646.3, $ 72380.1), US ($3257.5, $11916.9) which raised over the period significantly (StatsAPEC, Citation2023). Russia has the highest portfolio investment (in USD millions, 2021) with the US ($23216.4), Canada ($1935.9), Mexico ($1381.7), and Singapore ($5633), which reflects the spillover transmitter behavior of all these countries almost negligible net spillover transmission by Russia to spillover receiver APEC countries. Singapore (in USD million) (2001, 2022) exports Malaysia (20,814.1, 48275.8), US (18,442.9, 44244.1), Hong-Kong (10,491.2, 52810.3) and imports with Malaysia (20,066.8, 59242.2), US (18,727.5, 50845.1), Hong-Kong (2,761.7, 1,648.9) which indicates minor net trading difference (StatsAPEC, Citation2023). Similarly, Singapore neutralizes the spillover effect as it has the second lowest transmitter (4.78%) in net directional spillover in APEC. These findings are partially supported by Al-Hajieh (Citation2023), who indicated that China had been observed to be primarily receiving net inflows, Hong Kong and Singapore exhibit a distinct trend of reintegration with other stock markets, while this study indicates Hong Kong and Singapore are lowest net spillover transmitter of APEC, which shows these countries also have close trade ties.
On the other hand, New Zealand (32.86%) has the highest net inflow of VSs, followed by Philippines (30.91%), Japan (21.05%), Australia (20.37%), Malaysia (19.70%), Vietnam (17.44), China (16.88%), Indonesia (12.84%), Thailand (10.40%), Taiwan (8.98%), South Korea (2.12%) (Table ). These findings are aligned with Panda et al. (Citation2021) and Al-Hajieh (Citation2023) results, which indicated negative spillover in Australia, China, Hong Kong, Malaysia, and Korea, that there is an extraordinary level of innovation diffusion between different stock markets, as pairwise directional spillover is between China-Australia, Japan-Australia, Malaysia-Australia, Thailand-Australia, Malaysia-Hong Kong, Philippine-Hong Kong, Taiwan-Japan, and Thailand-Japan. Moreover, Hung (Citation2019) results were partially consistent with results that stated volatility spillover from the China stock market to Vietnam, Thailand, Singapore and Malaysia, but in this study, Singapore is the third lowest transmitter. Mbarki et al. (Citation2022) indicated that Japan tends to contribute considerably to the sentiment network, while China looks to contribute the least; a similar quantitative pattern of net spillover recipient was identified in Japan (21.05%), and China (16.88%). Hence, sentiment networks have significant impacts on the stock market. Moreover, the results of this study are partially consistent with Kim et al. (Citation2015) as they supported the level of stock market integration varies among Asia-Pacific economic regions and inconsistent with the results as China-US continues to have an impact with the diminished influence of Japan on stock markets in the Asia-Pacific region. Over the period (2001–2023), this study encountered China (16.88%) as a diminished influence as a spillover receiver over Japan (21.05%), which indicates that in the APEC bloc, Japan is a more significant spillover receptor than China. It is because the China—ASEAN trade agreement (2010), i.e.CAFTA (aims to increase trade cooperation by maximizing the China-ASEAN free trade zone effect), was completely operational, significantly changing the quantity of trading with Japan. Although sometimes a different behavior (receiver or transmitter) of spillover is understandable even in free trade agreements as due to, the presence of domestic demand serves as a protective measure against external disturbances, safeguarding their economies from fluctuations in the global market and mitigating the transmission of adverse effects. They, moreover, established vital policy steps to control their economies and avoid external risks. This comprises strategies like cautious fiscal policy, effective monetary policy, and exchange rate management, which buffer the effects of external shocks and prevent volatility spillover. New Zealand (in USD Millions) (2001, 2022) significant imports from Australia (2907.8, 5848.8), US (2144.9, 4886.3), Japan (1467.4, 3283.7), China (927.2, 12579.2) and significant exports to Australia (2501.8, 5052.6), US (2038.7, 2568.0), Japan (1716.1, 2568.0), China (567.1, 12417.3) (StatsAPEC, Citation2023) indicates strong integration in these economies. Hence, Japan, Australia, and New Zealand are primary net directional spillover receptors from US and Canada (as depicted in Figure ).
Although South Korea (2.12%, only received from US and Canada), Taiwan (8.98%, received from Mexico, Canada, US, and Thailand), Thailand (10.40%, received from Canada and US) are the lowest receptor of net directional spillover. These results are consistent with Hwang et al. (Citation2013), who identified similar significant breaks during the crises between these countries (Korea, Thailand, and Taiwan), which created a single bloc of these countries and in phases of adjustment, results are similar with different magnitude. Moreover, all these countries have major trading with China, the US, Japan, and Hong Kong, which indirectly created an internal trade bloc where the US and Hong Kong are the major net directional spillover transmitter to these countries. This trading share represents the cyclic integration in the economy of different similar countries. This shows these countries have a similar nature which is due to different collaboration, agreements and partnerships under the Comprehensive and Progressive Agreement for Trans-Pacific Partnership (CPTPP) elven Pacific Rim countries between 11 (Canada, Mexico, Peru, Chile, New Zealand, Australia, Brunei, Singapore, Malaysia, Vietnam, and Japan) connected under a free-trade agreement (FTA).
Moreover, The US possesses the world’s biggest and most prominent stock market, with significant trading volumes and diverse international investors (Eun & Shim, Citation1989). The US market’s size and high trading volumes make it a significant player (with the level of activity and liquidity) in the global financial landscape (as influenced by the interest and participation of a wide range of investors in US equities). Therefore, fluctuations in the US stock market can impact investor sentiment and risk appetite globally (including APEC). Due to different uncertainties in the US stock market, investors may adjust their investments and portfolios, affecting the APEC stock markets. The total spillover index, which encompasses overflow components in every direction, suggests that spillovers account for 59.81% of the error variance in predicting volatility across all 19 APEC equity markets.
Figure exhibits the gross VSs with multiple small cycles and a few large ones for APEC stock markets during the given sample period. The figure reveals that the degree of total connectedness between the markets is both intense and time-varying, ranging from 62.8% to 97.2%. It depicts different spikes like the Chinese stock bubble in 2006 (85.5%) and the GFC (2007–2009) in 2008 (85.3%). Before the GFC (2007–2009), there existed a minor cycle in the VSs that featured periodic spikes, but after that, due to an increased inflow of capital, several economies gradually liberalized their markets these spikes surged more. European Debt Crisis in 2011 (86.7%), the Chinese stock market crash in 2015–16 (84.8%), and the cryptocurrencies crash in 2018 (82.8%) were other reasons for VSs. The COVID-19 pandemic triggered the most significant wave of spillovers (97.2%), which began in early 2020 when countries worldwide implemented lockdown measures to curb the virus’s spread. The resulting economic slowdown led to a sharp decline in activity, widespread unemployment, diminished investor confidence, loss of millions of lives, and a surge of uncertainty akin to the pandemic’s scale. The last wave of spillover was due to Russia Ukraine conflict in February 2022 (80.6%). Over the period, spillover in APEC countries has shown net transmitting and net receiving behavior from the different shocks in the stock market, which suggests that the informational value transmitted in the form of rumors of interest rates to curb inflation (Chinese stock bubble, 2007), the bankruptcy of one biggest real estate company belongs to the most dominant stock market (i.e. the US) (GFC, 2007–08), popping of stock market bubble (Chinese stock market crash, 2015–2016), related to the suspension of activities, pandemic (COVID-19), war (Russia-Ukraine conflict, 2022–23) and any negative news or individual economic announcements or amid financial uncertainty act as disseminating economy of a country.
Figure 1. APEC nation’s time -varying gross volatility spillover.
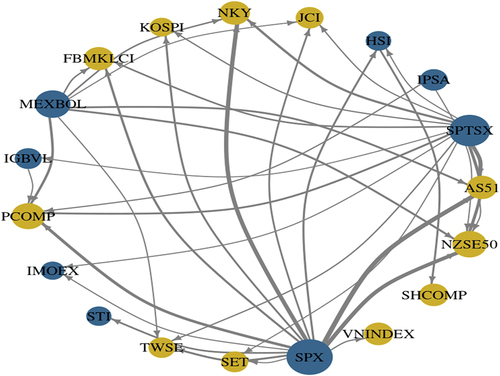
displays the “To spillover,” “From spillover,” and “Net directional spillovers” plots for APEC stock markets, which indicates that the US’s SPX, Canada’s SPTSX, Mexico’s MEXBOL, Peru’s IGBVL, Hong-Kong’s HIS, Singapore’s STI, and Chile’s IPSA are the primary net sources of volatility transmission throughout the sample period. On the other hand, all the other APEC countries are net recipients of VSs. Figure depicts the network plot of the spillover and connectedness of the APEC nations. Results of the study stated that the US is the largest transmitter of VSs in APEC nations, accounting for 69.54%, followed by Canada (52.92%) and Mexico (37.09%).
Figure 2. APEC countries transmitters (to others), receiver (from others), and net directional volatility spillover.
Figure 2. (Continued).
Figure 3. Net directional connectedness of the APEC countries.
4.1. Robustness results
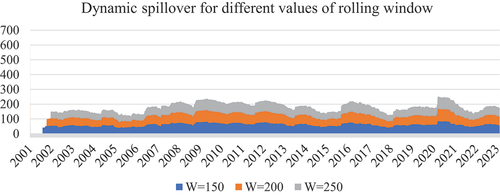
On the final results of spillover, the robustness checks are performed based on different forecast horizons (H) and rolling widths (W). As preliminary results from previous analysis, via a rolling width of 200, a prediction10 days horizon, and a lag duration of 1 day (Figure ). Again, the robustness findings for the dynamic spillovers index for various rolling window and forecast horizon values for APEC countries indicated that once the rolling window is enlarged from 200 to 250 days, the spillover plot for APEC nations becomes smoother. However, the pattern stays consistent, implying that our preliminary results resist the alternative rolling window option.
Figure 4. Dynamic spillover on different values of W indicates the robustness of APECcountries.
5. Conclusion
This study analyzed the magnitude and directional VS using GFEVD for 19 APEC countries from 4 January 2001 to 10 February 2023. The findings indicated that the US is the primary transmitter of volatility spillovers (VSs) in return series among APEC countries, accounting for 69.54%, followed by Canada (52.92%) and Mexico (37.09%). The significant findings align with the role of economic integration as a major factor contributing to volatility spillovers (VSs) among APEC countries. Specifically, the North American Free Trade Agreement (NAFTA) has established a highly interconnected trading system and economic bloc, fostering substantial trade and investment flows between Mexico, Canada, and the US. Consequently, any changes in these countries’ economic conditions or policy decisions can exert significant spillover effects on other APEC economies. This finding aligns with the information transmission theory, which posits that information from one country or market can be transmitted to and impact others. This could involve diversifying their trading partners, developing more robust domestic financial markets, and implementing policies to reduce their vulnerability to external shocks. Secondly, further research could explore the role of other factors, such as differences in economic and political conditions, trade relationships, and financial integration levels, in contributing to VSs between APEC countries. The study also mentions the potential influence of investor sentiment in generating VSs among APEC countries. Countries like New Zealand and the Philippines, with high inflows of VSs (approximately 30% from others), may be affected due to their small and open economies, dependence on commodity exports, and relatively sensitive financial markets. Moreover, Japan’s significant foreign investment makes it highly interconnected with major APEC countries. These findings align with the financial integration theory, which suggests that closer economic ties and interdependence between countries can lead to increased transmission of shocks and spillover effects. The study’s significant findings have profound implications for various stakeholders, including investors, financial advisers, and regulators. By understanding the dynamics of spillover transmission, market participants can gain improved insights into risk estimation and make optimal decisions regarding asset allocation and portfolio diversification.
In short, this study demonstrates the presence of substantial gross volatility spillovers among APEC stock markets, characterized by both small and large cycles. Significant spikes in volatility spillovers have been observed during significant events, including the GFC (2007–2008), the COVID-19 pandemic, and the Russia-Ukraine conflict. These findings highlight the significance of considering significant events and crises in understanding market interconnectedness. Furthermore, they emphasize the importance of implementing effective risk management strategies and measures to mitigate the impacts of such events in the future.
The study has limitations as it focuses on APEC stock markets, and the findings may not be generalizable to other regional blocs. Additionally, the study relies on the Diebold and Yilmaz index model, which has assumptions and limitations. Furthermore, the study does not consider other factors influencing volatility spillovers, such as political events or regulatory changes. Future research can focus on expanding the analysis to other regional blocs and different time frames, exploring additional factors influencing contagion effects, investor behavior and sentiment. These research avenues will enhance investors’ understanding of spillover dynamics and inform the development of effective risk management strategies and policies.
5.1. Regulatory Implications
The regulatory implications derived from this study are paramount in managing volatility spillovers among APEC countries. Regulators must enhance risk monitoring and assessment capabilities, particularly for countries with significant transmission influence. Strengthening regional cooperation and information sharing among regulators is crucial for timely response and coordinated actions by developing robust surveillance systems to identify early warning signals of potential systemic risks and contagion. Reviewing and enhancing regulatory frameworks for cross-border transactions will help address the challenges posed by spillover effects. This could involve implementing measures to manage the risks associated with capital flows, foreign investments, and the interconnectedness of financial institutions. Promoting strategies encouraging diversification, implementing macroprudential policies, and enhancing investor protection and education are essential measures to mitigate systemic risks and bolster market resilience. By implementing these regulatory initiatives, authorities can foster stability, safeguard investor interests, and ensure the robust operation of financial markets amidst the challenges posed by volatility spillover.
5.2. Recommendations to investors
The fund manager should consider diversifying the portfolio across different regions to minimize regional risks and dependencies. The analysis provides insights into the spillover effects between markets in other countries or regions. The portfolio can benefit from reduced concentration risk by diversifying across geographically diverse markets. A fund manager seeking greater market independence and lower interdependencies may consider investing in markets with higher diagonal values (own shock impact) and lower off-diagonal values (transmitter and recipient of shocks). Examples of such markets include South Korea, Taiwan, Thailand, and Indonesia. These markets have a lower degree of dependence on other markets, suggesting potential opportunities for diversification. Additional factors such as market conditions, investment objectives, risk tolerance, and specific investment strategies should also be considered when making portfolio decisions.
Author contribution
Shubham Kakran: Writing—Original draft, Data curation, Conceptualization, Methodology. Dr. Arpit Sidhu: Supervision, Software, Validation, Interpretation, Reviewing and Editing.Dr. Parminder Bajaj: Visualization, Investigation, Reviewing and Editing. Dr. Vishal Dagar: Review and editing, Supervision.
Disclosure statement
No potential conflict of interest was reported by the author(s).
Additional information
Notes on contributors

Shubham Kakran
Shubham Kakran is a research scholar at Mittal School of Business (MHRD NIRF India Rank 34 (Management); ACBSP USA, Accredited), Lovely Professional University, Punjab, India. He has obtained B.com, M. com (Finance), M. com (Marketing) from Chaudhary Charan Singh University (NAAC A++), Meerut, UP, India. He has a qualified CA-CPT from the Institute of Chartered Accountants of India (ICAI). He has published four research papers in reputed journals having indexing in Scopus, WOS, and ABDC. He has presented four articles at national and international conferences. He has published four book chapters for admirable books. His research interests are the financial stock market, commodity market, energy, behavioural finance, and sentimental analysis.
Notes
1. The Asia-Pacific market has a promising prognosis for the next decade, with a constant increase in financial development that is 2 to 3 times that of the EU or US, with an annual average growth rate of 0.2 percent by 2031 (IMF, Citation2023). The combined GDP of all APEC economies accounted for approximately 60% of the global GDP (apec.org). Because of the importance of intraregional trade flows and investments, processes, laws, rules, and regulations are being simplified. Interregional investments in activities with mutual benefits are encouraged via economic or technical exchanges to build regional or global relations. According to World Bank estimates, Japan’s investments in China have reached 38.6 percent of overall investments, or $397.07 billion, from January to April 2021.
2. As APEC group is group of 21 countries but for this study only 19 countries data (except Papua New Guinea, and Brunei Darussalam) are considered based on data availability on the Bloomberg database.
References
- Ahmed, S., Hasan, M. M., & Kamal, M. R. (2022). Russia–Ukraine crisis: The effects on the European stock market. European Financial Management. https://doi.org/10.1111/eufm.12386
- Akhtaruzzaman, M., Boubaker, S., & Sensoy, A. (2021). Financial contagion during COVID–19 crisis. Finance Research Letters, 38, 101604. https://doi.org/10.1016/j.frl.2020.101604
- Al-Hajieh, H. (2023). Predictive directional measurement volatility spillovers between the US and selected Asian Pacific countries. Cogent Economics & Finance, 11(1), 2173124. https://doi.org/10.1080/23322039.2023.2173124
- Al-Nassar, N. S., Yousaf, I., & Makram, B. (2023). Spillovers between positively and negatively affected service sectors from the COVID-19 health crisis: Implications for portfolio management. Pacific-Basin Finance Journal, 79, 102009. https://doi.org/10.1016/j.pacfin.2023.102009
- Anwer, Z., Naeem, M. A., Hassan, M. K., & Karim, S. (2022). Asymmetric connectedness across Asia-Pacific currencies: Evidence from time-frequency domain analysis. Finance Research Letters, 47, 102782. https://doi.org/10.1016/j.frl.2022.102782
- Athari, S. A., Kirikkaleli, D., & Adebayo, T. S. (2022). World pandemic uncertainty and German stock market: Evidence from Markov regime-switching and Fourier based approaches. Quality and Quantity, 1–23. https://doi.org/10.1007/s11135-022-01435-4
- Babar, M., Ahmad, H., & Yousaf, I. (2023). Returns and volatility spillover between agricultural commodities and emerging stock markets: New evidence from COVID-19 and Russian-Ukrainian war. International Journal of Emerging Markets. https://doi.org/10.1108/IJOEM-02-2022-0226
- Bala, D. A., & Takimoto, T. (2017). Stock markets volatility spillovers during financial crises: A DCC-MGARCH with skewed-t density approach. Borsa Istanbul Review, 17(1), 25–48. https://doi.org/10.1016/j.bir.2017.02.002
- Batten, J. A., Choudhury, T., Kinateder, H., & Wagner, N. F. (2022). Volatility impacts on the European banking sector: GFC and COVID-19. Annals of Operations Research, 1–26. https://doi.org/10.1007/s10479-022-04523-8
- Baur, D. G. (2012). Financial contagion and the real economy. Journal of Banking and Finance, 36(10), 2680–2692. https://doi.org/10.1016/j.jbankfin.2011.05.019
- Baur, D., & Jung, R. C. (2006). Return and volatility linkages between the US and the German stock market. Journal of International Money and Finance, 25(4), 598–613. https://doi.org/10.1016/j.jimonfin.2005.11.010
- Bayoumi, T., & Swiston, A. (2007). Foreign entanglements: Measuring the size and source of spillovers across industrial countries. IMF Working Paper 07/182. https://ssrn.com/abstract=994462
- Bekaert, G., Harvey, C. R., & Lundblad, C. (2005). Does financial liberalization spur growth? Journal of Financial Economics, 77(1), 3–55. https://doi.org/10.1016/j.jfineco.2004.05.007
- Bende Nabende, A., Ford, J. L., Santoso, B., & Sen, S. J. A. E. L. (2003). The interaction between FDI, output and the spillover variables: Co-integration and VAR analyses for APEC, 1965-1999. Applied Economics Letters, 10(3), 165–172. https://doi.org/10.1080/1350485022000044057
- Bessler, D. A., & Yang, J. (2003). The structure of interdependence in international stock markets. Journal of International Money and Finance, 22(2), 261–287. https://doi.org/10.1016/S0261-5606(02)00076-1
- Bonilla, C. A., & Sepúlveda, J. (2011). Stock returns in emerging markets and the use of GARCH models. Applied Economics Letters, 18(14), 1321–1325. https://doi.org/10.1080/13504851.2010.537615
- Bouri, E., Nekhili, R., Kinateder, H., & Choudhury, T. (2023). Expected inflation and US stock sector indices: A dynamic time-scale tale from inflationary and deflationary crisis periods. Finance Research Letters, 103845. https://doi.org/10.1016/j.frl.2023.103845
- Caliari, T., Ribeiro, L. C., Pietrobelli, C., & Vezzani, A. (2023). Global value chains and sectoral innovation systems: An analysis of the aerospace industry. Structural Change and Economic Dynamics, 65, 36–48. https://doi.org/10.1016/j.strueco.2023.02.004
- Campbell, J. Y., & Hamao, Y. (1992). Predictable stock returns in the United States and Japan: A study of long‐term capital market integration. The Journal of Finance, 47(1), 43–69. https://doi.org/10.1111/j.1540-6261.1992.tb03978.x
- Chan-Lau, J. A., & Ivaschenko, I. (2003). Asian flu or wall street virus? Tech and non-tech spillovers in the United States and Asia. Journal of Multinational Financial Management, 13(4–5), 303–322. https://doi.org/10.1016/S1042-444X(03)00013-6
- Chen, J., & Wang, X. (2021). Asymmetric risk spillovers between China and ASEAN Stock Markets. Institute of Electrical and Electronics Engineers Access, 9, 141479–141503. https://ieeexplore.ieee.org/stamp/stamp.jsp?arnumber=9570278
- Daly, K., Batten, J. A., Mishra, A. V., & Choudhury, T. (2019). Contagion risk in global banking sector. Journal of International Financial Markets, Institutions and Money, 63, 101136. https://doi.org/10.1016/j.intfin.2019.101136
- Diaconaşu, D. E., Mehdian, S., & Stoica, O. (2022). An analysis of investors” investors’ behavior in Bitcoin market. PloS One, 17(3), e0264522. https://doi.org/10.1371/journal.pone.0264522
- Diebold, F. X., & Yilmaz, K. (2009). Measuring financial asset return and volatility spillovers, with application to global equity markets. The Economic Journal, 119(534), 158–171. https://doi.org/10.1111/j.1468-0297.2008.02208.x
- Diebold, F. X., & Yilmaz, K. (2012). Better to give than to receive: Predictive directional measurement of volatility spillovers. International Journal of Forecasting, 28(1), 57–66. https://doi.org/10.1016/j.ijforecast.2011.02.006
- Engle, R. F., Ng, V. K., & Rothschild, M. (1990). Asset pricing with a factor-ARCH covariance structure: Empirical estimates for treasury bills. Journal of Econometrics, 45(1–2), 213–237. https://doi.org/10.1016/0304-4076(90)90099F
- Errunza, V. (2001). Foreign portfolio equity investments, financial liberalization, and economic development. Review of International Economics, 9(4), 703–726. https://doi.org/10.1111/1467-9396.00308
- Eun, C. S., & Shim, S. (1989). International transmission of stock market movements. The Journal of Financial and Quantitative Analysis, 24(2), 241–256. https://doi.org/10.2307/2330774
- Fama, E. F., Fisher, L., Jensen, M. C., & Roll, R. (1969). The adjustment of stock prices to new information. International economic review, 10(1), 1–21. https://www.jstor.org/stable/2525569
- Forbes, K. J., & Rigobon, R. (2002). No contagion, only interdependence: Measuring stock market co-movements. The Journal of Finance, 57(5), 2223–2261. https://doi.org/10.1111/0022-1082.00494
- Fujiwara, I., & Takahashi, K. (2012). Asian financial linkage: Macro‐finance dissonance. Pacific Economic Review, 17(1), 136–159. https://doi.org/10.1111/j.1468-0106.2011.00575.x
- Gong, X., Liu, Y., & Wang, X. (2021). Dynamic volatility spillovers across oil and natural gas futures markets based on a time-varying spillover method. International Review of Financial Analysis, 76, 101790. https://doi.org/10.1016/j.irfa.2021.101790
- Government of Canda. (2023). Retrieved July 8, 2023, from. https://www.international.gc.ca/country-pays/chile-chili/relations.aspx?lang=eng
- Granger, C. J. (1986). Developments in the study of cointegrated economic variables. Oxford Bulletin of Economics and Statistics, 48(3), 213–228. https://doi.org/10.1111/j.1468-0084.1986.mp48003002.x
- Gulzar, S., Mujtaba Kayani, G., Xiaofen, H., Ayub, U., & Rafique, A. (2019). Financial co-integration and spillover effect of global financial crisis: A study of emerging Asian financial markets. Economic research-Ekonomska istraživanja, 32(1), 187–218. https://doi.org/10.1080/1331677X.2018.1550001
- Habiba, U., Xinbang, C., & Ahmad, R. I. (2021). The influence of stock market and financial institution development on carbon emissions with the importance of renewable energy consumption and foreign direct investment in G20 countries. Environmental Science and Pollution Research, 28(47), 67677–67688. https://doi.org/10.1007/s11356-021-15321-3
- Hamao, Y., Masulis, R. W., & Ng, V. (1990). Correlations in price changes and volatility across international stock markets. The Review of Financial Studies, 3(2), 281–307. https://doi.org/10.1093/rfs/3.2.281
- Harrison, B., & Moore, W. (2009). Spillover effects from London and Frankfurt to Central and Eastern European stock markets. Applied Financial Economics, 19(18), 1509–1521. https://doi.org/10.1080/09603100902902220
- Hassan, M. K., Kamran, M., Djajadikerta, H. G., & Choudhury, T. (2022). Search for safe havens and resilience to global financial volatility: Response of GCC equity indexes to GFC and covid-19. Pacific-Basin Finance Journal, 73, 101768. https://doi.org/10.1016/j.pacfin.2022.101768
- He, P., Sun, Y., Zhang, Y., & Li, T. (2020). COVID–19‘s impact on stock prices across different sectors—an event study based on the Chinese stock market. Emerging Markets Finance and Trade, 56(10), 2198–2212. https://doi.org/10.1080/1540496X.2020.1785865
- Ho, T. T., Tran, X. H., & Nguyen, Q. K. (2023). Tax revenue-economic growth relationship and the role of trade openness in developing countries. Cogent Business & Management, 10(2), 2213959. https://doi.org/10.1080/23311975.2023.2213959
- Hung, N. T. (2019). Equity market integration of China and Southeast Asian countries: Further evidence from MGARCH-ADCC and wavelet coherence analysis. Quantitative Finance and Economics, 3(2), 201–220. https://doi.org/10.3934/QFE.2019.2.201
- Hwang, E., Min, H. G., Kim, B. H., & Kim, H. (2013). Determinants of stock market co-movements among US and emerging economies during the US financial crisis. Economic Modelling, 35, 338–348. https://doi.org/10.1016/j.econmod.2013.07.021
- Idrees, A. S., & Sarwar, S. (2022). Spatial convergence clubs and innovation persistence: A country-group comparison of international spatial spillover of innovation capabilities. Quality & Quantity, 1–32. https://doi.org/10.1007/s11135-022-01545-z
- IMF. (2023). Regional economic outlook: Asia Pacific. Retrieved July 8, 2023, from https://data.imf.org/?sk=abff6c02-73a8-475c-89cc-ad515033e662
- Jebabli, I., Kouaissah, N., & Arouri, M. (2022). Volatility spillovers between stock and energy markets during crises: A comparative assessment between the 2008 global financial crisis and the COVID-19 pandemic crisis. Finance Research Letters, 46, 102363. https://doi.org/10.1016/j.frl.2021.102363
- Jebran, K., Chen, S., Ullah, I., & Mirza, S. S. (2017). Does volatility spillover among stock markets varies from normal to turbulent periods? Evidence from emerging markets of Asia. The Journal of Finance and Data Science, 3(1–4), 20–30. https://doi.org/10.1016/j.jfds.2017.06.001
- Johnson, R., & Soenen, L. (2003). Economic integration and stock market co-movement in the Americas. Journal of Multinational Financial Management, 13(1), 85–100. https://doi.org/10.1016/S1042-444X(02)00035-X
- Kakran, S., Sidhu, A., & Lohan, S. (2023). Financial Contagion and Volatility Spillover In Financial Stock Market: The Statistical Review of Literature. International Journal of Financial Services Management. https://doi.org/10.1504/IJFSM.2023.10053838
- Kang, S. H., Uddin, G. S., Troster, V., & Yoon, S. M. (2019). Directional spillover effects between ASEAN and world stock markets. Journal of Multinational Financial Management, 52, 100592. https://doi.org/10.1016/j.mulfin.2019.100592
- Kannadas, S., & Viswanathan, T. (2022). Volatility spillover effects among gold, oil and stock markets: Empirical evidence from the G7 Countries. Economic Studies, 31(4). https://www.ceeol.com/search/article-detail?id=1040745
- Kashyap, S. (2023). Review on volatility and return analysis including emerging developments: Evidence from stock market empirics. Journal of Modelling in Management, 18(3), 756–816. https://doi.org/10.1108/JM2-10-2021-0249
- Kenourgios, D., & Dimitriou, D. (2014). Contagion effects of the global financial crisis in US and European real economy sectors. Panoeconomicus, 61(3), 275–288. https://doi.org/10.2298/pan1403275k
- Khan, M., Kayani, U. N., Khan, M., Mughal, K. S., & Haseeb, M. (2023). COVID-19 pandemic & financial market volatility; evidence from GARCH models. Journal of Risk and Financial Management, 16(1), 50. https://doi.org/10.3390/jrfm16010050
- Kim, S. W., Kim, Y. M., & Choi, M. J. (2015). Asia-Pacific stock market integration: New evidence by incorporating regime changes. Emerging Markets Finance and Trade, 51(sup4), S68–S88. https://doi.org/10.1080/1540496X.2015.1026726
- Kirikkaleli, D., & Athari, S. A. (2020). Time-frequency co-movements between bank credit supply and economic growth in an emerging market: Does the bank ownership structure matter? The North American Journal of Economics & Finance, 54, 101239. https://doi.org/10.1016/j.najef.2020.101239
- Kirkulak Uludag, B., & Khurshid, M. (2019). Volatility spillover from the Chinese stock market to E7 and G7 stock markets. Journal of Economic Studies, 46(1), 90–105. https://doi.org/10.1108/JES-01-2017-0014
- Kondoz, M., Kirikkaleli, D., & Athari, S. A. (2021). Time-frequency dependencies of financial and economic risks in South American countries. The Quarterly Review of Economics & Finance, 79, 170–181. https://doi.org/10.1016/j.qref.2020.05.014
- Krishnan, D., & Dagar, V. (2022). Exchange rate and stock markets during trade conflicts in the USA, China, and India. Global Journal of Emerging Market Economies, 14(2), 185–203. https://doi.org/10.1177/09749101221082724
- Kuroda, H., & Kawai, M. (2004). Strengthening regional financial cooperation in East Asia. Financial Governance in East Asia: Policy Dialogue, Surveillance and Cooperation, 52, 134. https://books.google.co.in/books?hl=en&lr=&id=T4qmEaGcVA0C&oi=fnd&pg=PA134&dq=Kuroda+and+Kawai,+2004+apec&ots=hMXVVgKMOs&sig=6C5X4q5M8rCn1w2jS0dbzhyW-80&redir_esc=y#v=onepage&q&f=false
- Lee, H. H., Huh, H. S., & Kim, W. J. (2012). Cross-border portfolio investment in the APEC region. Japan and the World Economy, 24(1), 44–56. https://doi.org/10.1016/j.japwor.2011.11.002
- Leung, H., Schiereck, D., & Schroeder, F. (2017). Volatility spillovers and determinants of contagion: Exchange rate and equity markets during crises. Economic Modelling, 61, 169–180. https://doi.org/10.1016/j.econmod.2016.12.011
- Lin, C. L., & Rajan, R. S. (1999). Regional responses to the Southeast Asian financial crisis: A case of self-help or no help? Australian Journal of International Affairs, 53(3), 261–281. https://doi.org/10.1080/00049919993854
- Li, X. M., & Rose, L. C. (2008). Market integration and extreme co-movements in APEC emerging equity markets. Applied Financial Economics, 18(2), 99–113. https://doi.org/10.1080/09603100601057870
- Liu, Z., Tseng, H. K., Wu, J. S., & Ding, Z. (2020). Implied volatility relationships between crude oil and the US stock markets: Dynamic correlation and spillover effects. Resources Policy, 66, 101637. https://doi.org/10.1016/j.resourpol.2020.101637
- Lohan, S., Sidhu, A., & Kakran, S. (2023). The impact of investor’s attention on global stock market: Statistical Review of literature. International Journal of Business Forecasting and Marketing Intelligence, 9, 1111. https://doi.org/10.1504/IJBFMI.2023.10057326
- Longin, F., & Solnik, B. (1995). Is the correlation in international equity returns constant: 1960–1990? Journal of International Money and Finance, 14(1), 3–26. https://doi.org/10.1016/0261-5606(94)00001-H
- Luk, P., Cheng, M., Ng, P., & Wong, K. (2020). Economic policy uncertainty spillovers in small open economies: The case of Hong Kong. Pacific Economic Review, 25(1), 21–46. https://doi.org/10.1111/1468-0106.12283
- Markowitz, H. (1952). The utility of wealth. Journal of Political Economy, 60(2), 151–158. https://doi.org/10.1086/257177
- Mbarki, I., Omri, A., & Naeem, M. A. (2022). From sentiment to systemic risk: Information transmission in Asia-Pacific stock markets. Research in International Business and Finance, 63, 101796. https://doi.org/10.1016/j.ribaf.2022.101796
- Melvin, M. (2003). A stock market boom during a financial crisis? ADRs and capital outflows in Argentina. Economics Letters, 81(1), 129–136. https://doi.org/10.1016/S0165-1765(03)00156-3
- Mensi, W., Maitra, D., Vo, X. V., & Kang, S. H. (2021). Asymmetric volatility connectedness among main international stock markets: A high frequency analysis. Borsa Istanbul Review, 21(3), 291–306. https://doi.org/10.1016/j.bir.2020.12.003
- Milunovich, G., & Thorp, S. (2006). Valuing volatility spillovers. Global Finance Journal, 17(1), 1–22. https://doi.org/10.1016/j.gfj.2006.06.007
- Mnif, E., Mouakhar, K., & Jarboui, A. (2023). Energy-conserving cryptocurrency response during the COVID-19 pandemic and amid the Russia–Ukraine conflict. The Journal of Risk Finance, 24(2), 169–185. https://doi.org/10.1108/JRF-06-2022-0161
- Muharam, H., Anwar, R. J., & Robiyanto, R. (2019). Islamic stock market and sukuk market development, economic growth, and trade openness (the case of Indonesia and Malaysia). Business: Theory and Practice, 20, 196–207. https://doi.org/10.3846/btp.2019.19
- Oman, C. P. (1996). The policy challenges of globalization and regionalization. https://doi.org/10.1787/20771681
- Panda, A. K., Panda, P., Nanda, S., & Parad, A. (2021). Information bias and its spillover effect on return volatility: A study on stock markets in the Asia-Pacific region. Pacific-Basin Finance Journal, 69, 101653. https://doi.org/10.1016/j.pacfin.2021.101653
- Samarakoon, P. A., & Athukorala, D. A. S. (2017, September). System abnormality detection in stock market complex trading systems using machine learning techniques. In 2017 National Information Technology Conference (NITC) (pp. 125–130). IEEE. https://doi.org/10.1109/NITC.2017.8285660.
- Samitas, A., Kampouris, E., & Polyzos, S. (2022). Covid-19 pandemic and spillover effects in stock markets: A financial network approach. International Review of Financial Analysis, 80, 102005. https://doi.org/10.1016/j.irfa.2021.102005
- Savva, C. S., Osborn, D. R., & Gill, L. (2009). Spillovers and correlations between US and major European stock markets: The role of the euro. Applied Financial Economics, 19(19), 1595–1604. https://doi.org/10.1080/09603100802599563
- Seth N and Sidhu A. (2021). Price Discovery and Volatility Spillover for Indian Energy Futures Market in the Pre- and Post-Crisis Periods. Indian Journal of Finance, 15(8), 24 10.17010/ijf/2021/v15i8/165816
- Shaikh, E., Mishra, V., Ahmed, F., Krishnan, D., & Dagar, V. (2021). Exchange rate, stock price and trade volume in US-China trade war during COVID-19: An empirical study. Studies of Applied Economics, 39, 5327. https://doi.org/10.25115/eea.v39i8.5327
- Sidhu, A., Katoch, R., & Kakran, S. (2021). An analysis for unit root testing of emerging Asian equity markets. PalArch’s Journal of Archaeology of Egypt/egyptology, 18(8), 1060–1070. https://archives.palarch.nl/index.php/jae/article/view/8812
- StatsAPEC. (2023). Bilateral linkage database results. Retrieved July 8, 2023, from https://statistics.apec.org/index.php/bilateral_linkage/bld_result/37/
- Stavarek, D., Repkova, I., & Gajdosova, K. (2012). Theory of financial integration and achievements in the European Union. In Financial integration in the European Union (pp. 1–31). Routledge. https://mpra.ub.uni-muenchen.de/34393/1/MPRA_paper_34393.pdf
- Strohsal, T., & Weber, E. (2015). Time-varying international stock market interaction and the identification of volatility signals. Journal of Banking and Finance, 56, 28–36. https://doi.org/10.1016/j.jbankfin.2015.01.020
- Su, X. (2020). Dynamic behaviors and contributing factors of volatility spillovers across G7 stock markets. The North American Journal of Economics & Finance, 53, 101218. https://ideas.repec.org/a/eee/ecofin/v53y2020ics1062940820301157.html
- Sun, G., Yao, X., Li, J., & Lu, T. (2023). Risk linkages between China’s stock market and APEC stock markets under China’s market liberalization. Finance Research Letters, 52, 103586. https://doi.org/10.1016/j.frl.2022.103586
- Tetlock, P. C. (2010). Does public news resolve asymmetric information? The Review of Financial Studies, 23, 3520–3557. https://doi.org/10.1016/j.frl.2022.103586
- Thomas, N. M., Kashiramka, S., & Yadav, S. S. (2017). Dynamic linkages among developed, emerging and frontier capital markets of Asia-Pacific region. Journal of Advances in Management Research, 14(3), 332–351. https://doi.org/10.1108/JAMR-10-2016-0088
- Trihadmini, N., & Falianty, T. A. (2020). Stock market contagion and spillover effects of the global financial crisis on five ASEAN countries. Institutions and Economies, 91–119. https://mojc.um.edu.my/index.php/ijie/article/view/25383
- Trung, N. B. (2019). The spillover effects of US economic policy uncertainty on the global economy: A global VAR approach. The North American Journal of Economics & Finance, 48, 90–110. https://doi.org/10.1016/j.najef.2019.01.017
- US Census Bureau. (2023). Trade in goods. Retrieved July 8, 2023, from https://www.census.gov/foreign-trade/balance/c2010.html
- Valdes, R., Von Cramon‐Taubadel, S., & Engler, A. (2016). What drives stock market integration? An analysis using agribusiness stocks. Agricultural Economics, 47(5), 571–580. https://doi.org/10.1111/agec.12256
- Wu, G., Yang, B., & Zhao, N. (2020). Herding behavior in Chinese stock markets during COVID-19. Emerging Markets Finance and Trade, 56(15), 3578–3587. https://doi.org/10.1080/1540496X.2020.1855138
- Xiao, Y. (2020). The risk spillovers from the Chinese stock market to major East Asian stock markets: A MSGARCH-EVT-copula approach. International Review of Economics & Finance, 65, 173–186. https://doi.org/10.1016/j.iref.2019.10.009
- Yamazawa, I. (1992). On Pacific economic integration. The Economic Journal, 102(415), 1519–1529. https://doi.org/10.2307/2234807
- Yarovaya, L., Brzeszczyński, J., Goodell, J. W., Lucey, B., & Lau, C. K. M. (2022). Rethinking financial contagion: Information transmission mechanism during the COVID-19 pandemic. Journal of International Financial Markets, Institutions and Money, 79, 101589. https://doi.org/10.1016/j.intfin.2022.101589
- Yasir, M., & Önder, A. Ö. (2022). Time-varying herding spillover for emerging countries: Evidence from BRIC countries and Turkey. Review of Behavioral Finance, ahead-of-print. https://doi.org/10.1108/RBF-10-2021-0218
- Yeung, H. W. C. (2000). State intervention and neoliberalism in the globalizing world economy: Lessons from Singapore’s regionalization programme. The Pacific Review, 13(1), 133–162. https://doi.org/10.1080/095127400363677
- Yousaf, I., & Ahmed, J. (2018). Mean and volatility spillover of the latin American stock markets. Journal of Business & Economics, 10(1), 51–63. https://www.proquest.com/openview/aefaf0cee4688e1e37f9c455d64f096a/1?pq-origsite=gscholar&cbl=1946347
- Zhang, H., & Giouvris, E. (2022). Measures of volatility, crises, sentiment and the role of US’ Fear’Index (VIX) on herding in BRICS (2007–2021). Journal of Risk and Financial Management, 15(3), 134. https://doi.org/10.3390/jrfm15030134
- Zhang, W., Zhuang, X., & Lu, Y. (2020). Spatial spillover effects and risk contagion around G20 stock markets based on volatility network. The North American Journal of Economics & Finance, 51, 101064. https://doi.org/10.1016/j.najef.2019.101064
- Zhong, Y., & Liu, J. (2021). Correlations and volatility spillovers between China and Southeast Asian stock markets. The Quarterly Review of Economics & Finance, 81, 57–69. https://doi.org/10.1016/j.qref.2021.04.001