
 ?Mathematical formulae have been encoded as MathML and are displayed in this HTML version using MathJax in order to improve their display. Uncheck the box to turn MathJax off. This feature requires Javascript. Click on a formula to zoom.
Abstract
This paper examines the trade co-movements and shock spillover across four African geographic regions. Specifically, we were motivated by the very low intra-trade activities in Africa, despite increased regionalism to study the possibility of a country’s trade shock being transferred to its trading partners on the continent. Knowing the trade connectedness and shock transmission among African countries will serve as a baseline for the AfCFTA implementation. In our analysis, we considered the four African regional quarterly data between 2005 and 2021 from UNCTAD. The continent was divided into four regions namely, Western, Middle, Eastern, and Southern Africa. We divided the time into pre- and post-AfCFTA periods. The Dynamic Conditional Correlation (DCC) and the Diebold and Yilmaz (2012) models were adopted to determine the trade co-movement and the shock spillover respectively. The results show different trade co-movement and trade shock spillovers among the regions at different times. The trade co-movement seems to be dominant between the Middle and Southern African regions. Further analysis shows the presence of trade shock transmission across all four regions. The Western African region exhibits a sign of the biggest trade shock receiver from the other regions, while the Southern African regions turn out to be the largest contributor of trade shocks to the other regions both in the post and pre- AfCFTA period. The study contributes by sending a signal to AfCFTA implementers that trading on the African continents behaves differently among the various geographic regions. It also provides early warning signal for AfCFTA policy implementation.
1. Introduction
The African Trade Unions agreed to establish the African Continental Free Trade Area (AfCFTA) in a bid to speed up the implementation of the 1991 Abuja Treaty. The treaty entreats Member States of the Organization for African Unity to establish a common African Market AfCFTA since its launch in 2015 became a flagship program of the AU. But for the COVID-19 shock, African economic growth was forecasted to be around 3.6% between 2019 and 2020 with the world’s fastest growing economies found on the continent (African Economic Outlook 2018). The continent still relies on the imports of capital goods outside Africa with heavy dependence on commodity and agriculture export. According to World Bank report published in February 2022, Africa has a global trade share of only 3 percent with export diversification yet to be achieved. Many countries on the African continent depend heavily on rent from extractive exports and are slow in industrialization efforts.
Africa has integrated very fast with the rest of the world in terms of trade to the detriment of itself. As shown in Figure , Intra-African trade remained below its potential reflecting about 15 percent of total African trade volumes. This is far below intracontinental trade in other parts of the world. For instance, European intracontinental trade accounts for about 67% of total trade, 60 percent in Asia, and 46 percent in America.
Figure 1. Intraregional trade (imports + exports) as a percentage of total trade.
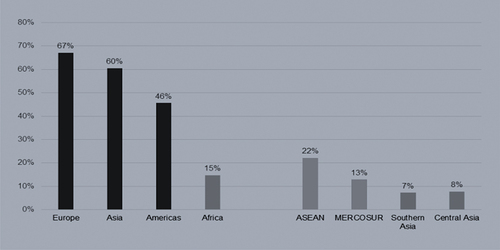
Relatively African markets have remained disintegrated while other Regional Economic Communities have seen improvement in trade integration through a reduction in tariffs. In Africa, non-tariff barriers such as uncoordinated bureaucratic procedures, long waiting time at borders or lengthy and crooked export procedures have raised trade costs on the continent. To some extent some papers have found that country to country bilateral trade agreements have been more beneficial than multiple membership trade agreements. For example, Sunge and Mapfumo (Citation2014) found that Zimbabwe’s bilateral trade agreement has created more trades and growing. They also find that the multi-membership trade agreements have limits on bilateral trade. Their results therefore encouraged Zimbabwe to negotiate for more bilateral trade agreements especially with its border countries.
The baseline analysis of trade connectedness for AfCFTA implementation appears to be of central importance in determining how trade shocks from a particular country will affect other countries. A better understanding of existing trade connectedness among African countries will enhance policy direction in AfCFTA execution. It will provide the baseline as to which countries to focus on trade among the various countries on the African continent. It will also provide information to investors on how to diversify their investment in relation to intra-trade to avoid trade risk spillovers. Several papers have researched on Trade integration but failed to investigate trade connectedness. For instance, Bonga-Bonga and Mabe (Citation2020) used the DCC -GARCH model to assess the degree of financial integration between three African trading blocs, namely, the Common Market of Eastern and Southern Africa (COMESA), the East African Community (EAC) and the Southern African Development Community (SADC). They find that not all the countries within each of the three trading blocs are integrated into their regional factors. Bailey et al. (Citation2021) used de-identified from Facebook to construct a new and publicly available measure of pairwise social connectedness between 170 countries and 332 European regions. They find that two countries trade more when they are more socially connected, especially for goods where information frictions may be large.
Having recorded lower intra-African trade provides a baseline for trading among the countries on the continent. This tells us that, before the AfCFTA, African countries were trading among themselves but not enough to project the continent to the industrialization pedigree expected of it. With the level of intra-trade among the countries on the continent, it is expected that there would be a certain level of cyclical synchronization across Africa. As indicated by De Grauwe and Ji (Citation2017) that, for common shocks, synchronization takes place through trade integration and financial integration. The fascinating issue here is to know how existing impact of a country-specific trade shock is transferred to its trading partners on the continent. A similar issue was investigated by Pham and Sala (Citation2022) by looking at the connectedness of inflation and unemployment among G7 countries. They find that connectedness is larger for inflation than to unemployment. Investigating the level of intra-trade connectedness among African countries will provide baseline information for the countries to determine which trade partners they should prioritize in AfCFTA implementation.
The objective of this paper is to unravel the extent of trade connectedness and shock transmission among African regional blocs. Understanding how the economies are trade connected and shocks transmitted is crucial and will be a guide for AfCTA policy makers. The paper takes a step forward with respect to the extant literature on trade integration in Africa by considering the asymmetries in connectedness across a key trade variable, country specific export as a percentage of total volume of merchandize trade. Understanding how trade among African economies are connected and shocks transmitted is crucial for AfCFTA policy makers. For example, trade shock from an African region can spread a complex effect to other regions on the continent. Therefore, studying the trade connectedness of African countries is an important and early action for AfCFTA policy decisions.
The paper also adds to the existing literature by contributing methodologically and empirically by utilizing the Diebold-Yilmaz Connectedness Index (DYCI) to investigate the baseline connectedness among all the sub-Saharan African countries. The DYCI methodology is adaptable and direct to implement approach to study intra-trade connected among African countries. This method has been used extensively to study the connectedness among several economic variables but not on trade and this is what makes this research unique. Bonga-Bonga and Mabe (Citation2020) in their paper measured trade connectedness as how current distribution of exports is close to a theoretical one or trade frictionless full potential integration. Aside the DYCI, several authors have tried to use correlation-related measures for spillover and connectedness (Gasper, Citation2012). The classical correlation as a measure of connectedness may be misleading and has led to the development of alternative models like the dynamic conditional correlation of Mink et al. (Citation2007) and Adrian and Brunnermeier (Citation2008). Less direct measures of connectedness have also been advanced in literature by Corsetti et al. (Citation2005) and Dungey et al. (Citation2005). The underlying concept here is to evaluate the number of unexpected moves in some economies may be explained by moves in other economies. The DYCI models fit into this category. The DYCI method extends the earlier models by introducing directional spillovers.
The rest of the paper is organized as follows: In the next section we review the literature related to the topic understudy. In section 3, we discuss the methodology and the various tests needed to unravel our hypothesis. Empirical results and their economic implications are discussed in section 4. In section 5, we discussed the conclusion and the policy implications.
2. Literature Review
Recent economic context has shown a strong market interdependence across borders. The literature on modelling and measuring this economic connectedness and systematic shocks has been growing. The literature in this area has increased because of the transmission of idiosyncratic economic or financial shocks from one market to the other. This was clearly exhibited in the 2008–2009 financial and economic crisis, and it has triggered research in market connectedness and systemic risk.
Several papers have used network models to capture a group of financial institutions and the bilateral assets or liabilities exposures between them. For example, Acemoglu et al. (Citation2015) studied the direct and spillover effect of state capacity on Colombia. They model the determination of the state capacity as a network game between municipalities and the national government. The model specifically explores the municipality network and the roots of local state capacity related to the presence of the colonial state and royal roads. They find that local state capacity decisions are strategic complement. They also found that the spillover effects are significant, constituting about 50% of the quantitative impact of an expansion in local state capacity, however, network effect driven by equilibrium reactions of other municipalities is bigger. Another set of methods papers use statistical models to derive the financial and economic connectedness and systemic risk that are typically non-structural in nature. An example is the CoVar approach adopted by Adrian and Brunnermeier (Citation2011) and the volatility spillover structure by Diebold and Yilmaz (Citation2009, Citation2012, Citation2014). Recent paper by Costa et al. (Citation2022) used social network models to position the Italian industrial sectors within their trade networks to analyze their ability to transmit economic shocks within the economic system. Their results show a mismatch between the industries which are pivotal within the international trade network and industries which play a central role for domestic shock propagation. With their results, they conclude that the capacity of transmitting stimuli from abroad is limited, weakening the chances of benefiting from positive shocks, though it could be a partial neutralizer to negative shocks that emanate from business cycles. Ekeocha and Ogbuabor (Citation2019) in their working paper investigated trade shock transmission between Africa, the BRIC and the rest of the global economy with to understand Africa’s exposure to trade shocks. They find that Africa economies are predominantly net receivers of trade shocks.
The network models have been applied empirically since the 2008–2009 financial and economic crisis. Uluceviz and Yilmaz (Citation2021) applied the model to analyze connectedness between the real and financial sectors of the US economy and find that during times of financial distress or business cycle turning points, the direction of connectedness runs from the real sector to financial market However, the direction connected reverses when they add real activity index to the real sector measure. The financial markets generate positive net connectedness to the real side the economy. Bostanci and Yilmaz (Citation2020) use network models to estimate the global network structure of sovereign credit risk. They used sovereign credit default swaps to establish that the level of credit risk connectedness among sovereigns is high and it is comparable to the connectedness among stock markets and foreign exchange markets. They further establish that emerging market countries have played a major role in the transmission of sovereign credit risk, whiles developed countries and the debt-ridden developed country have played a marginal role after the global financial crises in the 2008.
On trade integration, Arribas et al. (Citation2020) present several indicators of trade integration by focusing on European unions. They suggest measures such as openness, connectedness, and integration to establish that the process of trade integration as grown among European union members, but the integration among non-member states has been increasing slowly. Anderson and Yotov (Citation2016) in their paper estimated the effect of bilateral trade volume in two digits manufacturing goods from 1990–2002, using the panel data gravity methods to resolve two-way causality. They find that some countries gain over 5% of real manufacturing income, while some lose less than 0.3%. They also estimated that global efficiency of manufacturers trade rises 0.9% depending on the distance function of measure of iceberg melting. Baier et al. (Citation2019) indicate that estimation of the effects of regional trade agreements can be varied within the same trade agreement. They show in their paper that Romania, Bulgaria and Hungary exhibit positive effect of regional trade agreement, whiles Cyprus show negative effect. In effect, they established that the effect of trade agreement can be heterogenous within the same trade area. Bailey et al. (Citation2021) use the de-identified data from Facebook to construct a new publicly available measure of the pairwise social connectedness between 180 countries and 332 European regions. They find trade to be prevalent in pairs of countries which are socially connected, especially for goods with larger information friction. They indicate that after controlling social connectedness, the estimated effects of geographic distance and country borders on trade decline substantially. On the intra-regional economic trading effect on economic growth, Hazman et al. (Citation2021) used data spanning 1995 to 2019 across five regional economies, namely ASEAN, EU, NAFTA, MERCOSUR, and COMESA to establish this relationship. They adopted the GMM and the 2SLS panel approach to establish that most increases in export may reverse economic growth in intra-regional trading. They concluded that trading in commonality is doubtful in promoting long run economic growth.
The above papers did not consider the co-movement and transmission of trade shocks among the Sub-Saharan African countries. This paper is unique because it brings the notion of connectedness in testing the bilateral transmission of trade shocks and co-movement of trades among Sub-Saharan geographical blocs.
3. Data and methodology
The study seeks to unravel the extent of co-movement and trade shock spillovers of intra trade in Africa. We sourced quarterly four regional bloc trade data from the United Nations Conference on Trade and Development (UNCTAD). UNCTAD categorizes the sub-Saharan Africa into four trade blocs, that is Eastern, Middle, Southern and Western African trade groups. Countries in each category and their corresponding commodities traded are found in Appendix I & II. Each bloc export time series trade volumes in Africa are used to proxy intra-trade in Africa. We analyze the co-movement and spillovers of trade shocks in different periods between 2005 and 2021. We also split the data into two subperiods, that is pre and post AfCFTA announcement (event) of 2005–2017 and 2018–2021 respectively. We understudy the comovement and the spills overs of the trade shocks in the two event periods. The addition of event study on trade shock transmission is supported by Kočenda and Moravcová (Citation2019) who find a strong comovement and spillover among economic variables on the European market during financial and economic distress. In this paper, we are looking at the shock spillovers and co-movement before and after the announcement of the AfCFTA. The addition of the event study is also supporting the evidence in the empirical literature that economic series may exhibit structural breaks in times of economic crisis, Andreou and Ghysels (Citation2009) or changes in policy (Pesaran et al., Citation2006).
Quaterly percentage change in trade is computed from the quarterly trades from each trade zone as
, where
is the year
to Africa. The Augmented Dickey-Fuller (ADF) generalized least square test is used to test the stationarity of the of the percentage change series.
Following Kočenda and Moravcová (Citation2019), the paper adopted the DCC model by Engle (Citation2002) to evaluate the dynamics of co-movement between the African countries’ trades. Here, we are trying to ascertain whether dynamic correlation exists among the African geographical trade zones, and if its exist, does it increase, decrease, or remain the same over the period of our study. The advantage of the DCC model is that it is parsimonious compared to other multivariate GARCH models. The DCC model is also flexible because it allows for the estimation of time varying volatilities, covariances, and correlations of various series over time. The two-stage approach is adopted in the estimation of the DCC model. The univariate GARCH models are estimated for each trade series . The residuals transformed by their standard deviations from the first stage GARCH models are used to construct conditional correlation matrix. Based on the assumption of no serial correlation, the series
in the mean equation follows a random walk and the composition of the conditional covariance matrix is given by:
where is the univariate GARCH model, that is the AR(1)-GARCH (1,1) is model if serial correlation is found in the trade series of the GARCH(1,1) model.
is the
symmetric positive definite matrix given by
where is the
vector of standardized residual;
is the
of the unconditional variance of
; and
and
are non-negative scaler parameters satisfying the condition
. The log maximum likelihood function under a heavy tailed multivariate generalized error distribution (GED) is used to estimate the DCC model. The DCC model helps us to test the hypothesis that the dynamic conditional correlation between the African trade zones do not change pattern and magnitude across the sub-periods under study.
Finally, estimate the trade shock spillovers based on variance decompositions as proposed and created in earlier papers by Diebold and Yilmaz (Citation2009, Citation2012, Citation2014). The variance decomposition spill-over measures are very intuitively appealing for several reasons. Firstly, it permits different horizon volatility spillovers, enabling examination of variety of horizons and selection of the preferred horizon. This is very necessary because 1-year volatility spill-over may be different from 10 or 30-year spillovers. Second, the model is intuitively appealing in a sense that it answers key practical questions. It answers question at the primary pairwise level, as to how much of trade zone trade uncertainty (at horizon
) is caused by the shocks due to another trade zone
trade but not trade of zone
itself. The model is also strongly related to modern network theory, specifically, the degree of distribution and mean degree. Finally, the model is intimately linked to the recent proposed measures of systemic risk, such as the marginal expected shortfall developed by Acharya et al. (Citation2017) and CoVar by Tobias and Brunnermeier (Citation2016).
The variance decomposition of
where
. The moving average representation is
, where the
coefficient matrices
obey the recursion
, with
an
identity matrix and
for
. We follow Diebold and Yilmaz (Citation2012) and Balcılar et al. (Citation2016) in using the generalized identification framework of Koop et al. (Citation1996) and Pesaran and Shin (Citation1998) which allows for invariant ordering of variables, though it will produce the variance decomposition. The generalized approach instead of orthogonalizing the trade shocks allow for its correlation and appropriately accounts for it.
The contribution to trade
H-step-ahead generalized forecast error variance,
is
,
where is the covariance matrix of the disturbance term
,
is the standard deviation of the disturbance of the
equation, and
is the selection vector with one as the
element and zeros otherwise. From the Koop-Pesaran-Potter-Shin generalized VAR framework, the variance weights do not add up to 1, that is
Therefore, normalizing each entry of the generalized variance decomposition matrix by the row sum to obtain pairwise directional connectedness from country
to country
gives:
therefore, and
.
We now denote the as
(V is the trade shock), this is less burdensome and more clearly informative. Having obtained the pairwise shock spillover measure,
, we move on to the total directional trade shock spillover measures. The total directional trade shock spillover to zone
from all other zone
is:
on the other hand, total directional measure from zone to all other zone
is:
Now the system-wide trade shock spillover measure is obtained as:
The equation above estimates the total system-wide trade shock spillover, and it is the sum of all total trade shock spillovers whether to or from a particular country.
4. Empirical results and discussions
Table reports the descriptive statistics for the various Africa regions trade growth. Overall, the largest trade growth across the regions over the period of our study can be found in the Western part of Africa. This is followed by the Middle African countries. And the least of all the trade flows are Eastern African countries. Specifically, the Western African region recorded an average trade growth of about 1.08, representing 108% growth. The second is about 100% growth, which is the Middle African countries. South Africa was third in terms of the rankings in the average trade growth.
Table 1. Descriptive statistics
The standard deviation measuring the variations in the trade growth across the various regions on the African continent is also recorded in Table row 5. From the Table, the Middle African countries record the highest volatile trade growth. The is expected because the countries with the region recorded quite several wars which may have impact on trade flows among themselves with the period of our study.Footnote1 Typical of these wars are the ongoing 2006 Bakassi Conflict and 2014 Boko Haram insurgency in Cameroon, the present Central African Republic Civil War, 2010 Civil War, 2008 Battle of N’Djamena in Chad, 2016–2017 Pool War in Congo, 2012–2013 M23 Rebellion and 2013–2018 Batwa-Luba clashes, all in Congo. This is followed by Eastern Africa. The third volatile region in terms of trade growth is Western Africa and the least is Southern Africa. It is not surprising to see Southern Africa recording the least trade growth variability. The main exports in these regions are minerals and other precious metals for which the demand on the global market is consistent. The Middle African countries may experience the high variability in trade growth because of the persistent war in the largest country in this region. The Jarque-Bera test of normality in the last row indicates that the data for the analysis were drawn from a time series which are normally distributed, except for the Middle Africa trade growth data which gives an indication of non-normality at 1% significance. In Panel B, it is realized that the high trade growth variations recorded by the Middle Africa region is in the post-AfCFTA announcement period. The Eastern African region continues to be the second most trade growth volatile region on the continent.
The dynamic pairwise correlation of the four Africa regions trade growth is reported in Figure . Different structures of co-movements are exhibited by the four trade growths across the various
Figure 2. Pairwise co-movement among the various trade regions in Sub-Saharan Africa.
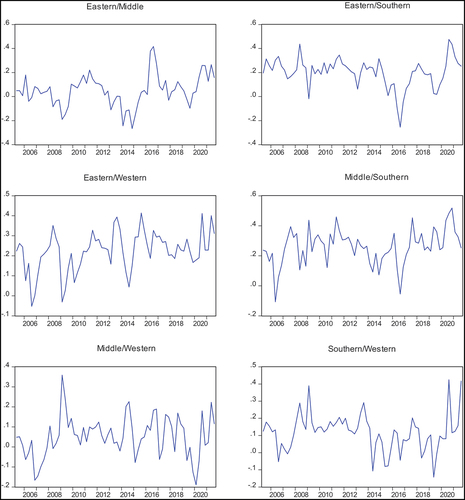
African trade regions. Eastern part of the African continents trade correlation with other part of the continent is low, mostly recording values not more than 0.4. Specifically, the trade dynamic correlation between Eastern and Middle African countries is not that strong, mostly hovering around 0.2, with a peak in 2017. The Eastern and the Southern Africa co-movement was mostly below 0.2, peaking in 2008 and 2021 around 0.4. Relatively, the Eastern trade dynamics seem to commove with the Western trade dynamics. For several years was a peak around 0.4. The comovement between the Eastern bloc and the Western bloc is not surprising. Though the two trade regions are geographically separated, they possess certain economic complementarities that can foster trade and cooperation. For example, the Eastern bloc is known for its agricultural products, such as tea, coffee, and horticultural products, while Western countries have strengths in the production of commodities like cocoa, cashew nuts, and cotton. These complementarities can create opportunities for trade and specialization, leading to increased cooperation and coordination between the two blocs.
The Southern region of Africa seems to record a very high co-movement in trade with other regions, especially the Middle and the Western region. This is not surprising because the Southern region category has two of the topmost competitive countries in sub-Saharan Africa (South Africa and Botswana. These countries have the competitive edge to export to the other region because of relatively good quality institutions, efficient goods and labor markets, and a well-developed financial market. The Southern and the Middle regions record a common movement in trade with a correlation of more than 0.5 in 2019. Mostly the correlation peaks around 0.4 over the years. The Western and the South region also exhibit common movement in their trade, peaking at 0.4 in the years 2009, 2019 and 2021. Both the Southern region and Middle Africa are rich in natural resources. Middle Africa possesses abundant mineral resources such as copper, cobalt, and diamonds (see Appendix II). These resources can attract trade and investment from countries in the Southern region, leading to economic interdependencies and comovement of trade flows. Geographical proximity may also play a major role in trade comovement. Some countries in Middle Africa countries share borders or have proximity to countries within the Southern region. For example, countries like Angola, which is geographically located in Middle Africa, shares borders with Namibia. This geographic proximity can create trade and economic linkages, leading to comovement and coordination in certain areas.
The Middle and the Western regions record the lowest and co-movement over years and across the various pairwise regions. The correlation dynamics only peaks at 3.5 and it can get as low as −0.2 in recent times. Overall, the Middle region trade dynamics seem to co-move with the Southern region than any other region. South Africa region is stronger in terms of their co-movement with other regions. The weakest of the pairwise co-movement is between the Middle and the Western Region. Looking at these co-movements as the baseline for AfCFTA implementation, there will be the need to strengthen the bilateral movement in trade between the Middle, and both the Eastern and the Western regions of the African continent.
Table reports the Diebold and Yilmaz (Citation2012) generalized trade volatility spillover index. We examine the trade volatility spillover (shock) to and from the four regions of the African continent. It is important to estimate and quantify the trade shock transmission between the four regions of the African continent, as this can help the policy maker and the investor to synthesis their approach if one region turns to absorb or contribute to all the regions trade shocks. The objectives of the AfCFTA can be achieved when the trade shocks transmission is minimized or controlled. Studying the Intra-Africa trade shock transmission will also unravel the potential spread in exposures that is likely to stampede the success of the AfCFTA. It will also determine the African region that is susceptible to trade shocks originating from the other regions on the continent.
Table 2. Sub-Saharan Africa trade regions connectedness (2005–2021)
The Intra-Africa trade shock transmission will reveal the region that is dominant in trade risk and therefore has the tendency of spreading this risk to other regions. In Table , we report the to and from effect of trade shocks across all the four regions on the continent. The overall trade shock transmission is 27.20%. It is clear from the Table that the Western Africa region is the biggest receiver of trade shocks (43.2%) from the other regions. This is followed by Middle Africa, and the least is Eastern Africa. In terms of the contributions to shocks, it is estimated that Southern Africa transmits more trade shocks than any other region on the continent. Next to the Southern Africa region is the Eastern Africa region. The least in terms of shock contribution is the Western Africa region, with a shock transmission of 14.9%.
We divided the period of our study into pre-AfCFTA period and post-AfCFTA announcement period. The analysis in both periods is motivated by the fact that the AfCFTA announcement may trigger some housekeeping activities among the various countries to avoid surprises. This may build up into aggregated shock anticipation at the regional level.
Table reports the pre-AfCFTA volatility spillovers across the various regions on the African continent. The Western Africa region maintained the highest shock receiver in the pre-AfCFTA period. This is followed by the South Africa region, which receives about 28.1% of shocks from other regions. All the regions apart from the Western region receive almost the same shocks from others.
Table 3. Sub-Saharan Africa trade regions connectedness before AfCFTA (2005–2017)
From Table , the overall trade shock transmission in the African region has significantly increased after the announcement of the AfCFTA. This may be attributed to the overreaction and under-reaction to the announcement among member countries within the various regions.
Table 4. Sub-Saharan Africa trade regions connectedness after AfCFTA (2018–2021)
Considering the shocks from other regions to the various regions, Southern Region of the African continent receives the highest shocks followed by Western Region and the least is Eastern Africa. The Middle African becomes the largest contributor of shocks to the other regions, followed by the Eastern Africa region. Surprisingly, the Southern Africa region becomes the least contributor to trade volatility to the other regions.
5. Conclusions and recommendations
The paper investigates the trade dynamics in co-movement and shock spillovers among four designed regions in Africa between 2005 and 2021. It divided the time into before and after AfCFTA. The study examined the trade conditional correlation and volatility spillovers among the four regions, namely the Western Africa region, Middle Africa region, Southern Africa region and the Eastern Africa region. Trade change is measured as the natural log of current trade to the previous trade. The DCC and the Diebold-Yilmaz models were used to examine the trade correlation dynamics and the volatility among the four regions in Sub-Saharan Africa. The results show different trade co-movement and trade shock spillovers among the regions at different times in the period of the study.
Detailed analysis shows that the conditional correlation (co-movement) among the pairs of the four regions on the African continent in terms of trade is not equal. The co-movement in trade seems to be dominant in between the Middle and the southern African regions, recording correlations above 0.4 and above in most of the periods. The least of the co-movement in trade occurs between Eastern and the Middle regions, with correlation mostly below 0.2 in the period of our study.
Furthermore, the study analyze the trade shock (volatility) spillovers among the four geographical regions on the African continent. The results show the presence of trade shock spillovers across the four regions. There was an overall trade shock spillover of 27% over the period of our study. The breakdown of this spillovers indicates that Western African region receives the largest of the trade shocks and it’s the least contribution of trade shock on the continent. The Eastern region of the continent receives the least of the trade shocks from other regions. The highest contributor of the trade shocks to other regions is South African region. The period of our study was divided into pre and post AfCFTA announcement. The West African region remains the largest receiver of trade shocks from the other regions in the pre-AfCFTA announcement period. All the other regions seem to show almost equal receivers of trade shocks from the other regions. Surprising the South African region seems to be the lowest contributor of trade shocks in the post AfCFTA announcement period.
The findings from this paper convey an important implication to the policy maker for the AfCFTA implementations. The policy maker should appreciate the existing intra trade activities on the African continent. The study finds significant different trade co-movement and shock (volatility) spillovers among the four geographical regions on the African continent. The results send a signal to the AfCFTA implementers that trading activities on the continent behaves differently among the four geographical regions. The disparity in the connectedness and transmission among the regions provides information as to how AfCFTA implementers should direct investment to where there is a strong regional connectedness and lower trade volatility spillover. The findings further serve as the baseline for ascertaining how trading among countries behave on the African continent. Knowing the trade co-movement and shocks among the regions provide information on trade investment decisions on the African continent.
The aggregated data of African intra-trade regions suppresses the country specific signals of trade connectedness and volatility spillovers. Further studies may perform similar analysis on country level data. This will provide the idiosyncratic country specific trade connectedness and volatility spillovers across the continent.
Disclosure statement
No potential conflict of interest was reported by the author(s).
Notes
1. See Appendix I & II for the list of countries and the various commodities in the regional categorizations.
References
- Acemoglu, D., García-Jimeno, C., & Robinson, J. A. (2015). State capacity and economic development: A network approach. American Economic Review, 105(8), 2364–15. https://doi.org/10.1257/aer.20140044
- Acharya, V. V., Pedersen, L. H., Philippon, T., & Richardson, M. (2017). Measuring systemic risk. The Review of Financial Studies, 30(1), 2–47. https://doi.org/10.1093/rfs/hhw088
- Adrian, T., & Brunnermeier, M. (2008). CoVar. Staff report 348. Federal Reserve Bank of New York.
- Adrian, T., & Brunnermeier, M. K. (2011). CoVar (no. w17454). National Bureau of Economic Research.
- Anderson, J. E., & Yotov, Y. V. (2016). Terms of trade and global efficiency effects of free trade agreements, 1990–2002. Journal of International Economics, 99, 279–298. https://doi.org/10.1016/j.jinteco.2015.10.006
- Andreou, E., & Ghysels, E. (2009). Structural breaks in financial time series. In T. G. Andersen (Ed.), Handbook of Financial Time Series (pp. 839–870). Springer-Verlag.
- Arribas, I., Bensassi, S., & Tortosa-Ausina, E. (2020). Trade integration in the European Union: Openness, interconnectedness, and distance. The North American Journal of Economics & Finance, 52, 101167. https://doi.org/10.1016/j.najef.2020.101167
- Baier, S. L., Yotov, Y. V., & Zylkin, T. (2019). On the widely differing effects of free trade agreements: Lessons from twenty years of trade integration. Journal of International Economics, 116, 206–226. https://doi.org/10.1016/j.jinteco.2018.11.002
- Bailey, M., Gupta, A., Hillebrand, S., Kuchler, T., Richmond, R., & Stroebel, J. (2021). International trade and social connectedness. Journal of International Economics, 129, 233–267. https://doi.org/10.1016/j.jinteco.2020.103418
- Balcılar, M., Demirer, R., Hammoudeh, S., & Nguyen, D. K. (2016). Risk spillovers across the energy and carbon markets and hedging strategies for carbon risk. Energy Economics, 54, 159–172. https://doi.org/10.1016/j.eneco.2015.11.003
- Bonga-Bonga, L., & Mabe, Q. (2020). How financially integrated are trading blocs in Africa? The Quartely Review of Economics and Finance, 75, 84–94. https://doi.org/10.1016/j.qref.2019.05.013
- Bostanci, G., & Yilmaz, K. (2020). How connected is the global sovereign credit risk network? Journal of Banking & Finance, 113, 105761. https://doi.org/10.1016/j.jbankfin.2020.105761
- Corsetti, G., Pericoli, M., & Sbracia, M. (2005). ‘Some contagion, some interdependence’: More pitfalls in tests of financial contagion. Journal of International Money and Finance, 24(8), 1177–1199. https://doi.org/10.1016/j.jimonfin.2005.08.012
- Costa, S., Sallusti, F., & Vicarelli, C. (2022). Trade networks and shock transmission capacity: A new taxonomy of Italian industries. Journal of Industrial and Business Economics, 49(1), 133–153. https://doi.org/10.1007/s40812-022-00208-2
- De Grauwe, P., & Ji, Y. (2017). The international synchronization of business cycles: The role of animal spirits. Open Economies Review, 28(3), 383–412. https://doi.org/10.1007/s11079-017-9434-3
- Diebold, F. X., & Yilmaz, K. (2009). Measuring financial asset return and volatility spillovers, with application to global equity markets. The Economic Journal, 119(534), 158–171. https://doi.org/10.1111/j.1468-0297.2008.02208.x
- Diebold, F. X., & Yilmaz, K. (2012). Better to give than to receive: Predictive directional measurement of volatility spillovers. International Journal of Forecasting, 28(1), 57–66. https://doi.org/10.1016/j.ijforecast.2011.02.006
- Diebold, F. X., & Yılmaz, K. (2014). On the network topology of variance decompositions: Measuring the connectedness of financial firms. Journal of Econometrics, 182(1), 119–134. https://doi.org/10.1016/j.jeconom.2014.04.012
- Dungey, M., Fry, R., Gonzales-Hermosillo, B., & Martin, V. (2005). Empirical modelling of contagion: A review of methodologies. Quantitative Finance, 5(1), 9–24. https://doi.org/10.1080/14697680500142045
- Ekeocha, P. C., & Ogbuabor, J. E. (2019), Trade shock transmission: A study of selected African economies, the BRIC and the rest of the global economy, Working paper
- Engle, R. (2002). Dynamic conditional correlation: A simple class of multivariate generalized autoregressive conditional heteroskedasticity models. Journal of Business & Economic Statistics, 20(3), 339–350. https://doi.org/10.1198/073500102288618487
- Gasper, R. M. (2012). Comment on “better to give than to receive” by Francis X. Diebold and Kamil Yilmaz. International Journal of Forecasting, 28(1), 67–69. https://doi.org/10.1016/j.ijforecast.2011.02.009
- Hazman, S., Omar, K., Abd Halimb, A. S., & Syazman Shamsudin, M. S. (2021). Export led growth via intra-regional trading: An econometric analysis of ASEAN, EU, NAFTA, MERCOSUR and COMESA. Applied Econometrics and International Development, 28(2), 5–28. https://ideas.repec.org/a/eaa/aeinde/v21y2021i2_1.html
- Kočenda, E., & Moravcová, M. (2019). Exchange rate comovements, hedging and volatility spillovers on new EU forex markets. Journal of International Financial Markets, Institutions and Money, 58, 42–64. https://doi.org/10.1016/j.intfin.2018.09.009
- Koop, G., Pesaran, M. H., & Potter, S. M. (1996). Impulse response analysis in nonlinear multivariate models. Journal of Econometrics, 74(1), 119–147. https://doi.org/10.1016/0304-4076(95)01753-4
- Mink, M., Jacobs, J., & De Haan, J. (2007). Measuring synchronicity and co-movement of business cycles with an application to the euro area. Working Paper No. 2112. CESifo.
- Pesaran, M. H., Schuermann, T., Treutler, B. J., & Weiner, S. M. (2006). Macroeconomic dynamics and credit risk: A global perspective. Journal of Money, Credit, and Banking, 38(5), 1211–1261. https://doi.org/10.1353/mcb.2006.0074
- Pesaran, H. H., & Shin, Y. (1998). Generalized impulse response analysis in linear multivariate models. Economics Letters, 58(1), 17–29. https://doi.org/10.1016/S0165-1765(97)00214-0
- Pham, B. T., & Sala, H. (2022). Cross-country connectedness in inflation and unemployment: Measurement and macroeconomic consequences. Empirical Economics, 62(3), 1123–1146. https://doi.org/10.1007/s00181-021-02052-0
- Sunge, R., & Mapfumo, A. (2014). The impact of intra-regional trade country to country billaterial trade agreement on Trad flows between Zimbabwe and its SADC trading partners. Journal of Economics & Sustainable Development, 5(14), 111–118.
- Tobias, A., & Brunnermeier, M. K. (2016). CoVaR. The American Economic Review, 106(7), 1705. https://doi.org/10.1257/aer.20120555
- Uluceviz, E., & Yilmaz, K. (2021). Measuring real–financial connectedness in the US economy. The North American Journal of Economics & Finance, 58, 101554. https://doi.org/10.1016/j.najef.2021.101554
