
 ?Mathematical formulae have been encoded as MathML and are displayed in this HTML version using MathJax in order to improve their display. Uncheck the box to turn MathJax off. This feature requires Javascript. Click on a formula to zoom.
Abstract
This paper investigates herd behavior in frontier Vietnamese stock markets under the impacts of COVID-19. Using models with two measures of return dispersions, we find that herd behavior does not exist in the three stock markets in extreme movements but in normal market conditions. Herding is more severe in two stock exchanges, HoSE and HNX, than in the OTC market UpCOM. Intentional herding is the main form and has been more intense in HoSE and HNX since the COVID-19 outbreak, while it is mainly significant in UpCOM in the pre-pandemic period. There is strong evidence of significant intentional herding on days of high volatility in UpCOM and HNX for all the timeframes, while considerable spurious herding on days with low volatility is found in UpCOM and HNX for all the examined periods except for the pandemic one. The evidence that herding was more pronounced during high volatility days in HoSE was relatively weak overall. Finally, pandemic uncertainty or government responses do not affect heightening or mitigating herd behavior, respectively.
Keywords:
1. Introduction
The COVID-19 pandemic triggered an emergency globally, harmed the global economy, and made the future unpredictable (Carlsson-Szlezak et al., Citation2020). First detected in China in December 2019, the coronavirus rapidly spread worldwide, posing threats to life and normality as we know it. No one could be sure about how long the pandemic would be; whether the government measures would be temporary or permanent; how low the consumer spending would be, and consequently, the revenue of firms would even fall (Altig et al., Citation2020; Moran et al., Citation2022).
To global financial markets, COVID-19 was a real “black swan” as stock markets worldwide experienced an unfolding journey with the ups and downs of share prices (Pochea, Citation2021), resulting in rising uncertainty among investors. There is mounting evidence that the COVID-19 pandemic also deeply affected investor sentiment, causing them to panic and grow pessimistic about their investments (Dash & Maitra, Citation2022). This situation created ideal conditions for herd behavior—the tendency for investors to ignore their information and mimic others’ investment decisions (Bikhchandani & Sharma, Citation2000). However, herding would occur not without its consequences: as fundamental information is suppressed, the asset prices are driven away from their intrinsic value, resulting in subsequent market crashes and price bubbles (Bikhchandani et al., Citation1992; Hott, Citation2009). The studies on developed and emerging stock markets around the world have found compelling evidence of causality between herd behavior and its COVID-19-related stimulators, such as government responses or public sentiment (Aslam et al., Citation2021; Bogdan et al., Citation2022; Bouri et al., Citation2020; Yuan, Citation2021). Despite growing literature and increasing interest in frontier markets thanks to their superior performance in the past and their diversification benefits (Spiru & Qin, Citation2016), the impacts of the pandemic on herding in those markets are left relatively understudied.
The study aims to bridge the gap in the literature by examining herd behavior in a frontier market – Vietnam – during the period of the pandemic. Generally, Vietnamese stock market is characterized by a number of common features of a typical frontier marketFootnote1: being located in a developing country with solid macroeconomic foundation and potential economic growth; experienced significantly high rate of return for years; and has been suffering from lack of transparency as well as inefficient information flows.Footnote2 In addition, the market also has its unique characteristics, for instance, superior performance compared to other Asian frontier markets during the pandemicFootnote3 as well as the low valuation due to the current decline in the market. As a result, this study would not only try to fill in the literature gap about herding in frontier markets during the crisis, but would also seek to provide useful insights into the current situation of the market.
The purpose of this study is to investigate herd behavior in the frontier Vietnamese stock market, which, because of its attractiveness, has recently gained increasing prominence and drawn more and more attention from investors, both foreign and domestic. Thanks to its solid foundations, the country’s economy had constantly grown several times faster than the world average for years right before 2019Footnote4 and remained resilient through one of the worst crises in history, the COVID-19 pandemic, as a few countries had a positive rate of growth during the period of turbulence.Footnote5 The country also experienced a strong rebound, with a growth rate of 8% in the first year of the endemic period—the highest for the last three decades.Footnote6 While the growth rate is expected to slow to 6.3% in 2023 due to the pessimistic outlook of the global economy,Footnote7 the recent stock market decline has reduced valuations to extraordinarily appealing levels with a forward P/E ratio of 8.1 compared to the above-10 values of other emerging and frontier markets in the world.Footnote8 Furthermore, the market would also benefit from other macroeconomic factors, such as the depreciation of the US dollar relative to the domestic currency and China’s opening after lockdown, which would help increase capital flows to Vietnam’s stock market as well as the economy as a whole. Such a period of low valuation, with the support of macroeconomic conditions, opens up both advantageous and successful investment opportunities in the Vietnamese stock market, besides substantial diversification benefits for investors whose portfolios consist mainly of assets from developed markets.
In spite of its increasing importance and appeal over time, there are still significant obstacles to the development of Vietnam’s stock market, for instance, information flow and transparency,Footnote9 which has been referred as one of the main causes of herding (Bikhchandani et al., Citation1992). Indeed, herding in the Vietnamese stock market was well documented prior to the outbreak of COVID-19 (Vo & Phan, Citation2017). In addition, exogenous shocks are also proved to trigger herding among investors (Chiang & Zheng, Citation2010; Vo & Phan, Citation2017), and the COVID-19 pandemic is nothing more than an unexpected global one. As a result, there is a strong possibility that herding may occur among investors throughout this period of time, which is not without the cost. When private information is suppressed, the market may move toward inefficiency as the market price does not accurately reflect all the relevant fundamental information (Banerjee, Citation1992; Bikhchandani et al., Citation1992). In combination with uncertainty about the accuracy of information, herding may cause mispricing in asset prices, resulting in subsequent bubbles and crashes.
This study focuses on four main research questions. First, do herding exist in three Vietnamese stock markets pre-, during, and post-COVID-19? Based on the pioneering work of Christie and Huang (Citation1995) and Chang et al. (Citation2000), we investigate the occurrence of herding in three periods of three markets of different characteristics. We further explore whether herding, if it exists, is driven by common fundamental factors (spurious herding) or by the intent to imitate others' decisions among investors (intentional herding) based on the work of Galariotis et al. (Citation2015). Second, how does herding change under different levels of volatility? Gleason et al. (Citation2004) hypothesize that with the increase in volatility, the tendency to imitate would increase because investors feel more comfortable following the market consensus to achieve the average return of the market. Third, does a high level of pandemic uncertainty in Vietnam stimulate herding among investors, either intentional or spurious? We use the search volume-based measure of pandemic uncertainty to capture COVID-19 uncertainty (Chundakkadan & Nedumparambil, Citation2022). Finally, motivated by the work of Kizys et al. (Citation2020), the last question is whether the strictness of government response to COVID-19 mitigates herding. This question will be addressed by investigating whether the Oxford Government Response Stringency Index has any impact on the relation between the stock return dispersions and the squared term of market returns.
The remainder of the paper is organized as follows. Section 2 briefly presents the literature on herding and the tests for its presence. Sections 3 and 4 address the data and research methodology, while the findings and discussions are presented in Section 5. Section 6 provides a summary and discusses the implications of the findings.
2. Literature review
2.1. Herd behavior in financial markets
In finance and economics, the term “herding” or “herd behavior” refers to the act of economic agents imitating one another’s actions and/or basing their judgments on those of others (Spyrou, Citation2013). In a market setting, early studies often described herding as the effort by investors to suppress their own beliefs and copy the behavior of others (Avery & Zemsky, Citation1998; Bikhchandani & Sharma, Citation2000; Christie & Huang, Citation1995), causing them to trade in a collective manner (Nofsinger & Sias, Citation1999). Namely intentional herding, it could be the result of information cascades (Banerjee, Citation1992; Bikhchandani et al., Citation1992) or reputational reasons (Scharfstein & Stein, Citation1990).
Intentional herding should also be distinguished from another situation of spurious herding, where many investors make the same trading decisions simultaneously due to the change in fundamental factors (Bikhchandani & Sharma, Citation2000). Spurious herding may also occur among traders sharing some common characteristics, such as market experience, information set, and the way they process the information (Teh & De Bondt, Citation1997), their preferences to a specific kind of stocks (Falkenstein, Citation1996), or the regulations that they comply with (Voronkova & Bohl, Citation2005). Lastly, spurious herding could also result from style investing, in which traders buy the recent winners and dump those recent losers (De Long et al., Citation1990). Thus, similar decisions were made not because investors follow the previous actions intentionally, which is not herding according to the definition of herding discussed above.
Spurious herding is a favorable and efficient outcome since the change in asset prices simply reflects the movement of fundamentals, while intentional herding does not necessarily have those features (Bikhchandani & Sharma, Citation2000) and may lead to market inefficiency (Banerjee, Citation1992). Both spurious and intentional herding hence will be examined later in this study.
2.2. Herd behavior in worldwide financial markets during COVID-19
In the context of rare and unique events such as COVID-19, a growing literature has been spent on herding in the financial markets worldwide, especially in developed markets. Espinosa-Méndez et al. (Citation2020) examine herding on six European primary stock markets between January 2000 and June 2020 using Chang et al. (Citation2000) model. The result of the non-linearity test in different market conditions indicates that, generally, the COVID-19 pandemic amplified herding among investors. Fang et al. (Citation2021) conduct research in six Eastern European countries and find that during the pandemic, herding existed in almost five out of six countries except for Poland, and the degree of herding intensified over the pandemic. Bogdan et al. (Citation2022) compare herding in 15 European stock markets during COVID-19 based on Chang et al. (Citation2000) with static and rolling window methods. They find that herding existed during COVID-19 and was most pronounced in emerging markets, followed by frontier and developed markets. They then suggest lower liquidity and volatility in frontier markets that make herding to be less intensified than in emerging counterparts. Pochea (Citation2021) investigates herding toward the market consensus in European and US stock markets. He finds that the uncertainty triggered by the outbreak of COVID-19 amplified the observed herd behavior, and this behavior was driven by non-fundamental information. Strong evidence that high sentiments characterized herding and that ECB’s non-standard monetary policy announcement induced spurious and intentional herding is also found, while the Fed’s releases did not result in herding. Aslam et al. (Citation2021) analyze quarterly changes in herd behavior by quantifying the self-similarity intensity of six stock markets in Europe (UK, France, and Spain) and Asia (China, India, and Japan). Using a multifractal detrended fluctuation analysis (MFDFA) on intraday trade prices with a 15-min frequency from Jan-2020 to Dec-2020, they demonstrate that herd behavior in European markets was more evident than in Asian markets and was highly affected by COVID-19 waves.
Several studies have been conducted on other financial markets. Luu and Luong (Citation2020) apply CSAD and state space models to identify herd behavior across different industries during the pandemic (H1N1 and COVID-19) in Vietnam and Taiwan stock markets. Their results reveal that Taiwan stock market, an emerging market, was less sensitive to changes in the pandemic conditions than Vietnam market, which is a frontier market. They argue that the pandemic created anxiety from a health perspective and caused psychological instability for investors when investing in the market. Espinosa-Méndez and Arias (Citation2021) report that the pandemic increased herding by utilizing the method of Chang et al. (Citation2000) on a sample consisting of 90 listed firms from June 2008 to June 2020 in Australia. The effect of COVID-19 manifested in sessions with negative returns, higher volatility, and lower trading volume. Yuan (Citation2021) examines the herding effect in the Chinese A-share mainboard market using market and industry-level data and find that herding formation existed in the Chinese A-share market during the pre-pandemic period and became pronounced during the COVID-19. Herding was more evident in the down phase than the up phase, while shares of firms operating in transportation, leasing, business, and culture products experienced the most intensified herding effects during COVID-19 among those examined. Ghorbel et al. (Citation2022) present a study analyzing herd behavior in developed and BRICS stock market indices using a modified CSAD and the wavelet coherence (WC) analysis. They show that herding was present during all four waves of COVID-19 and was boosted by transaction volume and the number of deaths. Applying WC analysis, they report the presence of herding between China and developed and emerging stock markets, especially during the first wave of crisis, and between Indian and stock markets during the third wave.
3. Scope of study and data
3.1. Scope of study
The Vietnamese securities market was officially established in 2000. Two securities trading centers were founded in Ho Chi Minh in 2000 and Hanoi in 2005, later named the Ho Chi Minh Stock Exchange (HoSE) in 2007 and the Hanoi Stock Exchange (HNX) in 2009, respectively. A market for securities of unlisted public companies (UpCOM) was opened in HNX in June 2009. Table shows a comparison of stock markets in Vietnam as of 31 October 2022. A company must conduct an approved public offer of the shares to qualify for listing in either exchange, HoSE or HNX. Both exchanges also apply various listing criteria, including minimum capital requirements, required periods of profitable operation prior to listing, a minimum number of shareholders, and commitments by managers. In general, HoSE requirements are stricter than those of HNX. Both exchanges apply trading rules and restrictions, including trading price bands and minimizing price fluctuations. UpCOM is dealing with “over the counter” shares of unlisted public companies with looser regulations. This study investigates herd behavior in all three markets.
Table 1. Comparison of stock markets in Vietnam as of 31 October 2022
3.2. Data
The study uses stocks’ daily trading and book value data between 1 January 2018 and 31 October 2022 in three markets, including HoSE, HNX, and UpCOM. The daily trading data comprise the daily closing prices and trading volumes of all the stocks listed on three markets and corresponding market index data. All the trading data was gathered from FiinPro’s database, which provides the most comprehensive data about the Vietnamese financial market. Over the period, several stocks were prevented from trading or delisted, while some stocks were traded for the first time. As of 31 October 2022, the number of stocks made up main indices in each of the three stock markets is 323 in HoSE, 342 in HNX, and 798 in UpCOM. Due to the low attrition rate for each stock market, the sample of stocks is the list as of 31 October 2022.
In addition, the study used data on the Vietnamese government’s responses to COVID-19 in the Government Response Trackers. The Stringency Index is a composite measure based on nine response indicators, including school closures, workplace closures, cancellation of public events, restrictions on public gatherings, closures of public transport, stay-at-home requirements, public information campaigns, restrictions on internal movement, and international travel controls.Footnote10 The index is the daily mean score of nine metrics, each taking a value between 0 and 100 (the strictest). The research also uses Google Trends to measure pandemic uncertainty.
The analysis has been conducted for the complete sample and its subsamples corresponding to pre-COVID-19, during COVID-19, and the endemic period. The pre-pandemic sample is from January 2018 to 23 January 2020, as the first case of COVID-19 was confirmed in Vietnam. The COVID-19 period continued until the government considered COVID-19 as endemic on 5 March 2022 and the endemic sample includes trading day from 5 March 2022.
4. Research methodology
4.1. Detection of herding in Vietnam’s stock market
The first step in the methodology is testing for the presence of herding in different stock markets in Vietnam in three phases: pre-, during COVID-19 and endemic period. Two well-known models are used to detect herding in this research with some modifications: (i) cross-sectional standard deviation (CSSD) by Christie and Huang (Citation1995); (ii) cross-sectional absolute deviation return (CSAD) by Chang et al. (Citation2000).
Christie and Huang (Citation1995) model would first be implemented to search for evidence of herding during market stress periods with sharp movement in market price as follows:
The measure of return dispersion is calculated below:
where is the return of stock index i at time t,
is the return of the market capitalization-weighted index for market at time t, and N is the total number of stocks.
if the market return on day t lies in the extreme lower tail (1% and 5%) of the distribution, and equal to zero otherwise.
if the market return on day t lies in the extreme upper tail (1% and 5%) of the distribution, and equal to zero otherwise.
However, the model of Christie and Huang (Citation1995) has some inherent weaknesses related to how they link the presence of herding with the tail of the return distribution and ignore herding during normal market conditions, which can be overcome by using the method proposed by Chang et al. (Citation2000). Chang et al. (Citation2000) state that if herding exists, the returns of individual stocks would move closer to that of the overall market; thus, the dispersion may “increase at a decreasing rate” or even fall in case the herding is serious. The relationship is represented by the following specification:
The return dispersion is measured by the cross-sectional absolute deviation below:
Accordingly, a statistically significant and negative value of indicates the existence of herding, while a significantly positive one implies anti-herding. With such a form of function, the larger absolute value of return stands for the case that the market price moves more considerably, the return dispersion would fall more significantly, and herding would become more prevalent.
4.2. Spurious herding and intentional herding
We then go further to see if herding among investors in Vietnam's stock market was spurious or intentional. Based on the work of Galariotis et al. (Citation2015), we decompose the total CSAD into two components: (i) deviations due to reaction to common fundamental factors (spurious herding) and (ii) deviations due to non-fundamental information (intentional herding). First, the following regression is estimated:
In which is the risk-free rate,
is the equity market premium (the excess return of the market portfolio),
is the high-minus-low factor (the value premium),
is the small minus big factor (size premium), and
is the momentum factor. The residual from (3) is considered the cross-sectional deviations after removing the effect of fundamental information. In other words, it is a measure of crowding due to non-fundamental information, proxying for intentional herding. We denote the term
:
The deviation due to investors’ reaction to changes in fundamental information is , a proxy for spurious herding:
To test for the existence of spurious and intentional herding, we estimate the regression (2) but with and
as dependent variables:
A negative and statistically significant value of in Equationequation (4)
(4)
(4) implies spurious herding exists, while that in Equationequation (5)
(5)
(5) provides evidence for the presence of intentional counterparts. Regressions (2), (4), and (5) are also estimated for three markets for the whole sample period and each sub-period.
4.3. Herd behavior under different market conditions
Next, this paper investigates the relationship between volatility and herding in the markets in different COVID-19 periods. Two measures of historical daily volatility proposed by Parkinson (Citation1980) and Garman and Klass (Citation1980) are used. First, Parkinson’s measure incorporates the maximum and the minimum daily prices to reflect the movement of extreme price intraday variations:
in which and
were the high and low prices at day t.
Garman and Klass’s measures, in addition to maximum and minimum prices, incorporate opening and closing prices:
in which and
were the closing and opening prices at day t.
To examine the effect of market volatility on herding (including spurious and intentional herding), the following regression, based on Ferreruela and Mallor (Citation2021), is estimated for different markets in all and sub-periods:
in which if the daily market volatility is higher than the previous 30-day moving average value (Tan et al., Citation2008) and otherwise. The regression analysis is performed for two volatility measures as discussed above. If
and
are negative, herding exists in either market condition, while if
, the effects are more common on days of high volatility and otherwise.
4.4. Herd behavior under various levels of pandemic uncertainty and government strictness
COVID-19 and the response of government to contain it increased the fear of uncertainties among investors, affecting investment sentiments and decisions (Huynh et al., Citation2021). We then examine how the pandemic uncertainty and the strictness of government policies in battling the pandemic affect herding in three Vietnamese stock markets. For these purposes, two following functions are estimated for different markets in all and sub-periods:
is the logarithm of the Google Trends Search Volume Index of the word “coronavirus” and “COVID-19”, which measures pandemic fear or uncertainty or attention, interchangeably (Chundakkadan & Nedumparambil, Citation2022; Costola et al., Citation2021).
And in which is the Oxford Government Response Stringency Index. Unlike Kizys et al. (Citation2020), we try to find out whether strict government response to COVID-19 did mitigate herding in the market by testing if the change in Stringency Index results in a change in the coefficient of
instead of a change in the return dispersion measure. This is because it is not the return dispersions but the coefficient of
itself is the measure of herding (Chang et al., Citation2000).
5. Results and discussions
5.1. Detection of herding in Vietnam’s stock market
The descriptive statistics of daily market returns and two measures of daily return dispersion (CSSD and CSAD) of three markets are presented in Table . For the whole period under study, the return distributions of the three markets show dissimilarities. The mean of returns for HNX and UpCOM are 58 times and 29 times higher than that of HoSE, respectively. However, the medians, standard deviations, and range of returns do not show corresponding significant differences. Regarding asymmetry and kurtosis, the return distributions in the three markets are negatively skewed and platykurtic, with the medians significantly higher than the mean of returns. The daily return dispersions exhibit a higher deviation from market return in HNX and UpCOM than in HoSE in terms of mean, standard deviation, and range.
Table 2. Descriptive statistics for market return (Rm), CSSD, and CSAD series (HoSE, HNX, and UpCOM) for the whole period (from 1 January 2018 to 31 October 2022)
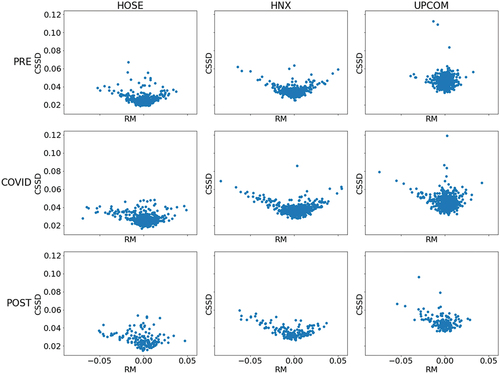
Figure presents the graphs of the relationship between CSSD and market return in three markets over three pandemic phases. According to Christie and Huang (Citation1995), investors tend to ignore their private information and turn to market consensus to make decisions as herding occurs. As a result, individual stock returns would cluster around the mean market return and return dispersions would fall considerably during a trading session with the presence of herding. Given that in the presence of herding, the ends of the graph should show a descending line, reflecting the lower CSSD at moments of extreme market movement. The graphs show that dispersion increases on extreme movement days, implying that herding does not seem to exist in either of the markets in three COVID-19 phases following the Christie and Huang (Citation1995) method.
Figure 1. Relationship between market return and CSSD in different periods.
The estimated results in Table also support the above argument that no evidence of herding in three stock markets in extreme movements can be found using the method by Christie and Huang (Citation1995). While Christie and Huang (Citation1995) suggested that the beta coefficients in EquationEquation (1)(1)
(1) should be negative and statistically significant to imply the presence of herding, those estimated in this study are either positive or non-significant for both criteria of extreme movements (1% and 5%) in the whole period as well as three subperiods.
Table 3. Estimates of herd behavior during market extreme movements with CSSD
We then turn to Chang et al. (Citation2000) approach for detecting herd behavior. Figure visualizes the relationship between the total CSAD and the average market return in three markets (complete samples and subsamples). The scatter point cloud for HoSE is flatter than those for HNX and UpCOM, showing lower dispersion for the same return level. Given the explanation by Chang et al. (Citation2000), this leads to anticipation that the intensity of herding is stronger in HoSE than in HNX and UpCOM.
Figure 2. Relationship between market return and CSAD in different periods.
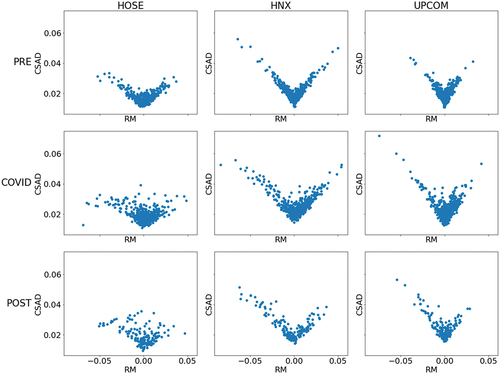
Table presents the estimated results of EquationEquation (2)(2)
(2) . As discussed above, the presence of herding is proved if the estimated coefficient of
is negative and statistically significant. It is clear that all the values of that coefficient are negative and significant for the whole sample and all three subsamples of both HoSE and HNX, suggesting that herding occurred in all examined timeframes. However, the evidence of herding in UpCOM is rather weak and only significant before the pandemic. This is in contrast with the presence of herding in HoSE and HNX, which is more pronounced during and after the COVID-19 than in the pre-pandemic period.
Table 4. Estimates of herd behavior by non-linearity test between total CSAD and market returns
5.2. Herding in Vietnam’s stock market—spurious vs. intentional herding
Aware of the presence of herding among the three markets, we further study whether herding among Vietnamese investors is intentional or rather spurious by dividing the return dispersion into two components, as suggested by Galariotis et al. (Citation2015). Table illustrates the estimation of EquationEquations (4)(4)
(4) and (5) for detecting spurious and intentional herding. For both equations, the coefficient of
is expected to be negative and significant, indicating that either type of herding does exist. The results reported in Panel A show that the estimated values for the mentioned coefficient are positive in every case, implying that there is no sign of spurious herding in any of the three stock markets, neither for the whole period nor for the sub-periods under study. This claim is further supported by the robust linear relationship between the market return and the fundamental dispersion for all three markets in different periods, as shown in Figure .
Figure 3. Relationship between market return and fundamental CSAD in different periods.
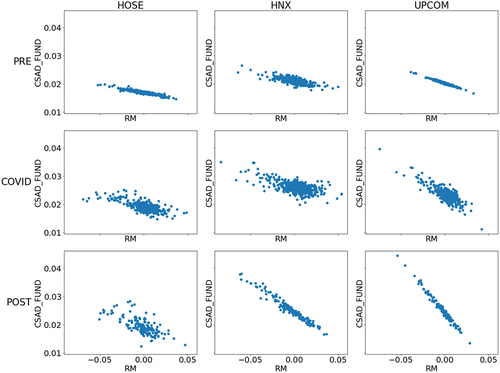
Table 5. Estimates of herd behavior by non-linearity test between decomposed components of CSAD and market returns
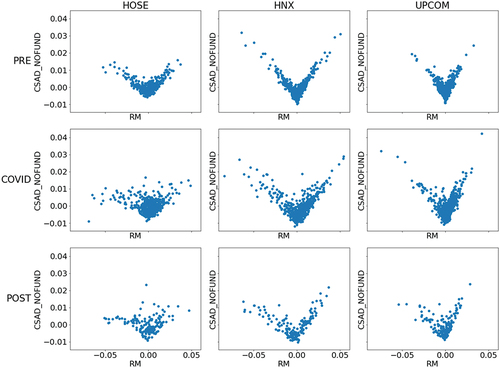
The results in Panel B, on the other hand, provide compelling evidence of intentional herding for either of the three markets in all periods under study. Surprisingly, all the estimated coefficients of are negative and statistically significant for all the samples of three markets, showing that intentional herding is present in all three examined markets regardless of period. Intentional herding was more intense in the OTC market than in two exchanges in the pre- and post-pandemic periods, while it was prevalent the most in HoSE during the pandemic. The intensity of intentional herding tends to increase over time in HoSE and HNX, while it suddenly fell during the pandemic and then rose back in the following period in UpCOM. These non-linear relationships between non-fundamental CSAD and market return are presented in Figure .
Figure 4. Relationship between market return and non-fundamental CSAD in different periods.
Overall, our analysis indicates that herding—the convergence in investment decisions among investors—in Vietnamese stock market is due to the intent to imitate the actions of others instead of the shared reaction to the changes in fundamentals. Our findings here, unsurprisingly, are consistent with the observed facts in the stock markets. During the COVID-19 pandemic, there was an enormous number of new investors joining the market. The number of newly opened domestic accounts recorded by the Vietnam Securities Depository increased over time and even reached more than 100,000 accounts per month in 2021, despite consecutive outbreaks and mass lockdowns in major cities.Footnote11 Surprisingly, although the Vietnamese government considered COVID-19 endemic and would move towards “normalizing” COVID-19 in March 2022, and stock markets have gone through half of 2022 with turbulence and remarkable events, the number of newly opened retail accounts in the first five months of this year was nearly equal to that of the whole of 2021.Footnote12 However, it is observed that many of them were lured into groups in which they were said to receive “advices and news” that would help them “certainly earn substantial profit”. Being convinced of what had been told, they often based their decisions on the information informed among groups that they were participating in, on the advice of others or even on the rumors that were spread by the market manipulators.Footnote13 This definitely leads to the presence of intentional herding among investors in the market instead of spurious one.
In addition, the existence of intentional herding may be partially attributable to the movements of the market during the pandemic and the way investors reacted to those changes. It is clear that the market had undergone a lot of ups and downs during the crisis, but in the meantime, the index also had broken its own records several times and trading activities had soared compared to the prior periodFootnote14,Footnote15 Investors, observing the unusually high return of the market, may develop fear-of-missing-out in anticipation of some specific stocks and try to mimic the decisions of the previous winners in the hope that they could gain that high return. Shleifer & Summers (Citation1990) suggested that, in some situations, changes in demand for assets and shifts in market sentiment may be investors’ responses to some pseudo-signals (in this case, abnormal returns and oddly trading intensity) rather than rational and fundamentally justified decisions. This effect would be stronger in frontier markets, which, according to Andrikopoulos et al. (Citation2016), are relatively illiquid and nontransparent, have low levels of regulation, and are subject to considerable political and economic risk. Especially in the case of Vietnam in 2021, only half of the listed companies in both HNX and HSX fully complied with the information disclosure regulations.Footnote16 The absence of precise fundamental information (and possibly the ability to interpret information) may cause investors to act on others' information and signals, thus increasing the intensity of herding. Investors follow a trend, and rational arbitrageurs amplify the effect of herd buying on an undervalued stock. Those arbitrageurs’ actions make the price go higher and further from its fundamental value. The increasing price, in this case, is a false signal of a good investment that attracts more irrational investors to buy the asset, while the arbitrageurs have time to exit to realize their profits. Once herding occurs, investors behave like lemmings, ignore their private information and analysis, and follow others’ actions blindly. This creates a spiral of irrational herding.
Besides, the high degree of trade openness,Footnote17 which makes the Vietnamese economy itself vulnerable to either global or regional shocks, may also contribute to the change in the intensity of herding. This is because such a great shock as the severe COVID-19 pandemic would materially affect the macroeconomic environment and substantially raise uncertainty about fundamentals, potentially triggering the fear instinct of investors and raising their intent to mimic other trading decisions.
Lastly, the fact that herding was more pronounced in the sample of HoSE than the others may result from the more intense trading activities in the corresponding exchange compared to the other two, which provides a more ideal condition for the occurrence of herding. As of 31 October 2022 (at the end of the last period in this study), the total market capitalization of HoSE was nearly $175 billion worth, which was about 16 and 4.17 times larger than that of HNX and UpCOM, respectively.Footnote18 The average daily turnover of HoSE was around $415 million between 1 January 2018 and 31 October 2022,Footnote19 which was also 7.56 and 13.58 times higher than that of HNX and UpCOM, while the average daily trading volume of HoSE was about 392 million of shares during the same period, which was 5.29 and 9.54 times larger compared to HNX and UpCOM, respectively. In addition, during the COVID-19 period, the return of HoSE was the highest among those mentioned, which was quite well known at that time. Since the COVID-19 pandemic resulted in the disruption in economic activities, a new line of investors, whose purpose was to find another source of income to make up for the loss due to the pandemic, was created.
5.3. Herding under different market conditions: high vs. normal volatility
Table provides the estimated results for Equation (6) with the two different volatility measures. Regarding the overall herding, evidence of herding in the whole period is confirmed for all three exchanges as at least one among the two coefficients and
was negative and statistically significant. We also confirm the occurrence of herding in HoSE during and after the pandemic as well as during the pre-pandemic for the others. The Wald test for the estimation results with Parkinson’s volatility measure shows that
is smaller than
, indicating that herding is more significant on days with high volatility in HoSE. However, the Wald test for the estimated results with Garman and Klass’ measure cannot confirm this statement.
Table 6. Estimates of herd behavior on days of high volatility by non-linearity test between total CSAD and market returns
We further decompose the CSAD into two components as in the previous section to see whether two types of herding were associated with market volatility. The results in Table reconfirm no evidence of spurious herding in HoSE could be found using both methods; however, we found strong evidence of spurious herding in UpCOM in the whole period as well as in the pre- and post-COVID-19 period during low volatility day. In addition, we also find evidence of spurious in low volatility trading day before the outbreak of the pandemic.
Table 7. Estimates of herd behavior on days of high volatility by non-linearity test between fundamental CSAD and market returns
Table illustrates the correlation of market volatility on intentional herding. For both methods, we do not find strong enough evidence about the relationship between high volatility and intentional herding in HoSE. However, based on the Parkinson’s measure, we find evidence of correlation between high volatility and intentional herding in HNX and UpCOM for all examined timeframes, while using the Garman and Klass’s measure only provides the same evidence for UpCOM. These results, in combination with those from Table , are quite in line with the definition of intentional and spurious herding. That is, as spurious herding is the way that investors reflect to the change in fundamentals and would not drive the asset prices away from their intrinsic value, there should not be extreme movement of asset prices in those trading days, resulting in a medium or low level of volatility. In contrast, as intentional herding occurs, a large number of investors would try to mimic others in buying or selling off some specific stocks, causing the prices of those assets to move significantly from the current price in a relatively short period of time and resulting in a higher level of volatility.
Table 8. Estimates of herd behavior on days of high volatility by non-linearity test between non-fundamental CSAD and market returns
Table 9. Estimates of the impact of pandemic uncertainty and government response strictness on herd behavior
Those results are also similar to the findings of some previous studies, for example, those of Fang et al. (Citation2021) and Ferreruela and Mallor (Citation2021). Ferreruela and Mallor (Citation2021) suggested that this phenomenon could result from a cognitive bias called loss aversion, in which investors tend to avoid losses over seeking equivalent profit. In the context of the pandemic, as most people suffered from a drop in their income due to the disruption in economic activities, this kind of bias might have become stronger among investors, especially those who were new to the market for an alternative source of income. As a result, they took the market volatility as a signal, herding in or out on every single occasion they noticed the market volatility behaves in an unusual way.
5.4. Herding under different levels of pandemic uncertainty and strictness of government response
Table , panel A, shows estimates for Equation (7) during the pandemic. The coefficient is expected to be statistically significant if herding was affected by the pandemic uncertainty. However, all the estimated values of
are insignificant in three markets for three measures of dispersions. Therefore, evidence on the relationship between pandemic uncertainty and herd behavior is not found in Vietnam’s stock markets, although several studies have confirmed their impact on stock market returns (Chundakkadan & Nedumparambil, Citation2022; Costola et al., Citation2021).
Table , panel B, shows estimates for Equation (8) during the pandemic. Similar to the expectation with Equation (7), the coefficient is also expected to be statistically significant to show that the strictness in response of government may have some effects on herding; however, all of the estimated values are insignificant in every scenario. Hence, unlike Kizys et al. (Citation2020) and Pochea (Citation2021), with the sample in Vietnam, we find neither the government’s strict response to COVID-19 nor the uncertainty triggered by the pandemic had affected the intensity of herding. A possible explanation for those findings is that most of the investors in Vietnam’s market did not pay enough attention to or did not even consider both of those mentioned factors, as sources of fundamental regarding their investments.
6. Conclusions
This study investigates herd behavior in frontier Vietnamese stock markets, including the OTC (UpCOM) and two listed stock exchanges (HNX and HoSE), under the impacts of COVID-19. Firstly, we find that herding does not exist in the three stock markets in extreme movements but in normal market conditions, which suggests the divergence in investors’ decisions in large jumps of the markets. Secondly, Intentional herding was dominant in the three markets for all periods under study, and herding is more severe in two stock exchanges, HoSE and HNX, than in the OTC market UpCOM. Thirdly, we find strong evidence of significant intentional herding on days of high volatility in UpCOM and HNX for all the timeframes, while considerable spurious herding on days with low volatility is found in UpCOM and HNX for all the examined periods except for the pandemic one. The evidence that herding was more pronounced during high volatility days in HoSE was relatively weak overall. Finally, we find no effect of pandemic uncertainty or government responses to the pandemic on heightening or mitigating herd behavior, respectively.
Besides its contribution to the current understanding of herd behavior during and post-pandemic and the drivers behind this tendency, this study may have several practical implications. Vietnamese regulators should promote listed companies’ information disclosure by stipulating clearly and specifically the requirements for information disclosure in legal documents. Penalties for information disclosure violations must be raised. And it is necessary to issue additional sanctions such as banning transactions and restricting activities in the security sector. The authorities also have to closely monitor activities in the market as well as cash flow trends, thereby proactively warning investors in a timely manner and implementing reasonable measures in case there would be the presence of a “bubble” in the market. In addition, the new investors need to acquire more knowledge about the market and skills for investing, so they can confidently make their decisions based on their own analysis instead of that of someone else.
Finally, this study also suggests several directions for future research based on its limitations due to its nature: (i) we only applied models that are said to be “static” for the detection of herding. As a result, the dynamic aspects of herding, such as structural breaks and regime changes, could not be captured in the study. It will be better to adopt more other herding detection methods such as Hwang and Salmon (Citation2001)’s model on the measurement of herding magnitude or Balcilar et al. (Citation2012) Markov-switching model. (ii) The subsample for the endemic period only consists of trading data for around 8 months. Therefore, expanding the sample will be a potential method to fully capture the characteristics of this period. (iii) while testing for the impact of pandemic uncertainty and government response, we found that both factors did not affect the magnitude of herding; however, the explanation for those findings is left relatively open. Further research should be conducted to bridge those gaps.
Acknowledgments
We are grateful to the Editorial Office and the anonymous referee for helpful comments and suggestions. This research is funded by the National Economics University, Hanoi, Vietnam [Grant number 1204/QÐ-ÐHKTQD].
Disclosure statement
No potential conflict of interest was reported by the author(s).
Additional information
Funding
Notes on contributors
Hong Mai Phan
Hong Mai Phan held a PhD in Finance and Banking from National Economics University in 2012. Phan has been affiliated with National Economics University as a Lecturer and Researcher for 17 years. Her research interests lay in banking, private sector development, corporate finance, and emerging markets issues.
Thi Nhu Quynh Le
Thi Nhu Quynh Le is a quantitative analysis specialist at Vietcombank, Vietnam. Her research interests lay in risk management, corporate finance, and digital finance.
Vu Duc Hieu Dam
Vu Duc Hieu Dam is currently employed as a R&D Associate at the Trading Department of the Mercantile Exchange of Vietnam. He earned his BA in Finance and Banking from the National Economics University in 2022. His research interests include investment decisions, information, and efficiency in financial markets.
Manh Son Tran
Manh Son Tran is currently studying at Knox College, IL, USA. His work focuses on applied mathematics and data science-related fields such as probability theory, numerical optimization, mathematical statistics, and deep learning.
Thi Hoai Linh Truong
Thi Hoai Linh Truong is a PhD in Banking and Finance at National Economics University. Truong is currently a Lecturer and Researcher at National Economics University. Her research areas focus on banking, micro-finance, and emerging market issues.
Quoc Anh Le
Quoc Anh Le is a Lecturer and Researcher at the School of Banking and Finance, National Economics University. His main research areas are corporate finance and macro-finance.
Notes
1. Frontier Market (wallstreetmojo.com).
2. A New Frontier in Vietnam (ukinvestormagazine.co.uk).
3. MSCI Frontier Markets Asia Index (msci.com).
4. Vietnam’s Economy Expanded by 6.8 Percent in 2019 but Reforms are Needed to Unleash the Potential of Capital Markets (worldbank.org).
5. Vietnam: Successfully Navigating the Pandemic (imf.org).
6. Vietnam 2022 GDP Growth Quickens to 8.02%, Fastest since 1997 (reuters.com).
7. Taking Stock: Vietnam Economic Update, March 2023 (worldbank.org).
8. Asia Frontier Capital (AFC) Vietnam Fund Market—November 2022 Update (asiafrontiercapital.com).
9. Why is it Risky to Invest in Vietnam’s Stock Market (febis.org).
10. Edouard Mathieu, Hannah Ritchie, Lucas Rodés-Guirao, Cameron Appel, Charlie Giattino, Joe Hasell, Bobbie Macdonald, Saloni Dattani, Diana Beltekian, Esteban Ortiz-Ospina, and Max Roser (2020)—“COVID-19 – Stringency Index”. Published online at OurWorldInData.org. Retrieved from: “https://ourworldindata.org/covid-stringency-index” [Online Resource]
11. The Number of Trading Accounts of Domestic and Foreign Investors (vsd.vn).
12. Stock Market Faces Bumpy Ride in Second Half of 2022 (vietnamnews.vn).
13. Hot online groups to invest in securities be careful to be “twisted around” (vietnam.postsen.com).
14. Vietnam Stock markets 2020: a rollercoaster year that ends happily (e.vnexpress.net).
15. Vietnam’s stock market sets historic record in 2021 (vietnamnet.vn).
16. More than half of listed companies comply with information disclosure norms (bizhub.vn).
17. Vietnam Ranks 5th in Economic Openness in Asia: Fitch (e.vnexpress.net).
18. Market Capitalization of Stock Market until 3.2023 (ssc.gov.vn).
19. Average Trading Value 3.2023 (ssc.gov.vn).
References
- Altig, D., Baker, S., Barrero, J. M., Bloom, N., Bunn, P., Chen, S., Davis, S. J., Leather, J., Meyer, B., Mihaylov, E., Mizen, P., Parker, N., Renault, T., Smietanka, P., & Thwaites, G. (2020). Economic uncertainty before and during the COVID-19 pandemic. Journal of Public Economics, 191, 104274. https://doi.org/10.1016/j.jpubeco.2020.104274
- Andrikopoulos, P., Niklewski, J., & Rodgers, T. (2016). Chapter 9 - the portfolio diversification benefits of frontier markets: An investigation into regional effects. In Handbook of frontier markets (pp. 163–25). Academic Press. https://doi.org/10.1016/B978-0-12-809200-2.00009-9
- Aslam, F., Ferreira, P., Ali, H., & Kauser, S. (2021). Herding behavior during the COVID-19 pandemic: A comparison between Asian and European stock markets based on intraday multifractality. Eurasian Economic Review, 12(2), 333–359. https://doi.org/10.1007/s40822-021-00191-4
- Avery, C., & Zemsky, P. (1998). Multidimensional uncertainty and herd behavior in financial markets. American Economic Review, 88(4), 724–748.
- Balcilar M., Demirer, R., & Hammoudeh, S. M. Market regimes and herding behaviour in Chinese A and B shares. SSRN Journal. https://doi.org/10.2139/ssrn.2150300
- Banerjee, A. V. (1992). A simple model of herd behavior. The Quarterly Journal of Economics, 107(3), 797–817. https://doi.org/10.2307/2118364
- Bikhchandani, S., Hirshleifer, D., & Welch, I. (1992). A theory of fads, fashion, custom, and cultural change as informational cascades. Journal of Political Economy, 100(5), 992–1026. https://doi.org/10.1086/261849
- Bikhchandani, S., & Sharma, S. (2000). Herd behavior in financial markets: A Review. IMF Economic Review, 47(3), 297–310. https://doi.org/10.2307/3867650
- Bogdan, S., Suštar, N., & Draženović, B. O. (2022). Herding behavior in developed, emerging, and frontier European stock markets during COVID-19 pandemic. Journal of Risk and Financial Management, 15(9), 400. https://doi.org/10.3390/jrfm15090400
- Bouri, E., Demirer, R., Gupta, R., & Nel, J. (2020). COVID-19 pandemic and investor herding in international stock markets. Risks, 9(9), 168. https://doi.org/10.3390/risks9090168
- Carlsson-Szlezak, P., Reeves, M., & Swartz, P. (2020). What coronavirus could mean for the global economy. Harvard Business Review, 3(10), 1–10. https://hbr.org/2020/03/what-coronavirus-could-mean-for-the-global-economy
- Chang, E. C., Cheng, J. W., & Khorana, A. (2000). An examination of herd behavior in equity markets: An international perspective. Journal of Banking & Finance, 24(10), 1651–1679. https://doi.org/10.1016/S0378-4266(99)00096-5
- Chiang, T. C., & Zheng, D. (2010). An empirical analysis of herd behavior in global stock markets. Journal of Banking and Finance, 34(8), 1911–1921. https://doi.org/10.1016/j.jbankfin.2009.12.014
- Christie, W. G., & Huang, R. D. (1995). Following the Pied Piper: Do individual returns herd around the market? Financial Analysts Journal, 51(4), 31–37. https://doi.org/10.2469/faj.v51.n4.1918
- Chundakkadan, R., & Nedumparambil, E. (2022). In search of COVID-19 and stock market behavior. Global Finance Journal, 54, 100639. https://doi.org/10.1016/j.gfj.2021.100639
- Costola, M., Iacopini, M., & Santagiustina, C. R. (2021). Google search volumes and the financial markets during the COVID-19 outbreak. Finance Research Letters, 42, 101884. https://doi.org/10.1016/j.frl.2020.101884
- Dash, S. R., & Maitra, D. (2022). The COVID-19 pandemic uncertainty, investor sentiment, and global equity markets: Evidence from the time-frequency co-movements. The North American Journal of Economics & Finance, 62, 101712. https://doi.org/10.1016/j.najef.2022.101712
- De Long, J. B., Shleifer, A., Summers, L. H., & Waldmann, R. J. (1990). Noise Trader risk in financial markets. Journal of Political Economy, 98(4), 703–738. https://doi.org/10.1086/261703
- Espinosa-Méndez, C., & Arias, J. (2021). COVID-19 effect on herding behaviour in European capital markets. Finance Research Letters, 38, 101787. https://doi.org/10.1016/j.frl.2020.101787
- Espinosa-Méndez, C., Arias, J., & Arias, J. (2020). Herding behaviour in Asutralian stock market: Evidence on COVID-19 effect. Applied Economics Letters, 28(21), 1898–1901. https://doi.org/10.1080/13504851.2020.1854659
- Falkenstein, E. G. (1996). Preferences for stock characteristics as revealed by mutual fund portfolio holdings. The Journal of Finance, 51(1), 111–135. https://doi.org/10.1111/j.1540-6261.1996.tb05204.x
- Fang, H., Chung, C.-P., Lee, Y.-H., & Yang, X. (2021). The effect of COVID-19 on herding behavior in eastern European stock markets. Frontiers in Public Health, 9. https://doi.org/10.3389/fpubh.2021.695931
- Ferreruela, S., & Mallor, T. (2021). Herding in the bad times: The 2008 and COVID-19 crises. The North American Journal of Economics & Finance, 58, 101531. https://doi.org/10.1016/j.najef.2021.101531
- Galariotis, E. C., Rong, W., & Spyrou, S. I. (2015). Herding on fundamental information: A comparative study. Journal of Banking & Finance, 50, 589–598. https://doi.org/10.1016/j.jbankfin.2014.03.014
- Garman, M. B., & Klass, M. J. (1980). On the estimation of Security price Volatilities from historical data. The Journal of Business, 53(1), 67–78. https://doi.org/10.1086/296072
- Ghorbel, A., Snene, Y., & Frikha, W. (2022). Does herding behavior explain the contagion of the COVID-19 crisis? Review of Behavioral Finance. https://doi.org/10.1108/rbf-12-2021-0263
- Gleason, K. C., Mathur, I., & Peterson, M. A. (2004). Analysis of intraday herding behavior among the sector ETFs. Journal of Empirical Finance, 11(5), 681–694. https://doi.org/10.1016/j.jempfin.2003.06.003
- Hott, C. (2009). Herding behavior in asset markets. Journal of Financial Stability, 5(1), 35–56. https://doi.org/10.1016/j.jfs.2008.01.004
- Huynh, T. L. D., Foglia, M., Nasir, M. A., & Angelini, E. (2021). Feverish sentiment and global equity markets during the COVID-19 pandemic. Journal of Economic Behavior & Organization, 188, 1088–1108. https://doi.org/10.1016/j.jebo.2021.06.016
- Hwang, S., & Salmon, M. H. (2001). A new measure of herding and empirical evidence. https://wrap.warwick.ac.uk/1816/1/WRAP_Hwang_fwp01-12.pdf
- Kizys, R., Tzouvanas, P., & Donadelli, M. (2020). From COVID-19 herd immunity to investor herding in international stock markets: The role of government and regulatory restrictions. International Review of Financial Analysis, 74, 101663. https://doi.org/10.1016/j.irfa.2021.101663
- Luu, Q. T., & Luong, H. T. T. (2020). Herding behavior in emerging and frontier stock markets during pandemic influenza panics. The Journal of Asian Finance, Economics & Business, 7(9), 147–158. https://doi.org/10.13106/jafeb.2020.vol7.no9.147
- Moran K., Stevanovic, D., & Touré, A. K. (2022). Macroeconomic uncertainty and the COVID‐19 pandemic: Measure and impacts on the Canadian economy. Canadian Journal of Economics, 55(S1), 379–405. https://doi.org/10.1111/caje.12551
- Nofsinger, J. R., & Sias, R. W. (1999). Herding and feedback trading by institutional and individual investors. The Journal of Finance, 54(6), 2263–2295. https://doi.org/10.1111/0022-1082.00188
- Parkinson, M. (1980). The extreme value method for estimating the variance of the rate of return. The Journal of Business, 53(1), 61–65. https://doi.org/10.1086/296071
- Pochea, M. (2021). Intentional and spurious herding during unconventional events and high sentiments. Social Science Research Network. https://doi.org/10.2139/ssrn.3948847
- Scharfstein, D. S., & Stein, J. C. (1990). Herd behavior and investment. The American Economic Review, 80(3), 465–479.
- Shleifer A., & Summers, L. H. (1990). The Noise Trader Approach to Finance. Journal of Economic Perspectives, 4(2), 19–33. https://doi.org/10.1257/jep.4.2.19
- Spiru, A., & Qin, Z. (2016). Investing on the edge: Exploring the opportunities for diversification in frontier markets. In Handbook of frontier markets (pp. 123–162). Elsevier.
- Spyrou, S. (2013). Herding in financial markets: A review of the literature. Review of Behavioral Finance, 5(2), 175–194. https://doi.org/10.1108/RBF-02-2013-0009
- Tan, L., Chiang, T. C., Mason, J. R., & Nelling, E. (2008). Shares, herding behavior in Chinese stock markets: An examination of a and B. Pacific-Basin Finance Journal, 16(1–2), 61–77. https://doi.org/10.1016/j.pacfin.2007.04.004
- Teh, L. L., & De Bondt, W. F. (1997). Herding behavior and stock returns: An exploratory investigation. Swiss Journal of Economics and Statistics, 133(2), 293–324.
- Vo, X. V., & Phan, D. B. A. (2017). Further evidence on the herd behavior in Vietnam stock market. Journal of Behavioral and Experimental Finance, 13, 33–41. https://doi.org/10.1016/j.jbef.2017.02.003
- Voronkova, S., & Bohl, M. T. (2005). Institutional traders’ behaviour in an emerging stock market: Empirical evidence on Polish pension fund investors. Journal of Business, Finance and Accounting, 32(7&8), 1537–1560. https://doi.org/10.1111/j.0306-686X.2005.00639.x
- Yuan, H. (2021). Herding effect in China’s a share stock market under COVID-19 pandemic. ICEBA 2021: 2021 7th International Conference on E-Business and Applications. https://doi.org/10.1145/3457640.3457662.