
 ?Mathematical formulae have been encoded as MathML and are displayed in this HTML version using MathJax in order to improve their display. Uncheck the box to turn MathJax off. This feature requires Javascript. Click on a formula to zoom.
Abstract
This paper aims to address the relatively limited attention given to the examination of exchange rate misalignment uncertainty in the specific context of South Africa. By specifically focusing on exchange rate misalignment uncertainty, this study fills a crucial gap in the literature and gains a deeper understanding of the factors influencing economic growth in South Africa. While previous literature has provided valuable insights into the relationship between exchange rate uncertainty and economic growth, there is a dearth of studies focusing on the particular issue of exchange rate misalignment uncertainty in South Africa. Therefore, the objective of this research is to investigate the effects of exchange rate misalignment uncertainty on short-term and long-term economic growth in South Africa. To achieve this objective, we employ the generalized autoregressive conditional heteroskedasticity (GARCH) and vector error correction (VEC) models. The analysis utilizes quarterly data spanning from the first quarter of 1960 to the third quarter of 2022. The findings of this study reveal a negative association between exchange rate uncertainty and short-term economic growth, while the long-term effects yield mixed results. Moreover, we observe that higher exchange rate misalignment is linked to positive implications for economic growth. These findings emphasize the significance of managing exchange rate volatility and reducing uncertainty to ensure economic stability and foster long-term growth. Considering these findings, policymakers should prioritize implementing strategies that promote a stable exchange rate and cultivate a favorable business environment.
1. Introduction
The relationship between exchange rate volatility, misalignment, and economic growth is a topic of significant interest and debate in economic research. Both exchange rate volatility and misalignment can have important implications for a country’s economic performance, including its overall growth prospects Ybrayev (Citation2021). High levels of volatility can introduce uncertainty and risk into economic activities, affecting investment decisions, trade flows, and overall economic stability. When exchange rates are highly volatile, businesses and investors may face challenges in planning and making long-term commitments, potentially leading to reduced investment and slower economic growth Giordano (Citation2022). In 1961, the Rand replaced Pound Sterling as the legal tender in South Africa, with an initial exchange rate of R0.72 to the US dollar (SARB, Citation2023a). Throughout the 1960s and 1970s, the Rand remained relatively stable against the US dollar, reaching a high exchange rate of R1.40 during that period (Mboweni, Citation2001). However, the political instability and opposition from international institutions against the apartheid system in the 1980s caused significant exchange rate volatility and rapid depreciation of the Rand (Mboweni, Citation2001). By 1994, the Rand had depreciated to R3.48 against the US dollar, representing a depreciation of 483.33% over the past 33 years (SARB, Citation2023b). This exchange rate volatility posed a significant threat to foreign government debt in South Africa, as the depreciating rand increased the cost of servicing debt denominated in foreign currencies. Moreover, as the rand weakened against foreign currencies, it became more expensive for the South African government to meet its debt obligations (Mohanty, Citation2013).
After 1994, the exchange rate continued to exhibit volatility, with a weak range of R6 to R13.00 against the US dollar between 2000 and 2007 (SARB, Citation2023a). This volatility created challenges for the South African government, as a larger portion of its budget had to be allocated to debt servicing if the debt serving increased this affected funds available for crucial areas such as infrastructure development, social welfare, and education (Onwuka & Obi, Citation2014). In addition to exchange rate fluctuations, other factors, such as sociopolitical unrest and energy issues, including load shedding that began in 2007, further impacted the debt and exchange situation in South Africa. These issues led to significant problems in the mining and telecommunications sectors, resulting in production cuts and mine closures. The global financial crisis of 2008 to 2009 also had a notable impact on exchange rate volatility in South Africa. Furthermore, the outbreak of the COVID-19 pandemic significantly affected the exchange rate and debt levels in the country, adding to the existing challenges (Iyke & Ho, Citation2021). These developments highlight the vulnerability of the South African economy to external shocks and the importance of maintaining stability in the exchange rate.
Despite the extensive research conducted on exchange rate volatility and misalignment and their implications for economic growth, a significant gap remains in the literature regarding the investigation of exchange rate velocity or uncertainty about economic growth. Existing studies have predominantly focused on examining the effects of volatility and misalignment alone, neglecting the specific impact of exchange rate velocity or uncertainty Ramos-Herrera and Sosvilla-Rivero (Citation2023). Several studies have contributed to the understanding of exchange rate dynamics and their effects on economic growth in various regions. For instance, Ehigiamusoe and Lean (Citation2019) conducted research in the West African region, while Adeniyi and Olasunkanmi (Citation2019) focused on Nigeria. Additionally, Hadhek et al. (Citation2019) explored exchange rate variability in Tunisia. However, these studies Ehigiamusoe and Lean (Citation2019), Adeniyi and Olasunkanmi (Citation2019), and Hadhek et al. (Citation2019) did not specifically investigate the implications of exchange rate velocity or uncertainty.
To address this research gap, the current paper aims to examine the heterogeneous relationship between exchange rate velocity or uncertainty and the per capita economic growth rate. By considering the moderating effects of the real exchange rate and its volatility, the paper seeks to provide a comprehensive understanding of the finance-growth nexus. Furthermore, the research aims to identify variations in these dynamics across different income categories and country types, such as advanced economies, low-income developing countries, and emerging economies. By investigating exchange rate velocity or uncertainty in South Africa, this paper intends to shed light on an aspect of exchange rate dynamics that has not received sufficient attention in the literature. Given the context above, this paper addressed the significant gap in understanding the relationship between exchange rate uncertainty, misalignment, and economic growth in the context of South Africa. The paper research questions investigated are as follows: what is the impact of exchange rate uncertainty on short-run and long-run economic growth? How does exchange rate misalignment affect economic growth? What are the policy implications for managing exchange rate volatility and misalignments in South Africa? Given the questions of this paper, the hypotheses are as follows:
Hypothesis 1
Null: There is no significant relationship between the exchange rate and economic growth.
Alt: There is a significant relationship between the exchange rate and economic growth.
Hypothesis 2
Null: The relationship between exchange rate uncertainty and economic growth is not statistically significant.
Alt: The relationship between exchange rate uncertainty and economic growth is statistically significant.
Hypothesis 3
Null: Exchange rate misalignment uncertainty, assessed using the fundamental approach, does not significantly affect economic growth.
Alt: Exchange rate misalignment uncertainty, assessed using the fundamental approach, does significantly affect economic growth.
Hypothesis 4
Null: Exchange rate misalignment uncertainty using the hp-filter approach has no impact on economic growth.
Alt: Exchange rate misalignment uncertainty using the hp-filter approach has an impact on economic growth.
The significance and contributionFootnote1 of this paper lie in several key areas. First, it addresses a significant gap in the literature by investigating the impact of exchange rate velocity or uncertainty on economic growth. While previous studies have extensively examined exchange rate volatility and misalignment, the specific role of exchange rate velocity or uncertainty has been largely overlooked, including Okoro and Charles (Citation2019), Ribeiro et al. (Citation2020), Morina et al. (Citation2020), and Cuestas (Citation2020), among others. By focusing on this aspect, the paper provides a novel perspective on the dynamics of exchange rates and their implications for economic growth. Second, the paper contributes to the existing body of knowledge by offering a comprehensive understanding of the finance-growth nexus. By considering the moderating effects of the real exchange rate and its volatility, the research goes beyond a simplistic analysis of the relationship between exchange rate velocity or uncertainty and economic growth. This approach provides a more nuanced and realistic assessment of how exchange rate dynamics interact with economic performance, thus enhancing our understanding of the complex dynamics within the finance-growth nexus. Furthermore, the paper aims to identify variations in these dynamics across different income categories and country types. By examining the impact of exchange rate velocity or uncertainty on economic growth in various contexts, such as advanced economies, low-income developing countries, and emerging economies, the research uncovers potential heterogeneity in the relationship. However, these studies Ehigiamusoe and Lean (Citation2019), Adeniyi and Olasunkanmi (Citation2019), and Hadhek et al. (Citation2019) did not specifically investigate the implications of exchange rate velocity or uncertainty. This analysis contributes to a more comprehensive understanding of the nuanced dynamics between exchange rates and economic growth, accounting for diverse economic conditions and policy environments.
Moreover, the paper’s focus on South Africa adds specific value to the literature. By investigating exchange rate velocity or uncertainty within the South African context, the research sheds light on an aspect that has received limited attention. This focus is particularly important given South Africa’s status as an emerging economy with its unique economic challenges and policy considerations. The findings of this paper will provide valuable insights for policymakers and stakeholders in South Africa, enabling them to make informed decisions regarding exchange rate management, economic growth strategies, and policy interventions. Finally, the paper’s policy implications are significant. By examining the impact of exchange rate uncertainty and misalignment on economic growth, the research offers insights into effective strategies for managing exchange rate volatility and misalignments. These findings can guide policymakers in South Africa in formulating appropriate policies to promote exchange rate stability, minimize the adverse effects of exchange rate fluctuations, and foster sustainable economic growth.
This paper explores the relationship between exchange rate misalignment uncertainty and domestic product growth in South Africa. The generalized autoregressive conditional heteroskedasticity (GARCH) and vector error correction (VEC) models are utilized on the data from 1960 quarter 1 to 2022 quarter 3. In the short run, the findings reveal a negative relationship between exchange rate uncertainty, measured by the ARCH approach, and economic growth. A 1% increase in lagged exchange rate uncertainty is associated with a decrease of 0.0185% in economic growth. Similarly, the GARCH approach shows that a 1% increase in lagged exchange rate uncertainty results in a decrease of 0.138% in economic growth. These results highlight the need for proactive measures to manage exchange rate volatility and minimize its adverse effects on economic growth. Moving to the long run, the paper finds that exchange rate uncertainty, as measured by the ARCH approach, has a positive impact on economic growth. A 1% increase in current exchange rate uncertainty is associated with a 0.6053% increase in economic growth. However, the GARCH approach shows a negative relationship, with a 1% increase in exchange rate uncertainty leading to a 4.9786% decrease in economic growth. These contrasting effects emphasize the importance of addressing exchange rate volatility to ensure long-term economic stability and growth. The findings suggest that exchange rate volatility and misalignment have significant implications for economic growth. Policymakers should consider adopting strategies to manage exchange rate volatility, such as implementing managed floating exchange rates and enhancing communication channels. Additionally, efforts to stabilize the exchange rate and reduce uncertainty can attract investment and create a favorable business environment conducive to economic growth.
The rest of the paper has the following. First, section 2 outlines the literature review. Second, section 3 discusses the methodology. Fourth, section 4 discusses the empirical results. Finally, section 5 outlines the conclusion of the paper.
2. Literature review
From 1980 to 2014, Ehigiamusoe and Lean (Citation2019) focus on the West African region and examine the moderating effects of the real exchange rate and its volatility on the finance growth nexus. The pooled mean group (PMG) model was used, and it was found that real exchange rate volatility is negative, implying that volatility in the real exchange rate is repugnant to economic growth through the financial sector. The investigation of the impact of exchange rate volatility on economic growth in Nigeria was undertaken by Adeniyi and Olasunkanmi (Citation2019) and utilizes the autoregressive distributed lag (ARDL) model in the data from 1980 to 2016. It was found that there is an insignificant positive relationship between exchange rate volatility and economic growth in Nigeria. Based on these findings, the study suggests that the Nigerian government should diversify the economy to improve exports, reduce dependence on the oil and gas sector, and implement policies to ensure exchange rate stability for sustainable economic growth. The variability of the real exchange rate was investigated by Hadhek et al. (Citation2019) in Tunisia from 1980 to 2015. The error correction model (ECM) was used, and they found that an increase in foreign capital flows of 10% generates an appreciation of 0.3% of the real value of the Tunisian Dinar. On the other hand, the study emphasizes the importance of understanding and managing these fluctuations for economic stability and growth. The examination of the effect of exchange rate variation was performed by Okoro and Charles (Citation2019) in Nigeria from 2000 to 2017. In a PMG model, it was evident that a 1% increase in the exchange rate resulted in a 0.715% fall in economic growth. They also found that the Naira exchange rate variation with the currencies can explain a 65% variation in Nigerian real economic growth.
The generalized method of moments (GMM) system was used by Ribeiro et al. (Citation2020) to investigate whether real exchange rate undervaluation promotes economic growth in 54 developing countries from 1990 to 2010. It was uncovered that a 10% increase in the undervaluation results in a 0.0649% increase in developing economies. In Central and Eastern European countries (CEE), Morina et al. (Citation2020) examined the effect of exchange rate volatility on economic growth in the period spanning from 2002 to 2018. The PMG model was used, and it was found that a 1% increase in the exchange rate volatility proxied by the z score has a 0.862% negative effect on economic growth in CEE countries. Similar to Morina et al. (Citation2020), Cuestas et al. (Citation2020) investigated the impact of exchange rate misalignment on economic activity in nine CEE economies. Using the panel vector autoregression (VAR), they note that there was a 1.674% negative effect on economic activity for a 1% exchange rate misalignments. The exploration of how real exchange rate misalignment affects economic growth in Pakistan was undertaken by Jehan and Irshad (Citation2020) using time series data ranging from 1980 to 2016. It was found that there is a 0.134 fall in GDP when there is a 1% increase in real exchange rate misalignment. However, their real exchange rate misalignment is associated with FDI, with a positive impact on economic growth of 0.004%. The authors note that exchange rate policies need to be managed cautiously, and financial sector development should be strengthened to mitigate the adverse impact of RER misalignment on economic growth. The Markov switching model was utilized by Bhattarai and Ben-Naser (Citation2020) in Libyan to examine time-varying misalignments of the equilibrium real exchange rate on economic growth. It was found that there is a 91% chance that the exchange rate will move from the position of undervaluation and return to some state. The time-varying misalignments of the equilibrium real exchange rate were noted to have a detrimental effect on the exchange rate.
The equilibrium real exchange rate and misalignment examination in Sierra Leone were performed by Tarawalie (Citation2021) from 1980 to 2018. In the VAR model used, the findings indicated that sustained deviations from the long-run equilibrium, with episodes of overvaluation and undervaluation, hurt economic growth. The real effective exchange rate and industrial productivity in Croatia were explored by Bošnjak et al. (Citation2021) using monthly data from January 2000 to June 2019. Pearson correlation was used, and it was found that the correlation analysis suggests a positive relationship between industrial productivity and the real effective exchange rate, with depreciation having a positive influence on industrial productivity. Ybrayev (Citation2021) investigated real exchange rate management and economic growth between 2009 and 2019. Our results show that a 10% undervaluation of the real exchange rate leads to a 0.05% increase in the economic growth rate and the exports of manufacturing. The real effective exchange rate misalignment expiration by Amaira (Citation2021) between 1986 and 2015 shows that the implementation of the structural adjustment plan has contributed to a low level of misalignment. Derbali (Citation2021) used the behavioral equilibrium exchange rate (BEER) approach to estimate the Tunisian equilibrium exchange rate using vector autoregressive models and vector error correction models for quarterly data over the 1990 to 2020 period. The results showed a low sensitivity of the RER to monetary and trade shocks and a convergence of the real exchange rate series of its trajectory to its long-term target value. The behavioral equilibrium exchange rate analysis of Benzid (Citation2021) in Tunisia was investigated using data from 1980 to 2019 and the ARDL model. It was found that the persistence of misalignments, with the real effective exchange rate being overvalued over the study period, led to a decrease in competitiveness. The exchange rate misalignment, state fragility, and economic growth in 13 sub-Saharan African countries were explored by Mazorodze (Citation2021) from 2009 to 2018. The equilibrium model approach was used, and it was found that there is a significantly negative effect of exchange rate misalignment on growth, which increases with state fragility.
The analysis of the impact of exchange rate asymmetries on trade and output growth was undertaken by Mesagan et al. (Citation2022) between 1970 and 2019 in eight of the largest African countries. The nonlinear autoregressive distributed lag (NARDL) showed that both appreciation and depreciation primarily exert negative impacts on the long-run trade balance, while depreciation has mainly short-run positive effects. The real exchange rate misalignment and economic growth were explored by Ayele (Citation2022) in East Africa using time series data over the period 1980 to 2019. The PMG and dynamics show that the real exchange rate misalignment impedes the growth of Ethiopia, while it promotes the growth of Kenya. Overall, the author notes that real exchange rate misalignment can promote economic growth. The use of 194 countries by Ramoni-Perazzi and Romero (Citation2022) investigated the effect of exchange rate volatility on economic growth from 1995 to 2019. The dynamic panel data model was utilized, and it was found that there is a significant negative effect of exchange rate volatility on economic growth, with a diminishing effect as the financial system develops. Between 1981 and 2016, Zhu et al. (Citation2022) used the vector error correction model (VECM) to investigate the nexus between GDP, exports, and exchange rates in Asian countries. The results support the export-led growth (ELG) and growth-led exports (GLE) hypotheses, indicating that an undervalued currency enhances exports and has a significant impact on economic growth. The study also suggests that the findings are robust when considering financial crises. Nganou and Nyanzi (Citation2022) analyzed the link between economic performance and macroeconomic policy in Burundi. The results showed that being overvalued for most of the recent decade had a damaging effect on long-run growth. The revision of the real exchange rate misalignment-economic growth nexus via the across-sector misallocation channel was undertaken by Giordano (Citation2022) in 54 economies and 12 sectors over the years 1980–2015. The real effective exchange rate (REER) derived from a behavioral equilibrium exchange rate model was found that both real effective exchange rate over and undervaluation lead to an increase in across-sector labor (but not capital) misallocation and, uniquely via this channel, they significantly hamper real growth. Dada (Citation2022) investigated the asymmetric effect of real exchange rates on the economic growth of 20 African countries for the period 2005 to 2019. It is found that real exchange rate appreciation inhibits economic growth, while real exchange rate depreciation is beneficial to growth in the region.
The data from 2001 to 2016 were used by Amor et al. (Citation2023) to investigate the impact of real exchange rate misalignments on economic growth in Tunisia. Using the dynamic model approach of the nonlinear autoregressive distributed lag (NARDL), it was found that there was overvaluation and undervaluation during the 2001 to 2016 period. On the other hand, there is a negative impact of real overvaluation of the dinar on Tunisia’s growth performance, while an undervaluation has no significant impact. Ramos-Herrera and Sosvilla-Rivero (Citation2023) investigate the heterogeneous relationship between the per capita economic growth rate and the deviations from the equilibrium exchange rate, as different types of countries might exhibit different dynamics from 1996 to 2016. The grouped fixed effects estimator was used, and it was found that deviations from the equilibrium exchange rate reduce the pace of real economic growth, regardless of income category, documenting that the effects are most pronounced for advanced economies, followed by low-income developing countries and, finally, for emerging economies. Maku et al. (Citation2023) investigated the exchange rates and macroeconomic fundamentals using the Vector Error Correction Mechanism (VECM). It was found that a 1% depreciation of the real exchange rate accounted for approximately a 0.90% decline in the performance of the national economy and wealth-creating activities in both the short and long run.
The identified gap in the literature is the limited attention given to the examination of exchange rate misalignment uncertainty in the context of South Africa. While previous studies have explored the effects of exchange rate volatility on economic growth, there is a dearth of research specifically focusing on exchange rate misalignment uncertainty in the South African context. Given the unique economic characteristics and challenges of South Africa, understanding the implications of exchange rate misalignment uncertainty on both short-term and long-term economic growth in this country is crucial. The specific contribution of this research lies in its focused examination of exchange rate misalignment uncertainty in South Africa, which has received limited attention in the literature. By filling this gap, the study aims to provide policymakers, economists, and stakeholders with valuable insights into the implications of exchange rate misalignment uncertainty for the country’s economic stability and growth prospects. The findings of this research will contribute to a deeper understanding of the factors influencing South Africa’s economic growth and assist in the formulation of effective strategies to manage exchange rate dynamics for sustainable and resilient economic development.
3. Methodology
This paper uses quantitative analysis to explore the relationship between exchange rate misalignment uncertainty and domestic product growth in South Africa. The economic variables used are reflected in Table . The data used are the time series data from 1960 quarter 1 to 2022 quarter 3. The economic variable outlined in Table is important in the context of the paper because reflects the economic growth rate, which is particularly important in this study because it reflects the changes in economic output over time and allows for an assessment of the impact of exchange rate uncertainty and misalignment on economic growth.
Table 1. Economic variables were used
which reflects the average capital-labor ratio, is an important determinant of productivity and economic growth. By including this variable, the study aims to examine how changes in the capital-labor ratio, influenced by exchange rate uncertainty and misalignment, affect economic growth in South Africa. The
, which is the average output-labor ratio, provides insights into the productivity levels in the economy. The study considers this variable to understand how exchange rate uncertainty and misalignment may affect the efficiency and productivity of labor, thereby influencing economic growth. The
, which is trade openness, is an important factor in determining economic growth, as it allows for the exchange of goods and services, promotes specialization, and enhances competitiveness,
reflects government expenditure, which plays a significant role in influencing aggregate demand, fiscal policy, and overall economic activity. The
denoting the income velocity of circulation of money reflects the frequency with which a unit of currency is used for transactions. Changes in income velocity can have implications for economic growth and inflation.
The , which is the Rand to US Dollar exchange rate, represents the rate at which one currency can be exchanged for another. In this study, the Rand to US Dollar exchange rate is specifically considered to investigate the relationship between exchange rate uncertainty and misalignment with GDP growth in South Africa. Changes in the exchange rate can have significant implications for trade, investment, and economic competitiveness.
is the exchange rate uncertainty ARCH approach): Exchange rate uncertainty represents the volatility or unpredictability in exchange rate movements.
is the exchange rate uncertainty GARCH approach similar to the ARCH approach, and GARCH is employed to measure exchange rate uncertainty. The GARCH model allows for a more comprehensive analysis of the volatility and persistence of exchange rate shocks.
, which is the exchange rate equilibrium for the fundamental approach, represents the rate at which the exchange rate aligns with its fundamental value based on economic fundamentals such as inflation, interest rates, and trade balances. The fundamental approach is used to estimate the equilibrium exchange rate. The
(Misalignment of exchange rate equilibrium—Fundamental approach): The misalignment of the exchange rate equilibrium represents the deviation of the actual exchange rate from its fundamental value. It indicates whether the exchange rate is overvalued or undervalued. This variable helps to analyze the effects of exchange rate misalignment on GDP growth and provides insights into the potential distortions caused by misaligned exchange rates.
and
for the exchange rate uncertainty using the ARCH approach and fundamental approach and exchange rate uncertainty using the GARCH approach and fundamental approach, respectively. This variable is important because the ARCH model allows for the examination of time-varying volatility in exchange rates while considering fundamental factors that influence exchange rate movements. On the other hand, the GARCH model also captures time-varying volatility in exchange rates, incorporating fundamental factors that affect exchange rate fluctuations.
An estimation level of the autoregressive conditional heteroskedasticity (ARCH) family is adopted in this paper to model volatility. The ARCH volatility clusters over time, meaning that periods of high volatility tend to be followed by more periods of high volatility, and periods of low volatility tend to be followed by more periods of low volatility (Engle, Citation1982). The generalized autoregressive conditional heteroskedasticity (GARCH) assumes that the conditional variance of the series is a function of both past variance and past squared errors (Bollerslev, Citation1986). The paper uses the ARCH and GARCH models because these models are well suited for capturing the time-varying volatility and uncertainty in financial and economic variables, such as exchange rates ((Engle, Citation1982) and (Bollerslev, Citation1986). These models allow for the incorporation of volatility clustering, which implies that periods of high volatility tend to be followed by additional periods of high volatility (Bollerslev, Citation1986). By employing ARCH and GARCH models, the paper can effectively capture the dynamic nature of exchange rate misalignment uncertainty in South Africa. Moreover, the ARCH and GARCH models provide a robust framework for quantifying and analyzing the impact of exchange rate misalignment uncertainty on economic growth. These models allow for the estimation of conditional volatility, which represents the uncertainty surrounding exchange rate misalignment. By considering the effects of uncertainty on economic growth, the paper can provide valuable insights into the relationship between exchange rate misalignment uncertainty and economic performance in South Africa. Finally, the use of ARCH and GARCH models enables the identification and measurement of the asymmetric effects of exchange rate misalignment uncertainty on economic growth. These models allow for the distinction between the impacts of positive and negative deviations from the mean, providing a more nuanced understanding of the relationship. This is particularly relevant in the context of South Africa, where the effects of uncertainty on economic growth may differ depending on the direction of exchange rate misalignment. Scholars that have used the ARCH and GARCH are Adeniyi and Olasunkanmi (Citation2019), Jehan and Irshad (Citation2020), Mesagan, Alimi et al. (2022), Ramoni-Perazzi and Romero (Citation2022), and Zhu et al. (Citation2022). For the estimation, the paper uses the vector error correction (VEC) model, which analyses the long-run and short-run dynamics between exchange rates and economic growth. Compared to ordinary least squares (OLS) and generalized method of moments (GMM) models, the VEC model specifically captures the concept of cointegration, which reflects the long-run equilibrium relationship between variables. The VEC long run assesses the impact of exchange rate changes on economic growth by analyzing the cointegrating relationship between the variables. This provides insights into the equilibrium relationship and the adjustments that occur over time to restore this equilibrium. Additionally, the VEC model also captures short-term dynamics between exchange rates and economic growth, accounting for any disequilibrium or temporary shocks Zhu et al. (Citation2022). Scholars that have used the VEC are Cuestas et al. (Citation2020) Derbali (Citation2021), Zhu et al. (Citation2022) and (Maku et al., Citation2023).
3.1. Theoretical framework
The Solow growth model was first introduced in 1956 and provides a dynamic view of how savings, investment and population affect economic growth. The Solow growth model is specified in EquationEquation (1)(1)
(1) .
where economic growth
is labor
denotes capital
indicates technological progress and
stands for efficiency of labor, which indicates public knowledge about production methods, which is triggered by the improvement in technology denoted by
. The Solow growth model is dynamic, and this is denoted by subscript
in each variable of the model. The exponential subscripts of
in EquationEquation (1)
(1)
(1) are the share of output paid to labor, and
is the share of output paid to capital. The assumptions of the Solow growth model. In the Solow growth model, it is rationalized that the economy will reach a steady state, which is a value of per capital-capital
such that if the economy has
then
(Kung & Schmid, Citation2015). At the steady state, the Solow model advocates that savings are equal to the amount needed to provide equipment (investment) that is needed for any additional workers
and compensate for the depreciation of equipment
given by
. Since
and
are constant and
satisfies the Inada condition, the consumption is proportional to output
. The possible choices for
will produce the highest possible steady state value for
, which is called the golden rule savings rate (Mankiw, Citation2010, Citation2012). However, for this paper, the above Cobb‒Douglas in EquationEquation (1)
(1)
(1) is extended with other economic variables reflected in EquationEquation (2)
(2)
(2) .
where the is economic growth,
is the average capital-labor ratio and
is the average output-labor ratio.
is beta, and
is the
vector of independent and identically distributed error terms.
represents the vector of economic variables of interest of exchange rate misalignment uncertainty. where
trade openness,
government expenditure,
income velocity of circulation of money M1, M2 and M3, and
Rand to US Dollar exchange rate
3.2. Stabilization of data
3.2.1. Misalignment of exchange rate equilibrium using the fundamental approach
To find the misalignment, the paper uses the fundamental approach that advocated for the estimation of factors that affect the exchange rate. Moreover, there is a use of the reduced-form single equation model, employing the modified version of the single equation model that links to a set of fundamentals specified in EquationEquation (3)
(3)
(3) .
The misalignment of exchange rate equilibrium using the fundamental approach is calculated as the difference between the observed
exchange rate and its predicted
exchange rate equilibrium using the fundamental approach, as reflected in e EquationEquation (4)
(4)
(4) .
3.2.2. Misalignment of equilibrium using the HP filter
The filter adopted in this paper is the HP filter, as reflected in EquationEquation (5)(5)
(5) .
Minimize the sum of the squared deviation of the series from the trending subject to the smoothing parameter
typical 160 for the quarterly data. The HP filter has the limitation of being biased in its ending point (Hodrick et al., Citation1997). This problem is solved in this paper by extending data using the forecasted values in each economy. The
misalignment of equilibrium using the HP filter is calculated as the difference between the observed
exchange rate and its predicted
exchange rate equilibrium using the HP filter, as reflected in EquationEquation (6)
(6)
(6) .
3.3. Model specification ARCH and other models
The ARCH reflects the conditional variance or past volatility affecting current and future volatility and was proposed by Engle (Citation1982) as represented in EquationEquations (7)
(7)
(7) to (Equation9
(9)
(9) ).
where is the growth rate or the return of the economic variable of interest for this paper, which is
at time
and
as well as
represent the mean and residual, respectively. The subscript
reflects that the conditional variance
is a normal distribution random variable. The process
scaled by
follows the autoregression process (Engle, Citation1982). The ARCH model was extended by Bollerslev (Citation1986) from the consideration of past squared error terms conditional variance to the GARCH
models including both past squared error terms and past conditional variances. The GARCH normality with zero mean is reflected in EquationEquations (10)
(10)
(10) to (Equation11
(11)
(11) ).
where denotes the past information
, and the variance
can be variance (Bollerslev, Citation1986) in EquationEquation (12)
(12)
(12) .
where
is the autoregressive ARCH
, is the moving average of GARCH, and
and
are the vector unknown parameters Bollerslev (Citation1986). Using the above equations from (7) to (12), the final variables are
exchange rate misalignment uncertainty using the ARCH approach and fundamental approach,
exchange rate misalignment uncertainty using the GARCH approach and fundamental approach,
exchange rate misalignment uncertainty using the ARCH approach and HP filter and
exchange rate misalignment uncertainty using the GARCH approach and HP filter.
3.4. Model specification of VEC
The VEC model is built in from the unrestricted vector autoregressive (VAR), as reflected in EquationEquation (13)(13)
(13) .
where is an
vector of the nonstationary
variable,
is an
vector of constants,
is the number of lags,
is an
matrix of estimable parameters, and
is an
vector of independent and identically distributed error terms. The VEC model can handle cointegrated and different economic variables. Therefore, the VAR model is rewritten as the VEC model, as reflected in EquationEquation (14)
(14)
(14) .
where is the difference operator, and the VECM specification contains information on both the short- and long-run adjustment to changes in
via the estimated parameters
and
, respectively. In the context of this paper, the VEC model is reflected in EquationEquations (15)
to (Equation20
).
4. Result
Table shows the descriptive statistics of the economic variables used in this paper. The mean of is found to be 2.88%. In South Africa, this growth rate might be considered below the desired level, especially if the National Development Plan advocates a target growth rate of 5%. A lower growth rate may suggest slower economic expansion or potential challenges in achieving development goals. The
average capital-labor ratio mean value is 396,186.57, which is a very high value that indicates higher productivity levels and potential for economic growth. The
average output-labor ratio is 177,792.3, and this value suggests that, on average, each worker in South Africa generates a considerable output. The
trade openness mean value is −0.387, which suggests a trade deficit or a higher dependency on imports compared to exports. This indicates that South Africa has a relatively less open economy in terms of trade. The
government expenditure mean value is 13.635, and the
income velocity of circulation of money M1, M2 and M3 mean value is 8.981, which suggests that, on average, money changes hands approximately nine times within a given period.
Table 2. Descriptive statistics
The Rand to US Dollar exchange rate mean value is 4.826. Table reflects that the economic variables considered in this paper all have positive skewness. Table reflects the kurtosis that is high and greater than 0.7, indicating that their distributions are leptokurtic and fat-tailed. The high values of kurtosis for
suggest that extreme price changes occurred more frequently during the sampling period 1960 quarter 1 to 2022 quarter 3. Table shows the matrix of correlations of the economic variables that are considered in this paper. The
average capital-labor ratio reflects a 0.110 positive correlation with economic growth. Despite this value being positive, it is very low, which indicates that there is a scope for investment in capital-intensive industries and infrastructure. Increasing the capital-labor ratio through investments in machinery, technology, and other capital goods can help boost productivity and stimulate economic growth in South Africa. The
average output-labor ratio is found to have a negative correlation value of 0.192 with economic growth. The negative correlation between the average output-labor ratio and economic growth suggests that South Africa might be experiencing structural challenges in its economy. This could imply that the increase in output per worker is driven by labor-saving technologies or other factors that may not necessarily translate into significant overall economic growth.
Table 3. Matrix of correlations
There is a negative correlation value of 0.045 between trade openness and GDP. South Africa is a relatively open economy that is heavily reliant on international trade. The negative correlation between trade openness and economic growth could reflect challenges such as increased competition from international markets, exchange rate fluctuations, or external shocks that may impact the country’s production and economic growth. There is a positive correlation (0.246) between
government expenditure and economic growth, indicating that an increase in government spending tends to have a positive impact on economic growth. However, it is crucial to ensure that government expenditure is directed toward productive investments, infrastructure development, and sectors that generate sustainable economic activity and job creation. A value of 0.359 is found to be the correlation value
income velocity of circulation of money and economic growth, implying that a higher rate of turnover of money in the economy is associated with stronger economic growth. The
Rand to US Dollar exchange rate has a negative correlation value of 0.315 with economic growth. This emphasizes the need for policies that support a competitive exchange rate, encourage export-oriented industries, and attract foreign investment to enhance economic growth.
Table shows the conventional unit root and structural break. The Dickey-Fuller and Phillips-Perron tests for unit roots reflect that all variables are stationary at levels and that as well as
are only stationary at the first difference. The structural break is reflected in Figure , showing the period there is the break in the data that is considered in this paper. Figure shows the economic variables and estimation misalignment of the exchange rate equilibrium. Figure , graph b, reflects the estimation data from EquationEquation (4)
(4)
(4) for
misalignment of exchange rate equilibrium using the fundamental approach. These data are found to have a cyclical upward trend, which reflects the undervaluation of the rand over time. This can be attributed to trade imbalance putting downward pressure on the currency, potentially leading to an undervaluation. On the other hand, capital flows and investor sentiment can also play a significant role in driving exchange rates. Given the negative mean outline in Table , it may be that capital outflow is weakening the domestic currency, which contributes to an undervaluation.
Figure 1. Economic variables and estimation. Note misalignment of exchange rate equilibrium using the fundamental approach,
exchange rate equilibrium using the fundamental approach,
misalignment of exchange rate equilibrium using the fundamental approach,
exchange rate equilibrium using the HP filter and
misalignment of equilibrium using the HP filter.
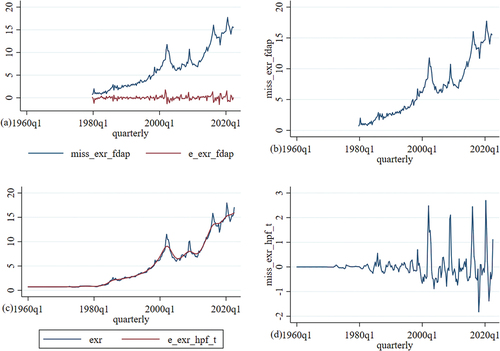
Table 4. Conventional unit root and structural break
Figure , graph d, negative or positive values of exchange rate misalignment in cyclical trends of misalignment of equilibrium using the HP filter, reflects the estimation data from EquationEquation (6)
(6)
(6) . The fluctuations in global commodity prices affect South Africa’s export earnings and trade balance, consequently impacting the exchange rate. Therefore, this is reflected in the positive or negative trend of the misalignment in the exchange rate. On the other hand, external shocks, such as global economic downturns, geopolitical events, or changes in global financial conditions, have affected South Africa’s misalignment in the exchange rate. This has led to volatility and misalignment in the exchange rate.
Given the misalignment in the exchange rate in South Africa reflected in Figure , it is critical to investigate the impact of the uncertainty or volatility of misalignment in the exchange rate on economic growth. To find this, the paper starts by using the observation that there is uncertainty or volatility in the data. This is reflected in Figure , which shows that the economic variables cluster the first and second waves of uncertainty or volatility. Figure , graphs a to c, shows that the cluster’s first wave of volatility observation has flowed the cluster’s second wave of volatility observation. Thus, the autoregressive conditional heteroskedasticity (ARCH) and generalized autoregressive conditional heteroskedasticity (GRACH) models can be applied.
Figure 2. Economic variables cluster the first and second waves of volatility. Note that the economic variables, Rand to US Dollar exchange rate,
misalignment of exchange rate equilibrium using the fundamental approach,
misalignment of equilibrium using the HP filter,
and
in each economic variable reflect the cluster volatility.
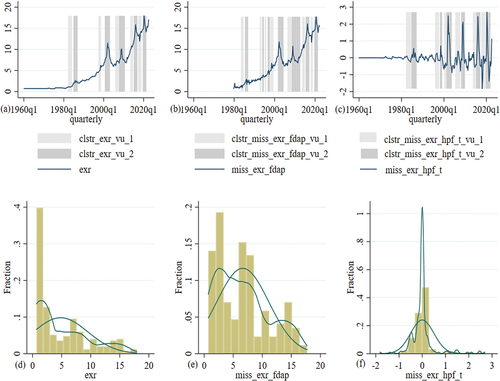
Table reflects White’s test and the Breusch‒Pagan test to see if there is homoskedasticity or heteroskedasticity or ARCH effect test in the data set of Rand to US Dollar exchange rate,
misalignment of exchange rate equilibrium using the fundamental approach and
misalignment of equilibrium using the HP filter. In the three estimations, White’s test has Prob > chi2 values of 0.0000, 0.0000 and 0.038301, and the Breusch‒Pagan test has Prob > chi2 values of 0.0000, 0.0000 and 0.0000; therefore, it can be rejected that
,
and
. This provides evidence that there is clustering volatility, which reflects that hhigh-volatility periods tend to cluster together in time. Moreover, periods of high volatility are more likely to be followed by other periods of high volatility, and periods of low volatility are more likely to be followed by other periods of low volatility. Figure reflects that there has been uncertainty about fiscal consolidation in the late 1980s; however, things sim to have changed when South Africa was about to enter democracy in 1994. Some of the factors may be attributed to the uncertainty of fiscal consolidation during this period of political transition. The negotiations and discussions around the transition from apartheid to democracy introduced uncertainty regarding the future governance and policy direction of the country. These uncertainties could have affected the government’s ability to implement and sustain fiscal consolidation measures. On the other hand, there are economic challenges that South Africa faced during that period, including high inflation, a growing debt burden, and structural imbalances in the economy. These challenges complicated the task of fiscal consolidation and added to the overall uncertainty. Some of the other episodes of fiscal consolidation uncertainty are discussed in the transition probability below.. shows the autoregressive conditional heteroskedasticity (ARCH) model and the generalized autoregressive conditional heteroskedasticity (GARCH) model that has been used to estimate the conditional variance for the
exchange rate uncertainty ARCH approach,
exchange rate uncertainty GARCH approach,
exchange rate misalignment uncertainty using the ARCH approach and fundamental approach,
exchange rate misalignment uncertainty using the GARCH approach and fundamental approach,
exchange rate misalignment uncertainty using the ARCH approach and HP filter and
exchange rate misalignment uncertainty using the GARCH approach and HP filter.
Figure 3. Variance for the exchange rate proxies volatility. Note economic variables exchange rate uncertainty ARCH approach,
exchange rate uncertainty GARCH approach,
exchange rate misalignment uncertainty using the ARCH approach and fundamental approach,
exchange rate misalignment uncertainty using the GARCH approach and fundamental approach,
exchange rate misalignment uncertainty using the ARCH approach and HP filter and
exchange rate misalignment uncertainty using the GARCH approach and HP filter.
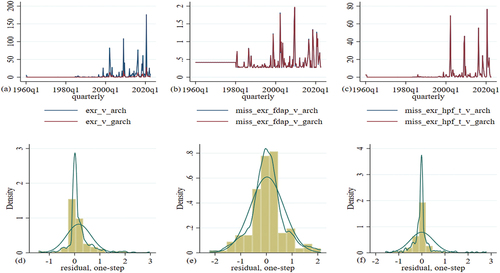
Table 5. ARCH effect test
The lag-order selection criteria of (AIC, HQIC, and SBIC) are presented in Table . The AIC, HQIC, and SBIC criteria recommend the use of the optimal 3 lag.
Table 6. Lag-order selection criteria
The results of the Johansen cointegration tests, in Table , show that the null hypothesis for the zero cointegrating equation is rejected at a 0.05 significance level. These results provide evidence that there is a long-run relationship. Therefore, the VEC is relevant for estimation.
Table 7. Johansen tests for cointegration
Table shows the vector error correction in the short and long run, and estimations 1 and 2 show the results in the short run. The exchange rate uncertainty using the ARCH approach is found to have a coefficient of −0.0185, which is statistically significant at a pp-value of 5%. This suggests that there is a negative relationship between the lagged value of exchange rate uncertainty and economic growth, and a 1% increase in lagged exchange rate uncertainty is associated with a 0.0185% decrease in economic growth in the short run. The
exchange rate uncertainty using the ARCH approach has a coefficient of 0.138, which is statistically significant at a pp-value of 5%. A 1% increase in the
lagged exchange rate uncertainty ARCH approach is associated with a decrease of 0.138% in economic growth in the short run. These results are similar to Adeniyi and Olasunkanmi (Citation2019), Hadhek et al. (Citation2019) and Okoro and Charles (Citation2019), among others. This could involve implementing mechanisms such as managed floating exchange rates or establishing effective communication channels to provide clarity and transparency regarding exchange rate policies.Footnote2
Table 8. Vector error correction in the short and long run
Table shows the vector error correction in the short and long run, and estimations 3 and 4 show the long run. The exchange rate uncertainty using the ARCH approach has a coefficient of 0.6053 and is statistically significant at a p value of 1%. A 1% increase in the current exchange rate uncertainty ARCH approach is associated with an increase of 0.6053% in economic growth in the long run. The
exchange rate uncertainty using the GARCH approach is found to have a coefficient of −4.9786 and is statistically significant at a 5% p value. A 1% increase in the current exchange rate uncertainty GARCH approach results in a decrease of 4.9786% in economic growth in the long run. The positive impact is overweighted by the negative impact. Therefore, this result of a 4.9786% decrease in growth emphasizes the need for policymakers to address and reduce exchange rate volatility to support long-term economic stability and growth. Policies aimed at stabilizing the exchange rate and reducing uncertainty can help attract investment, promote trade, and foster a favorable business environment.
Table shows the vector error correction in the short run. The variable of interest of exchange rate uncertainty is found to be insignificant, which reflects that we cannot ascertain its impact in the short run.
Table 9. Vector error correction short run
Table shows the vector error correction short run, and estimation 1 shows that the misalignment of the exchange rate equilibrium using the fundamental approach has a coefficient of 1.5965, suggesting that a higher misalignment of the exchange rate equilibrium using the fundamental approach is associated with certain economic implications for GDP. A 1% increase in
resulted in a 1.5965% increase in economic growth.
Table 10. Vector error correction long run
The positive coefficient indicates that an increase in exchange rate misalignment using the fundamental approach leads to an increase in economic growth. This implies that when the exchange rate deviates from its fundamental value, it could potentially have a positive impact on economic growth. Estimation 3 shows that the misalignment of equilibrium using the HP filter has a coefficient of 5.2076, indicating that a higher misalignment of the exchange rate equilibrium using the HP filter is associated with certain economic implications for economic growth. The
exchange rate misalignment uncertainty using the GARCH approach is found to have a coefficient of 1.0141, suggesting that an increase in exchange rate misalignment uncertainty using the GARCH approach is associated with certain economic implications for economic growth. Therefore, a 1% increase in
results in a 1.0414% increase in economic growth. The positive coefficient indicates that higher exchange rate uncertainty, as measured by the GARCH approach, leads to an increase in economic growth. This implies that increased uncertainty in exchange rates could potentially have a positive impact on economic growth.
The coefficient of 5.2076 for the misalignment of equilibrium using the HP filter suggests that deviations in the exchange rate from its equilibrium value can have substantial implications for South Africa’s economic growth. This indicates that when the exchange rate is misaligned, it can affect the overall economic output of the country. This result is similar to that of Derbali (Citation2021), Benzid (Citation2021) and Mazorodze (Citation2021). However, in this paper, it is noted that the margin is high. This could be attributed to the paper being country based, while the other authors have condensed the panel data. Policymakers need to consider the impact of exchange rate misalignments and implement measures to mitigate their negative effects on economic growth. Moreover, the coefficient of 1.0141 for exchange rate misalignment uncertainty using the GARCH approach indicates that increased uncertainty in exchange rates can have economic implications for South Africa. The positive coefficient suggests that higher levels of exchange rate misalignment uncertainty can potentially stimulate economic growth. However, policymakers must strike a balance between allowing a certain level of uncertainty to promote economic activity and ensuring stability to attract investment and maintain a favorable business environment. These economic implications emphasize the need for policymakers in South Africa to address and manage exchange rate volatility effectively. Implementing policies and mechanisms to stabilize the exchange rate, such as managed floating exchange rates or effective communication channels to enhance transparency, can contribute to long-term economic stability and foster a conducive environment for investment and trade.
Figure shows the shocks of misalignment of exchange rate equilibrium using the fundamental approach and misalignment of equilibrium using the HP filter. Figure , graph a, the misalignment of exchange rate equilibrium using the fundamental approach shock to economic growth. It was found that the
shore resulted in a fall in
in first quarter 1, and in the second quarter,
fell again to 0.12%. Thereafter,
increases and reflects cyclical movement, which is below equilibrium. These results are similar to those of Bošnjak et al. (Citation2021), Ybrayev (Citation2021) and Amaira (Citation2021), among others. This result suggests that
misalignment of exchange rate equilibrium using the fundamental approach shock leads to a decrease in consumer spending and business investment due to higher import prices. This decline in aggregate demand can contribute to a fall in ECONOMIC GROWTH. Figure , graph g, shows the
misalignment of equilibrium using the HP filter shock to economic growth. It is found that shocks
result in a fall in
.
Figure 4. Shocks of misalignment of exchange rate equilibrium using the fundamental approach and misalignment of equilibrium using the HP filter. Note that the economic variables are the economic growth,
average capital-labor ratio,
average output-labor ratio,
trade openness,
exchange rate,
government expenditure,
income velocity of circulation of money M1, M2 and M3,
Rand to US Dollar exchange rate,
misalignment of exchange rate equilibrium using the fundamental approach and
misalignment of equilibrium using the HP filter.
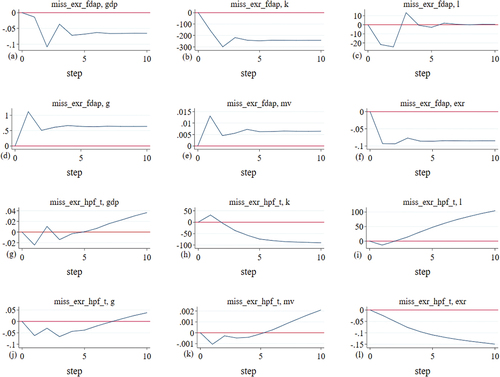
Figure shows the shocks of exchange rate misalignment uncertainty using the ARCH approach and fundamental approach and
exchange rate misalignment uncertainty using the GARCH approach and fundamental approach. Figure , graphs a and g, shows that the shock of
and
results in a fall in
, the growth rate of economic growth. However,
has a higher magnitude than
but reflects some trend pattern. This result is similar to that of Hadhek et al. (Citation2019), Ribeiro et al. (Citation2020), Morina et al. (Citation2020) and Morina et al. (Citation2020), among others. However, there effect was soothing down, but in this paper, we find cyclical movement down.
Figure 5. Shocks of exchange rate misalignment uncertainty using the ARCH approach and fundamental approach and exchange rate misalignment uncertainty using the GARCH approach and fundamental approach. Note that the economic variables are the economic,
average capital-labor ratio,
average output-labor ratio,
government expenditure,
income velocity of circulation of money M1, M2 and M3,
Rand to US Dollar exchange rate,
exchange rate misalignment uncertainty using the ARCH approach and fundamental approach and
exchange rate misalignment uncertainty using the GARCH approach and fundamental approach. This result are connect to that of Amor et al. (Citation2023), Ramos-Herrera and Sosvilla-Rivero (Citation2023) and Maku et al. (Citation2023) among other that found is a negative impact of real overvaluation on growth performance, while an undervaluation has no significant impact. investigate the heterogeneous relationship between the per capita economic growth rate and the deviations from the equilibrium exchange rate.
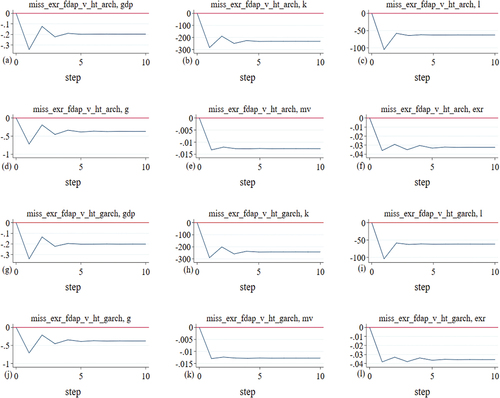
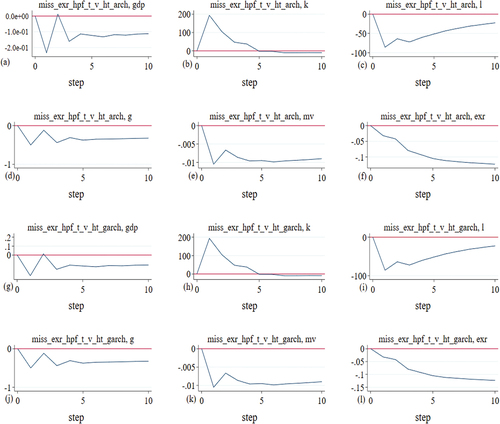
Figure shows the shocks of exchange rate misalignment uncertainty using the ARCH approach and HP filter and
exchange rate misalignment uncertainty using the GARCH approach and HP filter. Figure , graphs a and g, shows that the shock of
and
results in a fall in the
growth rate of economic growth. However,
has a higher magnitude than
but reflects some trend pattern.
Figure 6. Shocks of exchange rate misalignment uncertainty using the ARCH approach and HP filter and exchange rate misalignment uncertainty using the GARCH approach and HP filter. Note that the economic variables are the economic growth,
average capital-labor ratio,
average output-labor ratio,
exchange rate,
government expenditure,
income velocity of circulation of money M1, M2 and M3,
Rand to US Dollar exchange rate,
exchange rate misalignment uncertainty using the ARCH approach and HP filter and
exchange rate misalignment uncertainty using the GARCH approach and HP filter.
5. Conclusion
In this paper, we examined the relationship between exchange rate uncertainty, misalignment, and economic growth in South Africa. Through the application of Vector Error Correction Models (VECM), we analyzed the short-run and long-run dynamics to uncover key insights. The findings revealed that in the short run, higher levels of lagged exchange rate misalignment uncertainty had a statistically significant negative impact on economic growth. This suggests that increased uncertainty surrounding exchange rates can hinder economic expansion in the short term. However, the long-run effects of currency exchange rate misalignment uncertainty were more nuanced. One measurement approach indicated a positive coefficient, implying a potential positive influence on economic growth, while another approach yielded a negative coefficient, implying a potential negative impact on growth. These divergent results highlight the complexity of the relationship between exchange rate misalignment uncertainty and long-term economic growth.
Furthermore, the analysis of exchange rate misalignment using different approaches showed a positive association with economic growth. This indicates that when the exchange rate deviates from its fundamental value, it can have favorable implications for economic expansion. These findings underscore the importance of addressing exchange rate misalignments to stimulate growth. Based on these results, it is recommended that policymakers in South Africa adopt a proactive approach to managing exchange rate volatility. Implementing mechanisms such as managed floating exchange rates can provide greater stability and reduce uncertainty, which in turn can attract investment, promote trade, and create a favorable business environment. Moreover, establishing effective communication channels to enhance transparency and clarity regarding exchange rate policies is essential for building trust and confidence among market participants. It is important to note that our paper opens avenues for further research. Future studies could delve into the specific channels and external factors that mediate the relationship between exchange rate dynamics and economic growth in South Africa. Exploring these aspects would contribute to a deeper understanding of the mechanisms at play and enable policymakers to make more informed decisions.
The limitation of the paper is related to the data quality, and the accuracy and reliability of the findings depend on the quality and availability of the data used in the analysis. If the data suffer from measurement errors or missing observations. This is given by the fact that most of the data set of interest used in the estimation was revisited for the economic data source. On the other hand, model assumptions: The GARCH and VEC models used in the analysis are subject to certain assumptions about the data and underlying economic relationships. Violation of these assumptions may affect the validity of the results. There may be an issue of endogeneity that can arise when variables are interrelated, leading to biased coefficient estimates. Controlling for endogeneity is essential to establish causality between exchange rate misalignment uncertainty and economic growth. However, this model used is effective in the effort to answer the economic question of the paper.
The policy implication is that the misalignment of equilibrium using the HP filter suggests a result of the coefficient of 5.207% in economic growth. Policymakers need to consider the impact of exchange rate misalignments and implement measures to mitigate their negative effects on economic growth. On the other hand, given the finding that the lagged exchange rate uncertainty ARCH approach is associated with a decrease of 0.138% in economic growth in the short run, policymakers should consider adopting a proactive approach to managing exchange rate volatility. This could involve implementing mechanisms such as managed floating exchange rates or establishing effective communication channels to provide clarity and transparency regarding exchange rate policies. The exchange rate uncertainty using the GARCH approach results in a decrease of 4.9786% in economic growth in the long run. Therefore, this result of the 4.9786% decrease in growth emphasizes the need for policymakers to address and reduce exchange rate volatility to support long-term economic stability and growth. Policies aimed at stabilizing the exchange rate and reducing uncertainty can help attract investment, promote trade, and foster a favorable business environment.
There is also a gap that still needs to be explored in South Africa that is related to investigating the specific mediating factors and channels through which exchange rate dynamics impact economic growth in South Africa. For example, explore how exchange rate misalignments and uncertainty affect investment decisions, trade patterns, capital flows, and financial markets. Understanding these mechanisms can help design more targeted and effective policy interventions. On the other hand, scholars still need to engage more in analyzing the spillover effects of exchange rate dynamics from other economies to South Africa and vice versa. Consider how global economic conditions, international trade relationships, and capital flows influence exchange rate movements and, in turn, impact economic growth in the country. Moreover, sector-specific analysis still needs to examine the differential effects of exchange rate dynamics on various sectors of the South African economy. Certain industries might be more vulnerable to exchange rate fluctuations, while others may benefit from currency misalignments. Understanding these sectoral dynamics can guide policymakers in formulating sector-specific policies.
Disclosure statement
No potential conflict of interest was reported by the author(s).
Additional information
Notes on contributors

Eugene Msizi Buthelezi
Eugene Msizi Buthelezi holds a BCom Master’s degree in economics from the University of KwaZulu-Natal (UKZN). He is currently in the advanced stage of completing his Ph.D. (currently submitted for examination) at UKZN. Presently, he serves as an nGAP Lecturer at the University of the Free State (UFS), where he teaches economics for public managers. His research interests lie in macroeconomics, focusing on macroeconomic modeling, fiscal policy, monetary policy, monetary systems, inflation, interest rates, and central banks and their policies
Notes
1. This paper makes a notable contribution to the literature by addressing the research gap surrounding exchange rate velocity or uncertainty and its impact on economics growth. By providing a comprehensive understanding of the finance-growth nexus, considering variations across income categories and country types, focusing on the South African context, and offering policy implications, this research enhances our knowledge and provides practical insights for policymakers and stakeholders in South Africa and beyond.
2. The implications of these findings suggest that policymakers in South Africa should consider adopting a proactive approach to manage exchange rate volatility. Implementing mechanisms such as managed floating exchange rates or establishing effective communication channels can enhance clarity and transparency regarding exchange rate policies, which may help reduce uncertainty and foster economic stability. By addressing exchange rate uncertainty, policymakers can create a more favorable business environment, attract investments, and promote economic growth.
References
- Adeniyi, A. P., & Olasunkanmi, A. O. (2019). Impact of exchange rate volatility on economic growth in Nigeria (1980-2016. International Journal of Management Studies and Social Science Research, 1(4), 6–30.
- Amaira, B. (2021). Real effective exchange rate misalignment of the Tunisian dinar. The Romanian Economic Journal, 24(80). https://doi.org/10.1016/j.qref.2023.01.007
- Amor, T. H. (2023). Real exchange rate misalignments and economic growth in Tunisia: New evidence from a threshold analysis of asymmetric adjustments. The Quarterly Review of Economics & Finance, 88, 215–227. https://doi.org/10.1016/j.qref.2023.01.007
- Ayele, G. M. (2022). Real exchange rate misalignment and economic growth in East African least developed countries. Heliyon, 8(11), e11840.
- Benzid, L. (2021). Persistence of real effective exchange rate misalignments in Tunisia. Academy of Entrepreneurship Journal, 27, 1–14.
- Bhattarai, K., & Ben-Naser, A. (2020). Real exchange rate misalignments of Libyan dinar: Fundamentals and Markov switching regimes. Journal of Development Economics and Finance, 1, 151–162.
- Bollerslev, T. (1986). Generalized autoregressive conditional heteroskedasticity. Journal of Econometrics, 31(3), 307–327.
- Bošnjak, M. (2021). Real effective exchange rate and industrial productivity in Croatia: Wavelet coherence analysis. South East European Journal of Economics and Business, 16(1), 30–37.
- Cuestas, J. C. (2020). Real exchange rate misalignments in CEECs: Have they hindered growth? Empirica, 47, 733–756. https://doi.org/10.1007/s10663-019-09454-5
- Dada, J. T. (2022). On the asymmetric effect of real exchange rate on growth: Evidence from Africa. Economic Journal of Emerging Markets, 14(1), 15–28. https://doi.org/10.20885/ejem.vol14.iss1.art2
- Derbali, A. (2021). The misalignment of real effective exchange rate: Evidence from Tunisia. Graduate Institute of International and Development Studies Working Paper.
- Ehigiamusoe, K. U., & Lean, H. H. (2019). Influence of real exchange rate on the finance-growth nexus in the West African region. Economies, 7(1), 23.
- Engle, R. F. (1982). Autoregressive conditional heteroscedasticity with estimates of the variance of United Kingdom inflation. Econometrica: Journal of the Econometric Society, 50(4), 987–1007. https://doi.org/10.2307/1912773
- Giordano, C. (2022). Revisiting the real exchange rate misalignment-economic growth nexus via the across-sector misallocation channel. Banca d’Italia Eurosistema.
- Hadhek, Z. (2019). The variability of the Tunisian real exchange rate. International Journal of Economics and Finance, 11(1), 115–128.
- Hodrick, R. J. J. O. M., PRESCOTI, E., & Credit and Banking. (1997). Postwar US business cycles: An empirical investigation. Journal of Money, Credit, and Banking, 29(1), 1–16. https://doi.org/10.2307/2953682
- Iyke, B. N., & Ho, S.-Y. (2021). Exchange rate exposure in the South African stock market before and during the COVID-19 pandemic. Finance Research Letters, 43, 102000. https://doi.org/10.1016/j.frl.2021.102000
- Jehan, Z., & Irshad, I. (2020). Exchange rate misalignment and economic growth in Pakistan: The role of financial Development. Pakistan Development Review, 59(1), 81–99. https://doi.org/10.30541/v59i1pp.81-99
- Kung, H., & Schmid, L. (2015). Innovation, growth, and asset prices. The Journal of Finance, 70(3), 1001–1037.
- Maku, O. A. (2023). Exchange rates and macroeconomic fundamentals in a small-commodity-export-dependent economy. Innovations, 72(2), 361–369.
- Mankiw, N. (2010). Macroeconomics. Worth Publishers.
- Mankiw, N. (2012). Macroeconomics. USA, Palgrave Macmillan.
- Mazorodze, B. T. (2021). Exchange rate misalignment, state fragility, and economic growth in sub-saharan Africa. Cogent Economics & Finance, 9(1), 1898113.
- Mboweni, T. (2001). The Reserve Bank and the Rand: Some historic reflections, address by TT Mboweni. Governor of the South African Reserve Bank.
- Mesagan, E. P. (2022). The asymmetric effects of exchange rate on trade balance and output growth. Journal of Economic Asymmetries, 26, e00272. https://doi.org/10.1016/j.jeca.2022.e00272
- Mohanty, M. S. (2013). Market volatility and foreign exchange intervention in EMEs: What has changed?-an overview. An Overview (October 2013). BIS Paper(73a).
- Morina, F. (2020). The effect of exchange rate volatility on economic growth: Case of the CEE countries. Journal of Risk and Financial Management, 13(8), 177.
- Nganou, J.-P., & Nyanzi, S. (2022). Macroeconomic performance, exchange rate dynamics, and short-run policies in Burundi. Journal of African Development, 23(1), 35–57.
- Okoro, R. C. C. U., & Charles, F. B. (2019). Naira exchange rate variation and Nigeria economic growth: A time series study. American Economic & Social Review, 5(2), 21–31.
- Onwuka, K. O., & Obi, K. O. (2014). Exchange rate volatility and growth dynamics: Evidence from Selected sub-Saharan African countries. British Journal of Economics, Management & Trade, 6(1), 61–77.
- Ramoni-Perazzi, J., & Romero, H. (2022). Exchange rate volatility, corruption, and economic growth. Heliyon, 8(12), e12328.
- Ramos-Herrera, M. D. C., & Sosvilla-Rivero, S. (2023). Economic growth and deviations from the equilibrium exchange rate. International Review of Economics & Finance, 86, 764–786. https://doi.org/10.1016/j.iref.2023.03.028
- Ribeiro, R. S. (2020). Does real exchange rate undervaluation truly promote economic growth? Structural Change and Economic Dynamics, 52, 408–417. https://doi.org/10.1016/j.strueco.2019.02.005
- SARB. (2023a). HISTORY of BANKNOTES and COIN. Retrieved 14-06-, 2023, from https://www.resbank.co.za/en/home/what-we-do/banknotes-and-coin/history-of-banknotes-and-coin#:~:text=On%2014%20February%201961%2C%20the,does%20not%20demonetise%20its%20currency.
- SARB. (2023b). Online statistical query (historical macroeconomic timeseries information). Retrieved 20-03-, 2023, from https://www.resbank.co.za/Research/Statistics/Pages/OnlineDownloadFacility.aspx.
- Tarawalie, A. B. (2021). Equilibrium real exchange rate and misalignment: The Sierra Leone perspective. Applied Economics and Finance, 8(3), 41–49.
- Ybrayev, Z. (2021). Real exchange rate management and economic growth: Export performance in Kazakhstan, 2009–2019. International Review of Applied Economics, 35(1), 64–90.
- Zhu, W. (2022). Revisiting the nexus between exchange rate, exports and economic growth: Further evidence from Asia. Economic Research-Ekonomska Istraživanja, 35(1), 7128–7146.
Appendices
Annexure
Figure A1. Structural break of the economic variables. The economic variables are the economic growth,
average capital-labor ratio,
average output-labor ratio,
trade openness,
government expenditure,
income velocity of circulation of money M1, M2 and M3 and
Rand to US Dollar exchange rate.
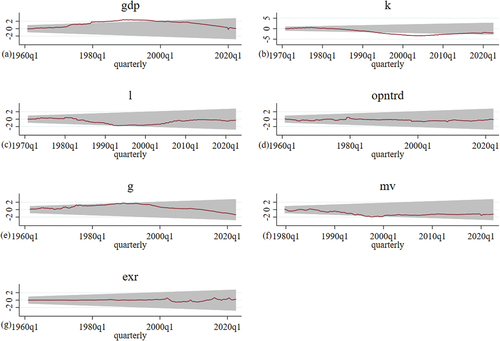
Table A1. Skewness and Kurtosis tests for normality
Table A2. The and
exchange rate uncertainty ARCH and GARCH approaches
Table A3. The and
exchange rate misalignment uncertainty using the ARCH and GARCH approach
Table A4. The and
exchange rate misalignment uncertainty using the ARCH as well as the ARCH approach and HP filter