
 ?Mathematical formulae have been encoded as MathML and are displayed in this HTML version using MathJax in order to improve their display. Uncheck the box to turn MathJax off. This feature requires Javascript. Click on a formula to zoom.
Abstract
This paper explores the spatial concentration of 120 service industries in India’s rural and urban areas, covering 33.60 million establishments using Economic census (2013) data at the district level. Besides, this study uses a cartogram map to examine knowledge-intensive business services (KIBS) industries’ spatial concentration patterns and geographical concentration of employment of workers in rural and urban areas in India. Empirical results show that the magnitude of the spatial concentration effect varies in rural and urban areas. Further, empirical results reveal that KIBS industries are localized in rural and urban areas but have a skewed distribution toward urban areas. Moreover, results show that hotspots in rural areas seem higher than urban hotspots, although rural hotspots employ fewer employees than urban hotspots. The empirical results suggest that urban planners and district municipal authorities can give more emphasis and implement suitable KIBS industry-specific policies to boost regional economic growth and employment in rural and urban India.
PUBLIC INTEREST STATEMENT
The spatial concentration of service sector operations is a globally prevalent phenomenon. As service industries demand face-to-face consumer engagement, businesses must locate near their customers. Knowledge-intensive business services (KIBS) have been acknowledged within the service sectors for their critical contribution to innovation systems and their role in encouraging regional and national economic growth. The rural-urban split accounts for a significant portion of India’s geographical inequality. This study serves the public interest by revealing that KIBS industries have a disproportionate distribution of workers in urban areas. Furthermore, KIBS industries are highly concentrated geographically, particularly in a few regions. This research assists urban planners and district authorities in developing suitable regulations for each KIBS industry while keeping spatial concentration trends across Indian districts in mind.
1. Introduction
1.1. Contextualization and motivation
One of the central issues in economic geography is empirically investigating the geographical concentration of economic activity. The foundational concepts of the factors contributing to geographic concentration may be traced back to the seminal research conducted by Marshall (Citation1890). Marshall (Citation1890) posited that the phenomenon of geographical agglomeration had a significant impact on business productivity, primarily through the mechanisms of input sharing, labor market pooling, and knowledge spillovers. According to Jacobs (Citation1969), diverse regional economic activities are believed to promote innovation and growth through inter-industry spillovers rather than intra-industry spillovers.
Krugman (Citation1991) outlined the fundamental principles of “New Economic Geography” and developed a spatial economic model to elucidate the agglomeration process. The model proposed by Krugman is founded upon the framework established from Dixit and Stiglitz’s (Citation1977) seminal work, which explores the concept of imperfect competition and the presence of increasing returns to scale. According to Krugman’s model, the agglomeration of industrial activity across enterprises occurs when significant internal economies of scale and low transportation costs exist. There are likely many reasons for industries’ geographical concentration, mainly due to nature’s first and second determinants (Krugman, Citation1993).Footnote1 However, from an economist’s perspective, the variables contributing to spatial concentration are not the exclusive focus of attention. Nevertheless, the central focus of the discussion revolves around the measurement of localization and the comprehension of spatial concentration patterns within industries. This paper deals with the second aspect, particularly localization and the spatial concentration patterns of 120 service-sector industries in India at a district level.
The empirical literature advocates that the agglomeration of industries has a positive causal effect on firms’ productivity (Combes & Gobillon, Citation2015; Graham et al., Citation2010). Although agglomeration leads to productivity by uneven allocation of resources, spatial inequality increases as many areas lag and are detrimental to aggregate growth (Barca et al., Citation2012). The rural-urban divide accounts for a large share of spatial inequality in India (Joumard et al., Citation2017). Regional inequality is of interest not only for equity reasons but also for economic development (Achten & Lessmann, Citation2020).
It is acknowledged that many existing studies consider manufacturing industries’ geographical concentration in developing countries, but the service sector is not usually explored. The service industries require face-to-face communication with clients to solve their business problems, leading to knowledge spillovers. Compared to manufacturing industries, business services do not rely on physical inputs, and service transactions mostly happen in person, making it relevant for firms to locate near their customers (Kolko, Citation2010). The empirical literature (DiGiacinto et al., Citation2020; Wood, Citation2009) recognized innovation in the service sector is also relevant to the growth and competitiveness of regional economies. Mainly, knowledge-intensive business services (KIBS), a subsector of knowledge-intensive services (KIS) industries,Footnote2 are instrumental in fostering the innovation and competitiveness of firms (Miles et al., Citation2018; Muller & Zenker, Citation2001).Footnote3
1.2. Why India?
Most of the existing literature in the Indian context was based on analyzing trade liberalization, FDI, productivity, and technology spillover across Indian manufacturing industries (Behera, Citation2014; Behera, Citation2015a, Citation2015b; Behera et al., Citation2012; Goldar et al., Citation2020). Further, some specific studies discussed the regional dimension of FDI, technology spillover, agglomeration, and spatial concentration of Indian manufacturing industries (Agarwal & Behera, Citation2023; Behera, Citation2017; Dua et al., Citation2011). Moreover, in the Indian context, the primary emphasis of their scholarly investigations revolved around the industrial sector, whereas the Indian service sector was mainly overlooked. In the fiscal year 2019–20, the service sector accounted for more than 54% of India’s Gross Domestic Product (GDP) and received almost 80% of the total Foreign Direct Investment (FDI) inflows into the country (Economic Survey Citation2020Citation–21, Vol. 2). Desmet et al. (Citation2015) conducted a study that investigates the geographical growth of India’s service industry, which later brought attention to the significance of the service sector. The geographical structure of the Indian industry was investigated by Ghani et al. (Citation2016) through an examination of both rural and urban locations over the period from 2001 to 2010. Their study demonstrates a tendency for services industries to concentrate in metropolitan areas, with easy access to human capital and technology adoption playing significant roles in this process. More recently, Agarwal and Behera (Citation2023) explored the spatial distribution and geographical concentration of 71 manufacturing industries by capturing the neighborhood effects in rural and urban India. Further, Agarwal and Behera (Citation2022a, Citation2022b, Citation2022c) analyzed the geographical concentration of Indian manufacturing and Knowledge and technology-intensive industries. Nevertheless, it is worth noting that KIBS industries provide significant prospects for regional economic expansion and positively influence the efficiency of many sectors, such as manufacturing and service industries (Pina & Tether, Citation2016; Shearmur & Doloreux, Citation2019).
However, to the best of our knowledge, none of the existing studies assesses the service sector, particularly the KIBS industry’s spatial concentration and geographical distribution of employment of workers, using Economic census data covering rural and urban areas at a district level in India. The rural-urban nexus motivates us to empirically evaluate the spatial concentration patterns of service sector industries in rural and urban areas in India. This prompted us to explore further research, specifically focusing on KIBS industries at a district level across various states of India, using 33.60 million establishments from the available Economic Census (2013) data.
2. Literature review
Since the mid-1990s, there has been a notable increase in scholarly interest in KIBS industries. This heightened focus may be attributed to the rapid growth of KIBS, surpassing that of manufacturing and other service sectors. Further, KIBS industries have been recognized for their crucial contribution to innovation systems and their role in fostering regional and national economic development (Javalgi & Grossman, Citation2014; Muller & Zenker, Citation2001).
Agglomeration economies, known as localization economies, can provide advantages for firms operating within the same industry. The localization economies are external to individual firms and usually pertinent to firms within the same industry. According to Jacobs (Citation1969), the hypothesis posits that economic development is facilitated by the collective concentration of economic activity, known as “urbanization economies,” rather than by specialization. Urbanization economies hold greater significance in the KIBS context than manufacturing industries. This is primarily because of the crucial role of close interaction between KIBS providers and their customers in the production and innovation processes. Agglomeration economies are influenced by three primary mechanisms, as identified by Duranton and Puga (Citation2004). These mechanisms include sharing, which refers to the ability to share local public goods; matching, which pertains to the facilitation of connections between firms and workers in dense labor markets; and learning, which involves the generation of localized knowledge spillovers through face-to-face interactions between workers and firms. The significance of the learning force is particularly evident in the context of KIBS industries, given their distinctive production and innovation processes, as previously discussed.
Duranton and Overman (Citation2005) illustrate that KIBS can mainly drive urban agglomeration economies with labor market interactions. Moreover, Shearmur and Doloreux (Citation2008) examined the relationship between KIBS industries’ spatial distribution and regional economic structure. Their analysis uses a sample of 152 urban agglomerations and 230 rural areas in Canada from 1991 to 2001. Jacobs et al. (Citation2014) examined the metropolitan region of Amsterdam in the Netherlands and found evidence of co-agglomeration between KIBS and the existence of multinational firms. Corrocher and Cusmano (Citation2014) demonstrate that KIBS plays a crucial role in innovation systems and economic growth throughout 220 European regions, specifically emphasizing advanced areas. Ciriaci et al. (Citation2015) show that KIBS industries substantially influence innovation in knowledge-based and manufacturing sectors. This conclusion is drawn from analyzing 18 manufacturing sectors across four European nations (France, Germany, Italy, and the UK) from the mid-1990s to the mid-2000s. Meliciani and Savona (Citation2015) examine the impact of downstream demand linkages on the local development of knowledge-intensive service activities. These authors present evidence indicating a positive and significant influence of the regional diffusion of industries that heavily rely on knowledge-intensive services as productive inputs. The study conducted by Yum (Citation2019) employs a cluster quotient (CQ) index to investigate the spatial distribution of KIBS industries throughout the United States Metropolitan Statistical Areas (MSAs) and their significant contribution to economic growth in the United States.
In the context of India, particularly in relevance to the knowledge economy, researchers mainly focus on the Information Technology (IT) industry. Khomiakova (Citation2007) studied multiple IT cluster development in India, and Grondeau (Citation2007) examined the characteristics of ICT clusters, mainly focusing on Bangalore and Hyderabad clusters. Lorenzen and Mudambi (Citation2013) propose that clusters linked to the global economy through decentralized network structures have the most potential for local spillovers. Their empirical study considers IT clusters in Bangalore and the Indian film entertainment cluster (Bollywood) in Mumbai. Nevertheless, to our best understanding, none of the previous literature examines the spatial concentration of KIBS industries across rural and urban Indian districts. Hence, this study addresses the existing research void in agglomeration studies by quantifying the level of geographical concentration in KIBS industries. Additionally, it aims to visually explore and analyze the spatial distribution and clustering patterns of these industries across different districts in India.
3. Data and methodology
The study has used the sixth economic census data of 2013–14 to evaluate the spatial concentration patterns of service industries in rural and urban areas in India.Footnote4 The Economic Census (EC) is a countrywide census of manufacturing and service sector establishments (Central Statistics Office, Citation2013) in India. The empirical analysis is carried out by selecting 120 service industries at a 3-digit level according to the National Industrial Classification (NIC-2008) report.Footnote5 The spatial scale used is at the district level, but the data is collected for various establishments to do micro-level analysis. Table reports that 16.57 million establishments in the rural area employed 31.35 million workers. Similarly, 17.03 million establishments in the urban area employed 42.43 million workers in the service sector.
Table 1. Summary of employment and establishment in service industries
To measure the extent of geographical concentration, Ellison and Glaeser (Citation1997) developed an index that derives its value from a random location choice model (Dauth et al., Citation2018). Arbia (Citation2001) and Lafourcade and Mion (Citation2007) noted that the localization measures do not consider spatial dependence and suffer from a “checkerboard problem.”Footnote6 To capture neighboring effects, Guimaraes et al. (Citation2011) extended the original Ellison-Glaeser (EG) index, and so the modified spatially weighted version of the EG index is given as follows:
where represent the spatially weighted geographical concentration index
and
denotes a spatial weight matrix (
, where
is a weight matrix.
represent the identity matrix. The index reduces to the original EG (Citation1997) index when
. We construct spatial weight matrices using the queen contiguity weight matrix for spatial analysis.Footnote7
Further, for robustness checking of spatial autocorrelation, we employ Moran’s I index (Atems, Citation2013), which calculates the correlation between the employment in a spatial unit (district) and the weighted employment in its neighboring spatial units.Footnote8 The computational method of Moran’s I statistic is given as follows:
where represents the total number of workers employed by the industry in the
unit and
represents the total number of workers employed by the industry in the
neighboring unit, and
represents the industry’s average employment. The global Moran’s I index interprets as a regression coefficient, i.e., corresponds to a slope of a linear regression of
on
.Footnote9 The interdependence modeling between regions uses the spatial weight matrix,
. The matrix gives each element
, and the importance of location
to location
is as follows:
The matrix is symmetric and non-negative by assuming that
for all pairs of districts. For spatial analysis, we apply the queen contiguity weight matrix.Footnote10 A first-order queen’s contiguity rule is constructed by assuming the convention that
when
and
are neighbors and
otherwise.Footnote11 In addition to estimating the geographical concentration and spatial autocorrelation, we further check the local spatial patterns of service industries and where cluster formation occurs by using the Local Indicators of Spatial Autocorrelation (LISA) technique followed by Anselin (Citation1995, Citation2019).
4. Empirical results
4.1. Spatial concentration of service industries in rural and urban India
Tables report the estimated results showing India’s top 10 high and least-localized service industries in rural and urban areas.Footnote12 Results reported in Table show that in rural areas, the industry group which is among the highly localized includes administrative & support activities (NIC-774, 783, and 813), professional, scientific and technical activities (NIC-702 and 722), and transportation and storage (NIC-493, and 512). In contrast, for urban areas, highly localized industries include professional, scientific & technical activities (NIC-702, 711, 712, and 732), administrative & support activities (NIC-774, 813, and 822), and information and communication (NIC-582 and 620). Moreover, results reveal that five industries (NIC-620, 774, 702, 512, and 813) out of 10 highly localized industries are common in rural and urban areas. However, the magnitude of spatial concentration of these industries is dissimilar.Footnote13
Table 2. Ten Highly localized service industries in India
Table 3. Ten Least localized service industries in India
The estimated results reported in Table show the least localized industries in rural areas are retail trade except for motor vehicles (NIC-472-474), education (NIC-851-852), and other service activities (NIC-952 and 960). In contrast, the least localized industries in the urban area are retail trade except for motor vehicles (NIC-472, 473, 475, and 477) and other service activities (NIC-952 and 960), respectively. Further, results exhibit that five industries (NIC-472, 473, 531, 742, and 960) are among the top 10 least localized industries common to rural and urban areas (see Table ). However, the concentration effect seems similar across these industries.
Empirical literature (Audretsch et al., Citation2020; Wood, Citation2009) suggests that innovation is crucial for regional economic growth. Therefore, it is our empirical interest to classify the top ten high and least localized service industries (see Tables ) into knowledge-intensive services (KIS) and less knowledge-intensive services (LKIS) industries, respectively.Footnote14 Within KIS, sub-sectors like knowledge-intensive-business services (KIBS) industries play a critical role in innovation (Jacobs et al., Citation2014).Footnote15 Further, within KIBS industries, 87% of the employment of workers and 84% of the establishment of KIBS industries are located in urban areas.Footnote16 This indicates that KIBS industries’ spatial distribution of workers in the urban regions is more skewed than in rural areas, consistent with the existing studies for developed countries (DiGiacinto et al., Citation2020; Duranton & Overman, Citation2005). Therefore, this suggests that regional-level culture, human capital endowments, proximity to technical institutions and universities, and innovation policies are essential in determining KIBS firms’ plant and business location in rural and urban India.
Table reveals that six belong to KIS among the 10 most localized industries in rural areas, and four belong to LKIS.Footnote17 Further, results indicate that three KIS industries belong to the KIBS (NIC-620, 702, and 722) industries, respectively. In contrast, seven out of 10 most localized industries belong to KIS in urban areas, and five belong to KIBS industries, respectively.Footnote18 More specifically, computer programming, consultancy and related activities, fund management activities, management consultancy activities, and research and experimental development on social sciences and humanities are KIBS industries that seem highly localized in rural and urban areas. Table reveals that out of the 10 least localized industries, seven concentrated in rural and eight in urban areas belong to less knowledge-intensive services (LKIS) industries, respectively.Footnote19
4.2. Robustness checks
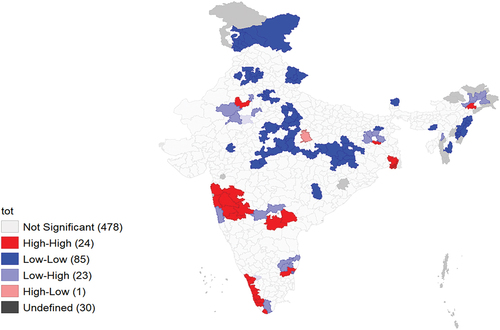
As we discussed before, KIBS industries play a pivotal role in innovation, regional economic growth, and spatial concentration of employment of workers in urban regions seems much higher than in the rural areas in India. Therefore, this needs a robust investigation of the service sector’s spatial dependence and concentration patterns exclusively specific to KIBS industries in India. Nevertheless, we have used the Moran I scatterplot and, later on, the LISA cluster map for more robustness checks of India’s spatial dependence and hotspots and coldspots employment clusters of KIBS industries in India. Figures depict the Moran I scatterplot for KIBS industries in rural and urban areas. The Moran’s I estimated value for rural areas is 0.002, which seems equal to zero, indicating spatial randomness. In contrast, Moran’s I estimated value in the urban area is 0.339, significantly different from zero, indicating spatial dependence.Footnote20 Further, we apply the LISA technique to evaluate the evidence of local spatial patterns for KIBS industries in India. Figures and 4 portray the Local Moran’s I cluster map for KIBS industries in rural and urban areas. In the rural area, red shows hotspots (high-high employment) in 24 districts, and blue shows cold spots (low-low employment) in 85 districts.
Figure 1. Moran’s I scatterplot of spatial employment of KIBS industries in the rural areas.
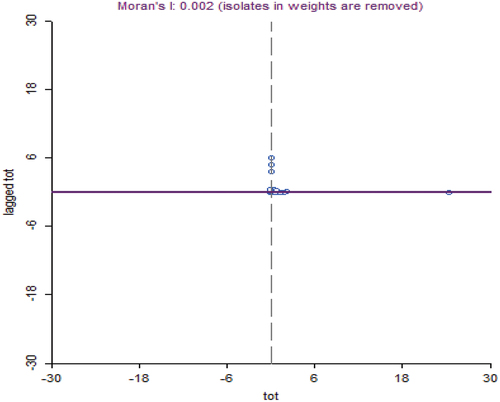
Figure 2. Moran’s I scatterplot of spatial employment in the urban areas.
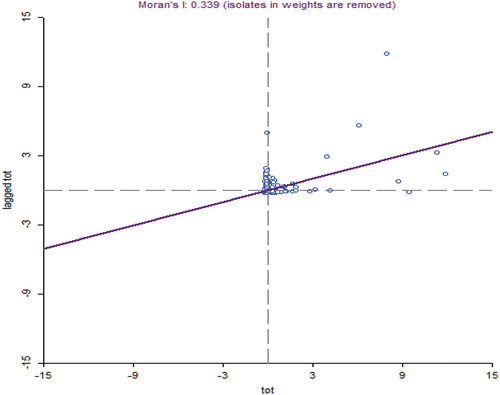
Figure 3. Local Moran’s I cluster map for KIBS industries in rural areas.
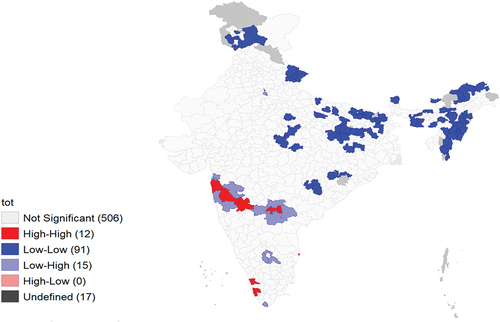
In contrast, 12 districts have hotspots, and 91 districts have cold spots in urban areas of India.Footnote21 Figures show that hotspots in rural areas differ from urban areas. Further, it is evident from the results presented in Tables (see Appendix) that there is a notable disparity in the total number of workers employed between rural hotspots (24 districts) and urban hotspots (12 districts). However, the rural hotspot regions have fewer number of workers employed than the urban hotspot regions. This suggests that the centripetal forces driving the clustering of industries, such as buyer-supplier connections, labor market consolidation, knowledge diffusion, cost-effective labor, and resource availability, as well as the centrifugal pressures, including elevated transportation expenses and congestion, exhibit dissimilar characteristics in rural and urban regions. Besides, previous studies conducted by Jacobs etal. (Citation2013) and Shearmur and Doloreux (Citation2008) revealed that KIBS industries tend to concentrate in Metropolitan Statistical Areas (MSAs). This concentration can be attributed to the benefits derived from agglomeration, including the sharing of inputs, the availability of a specialized workforce, and knowledge spillovers. From a policy perspective, it is imperative to give direct attention to the spatial distribution of KIBS industries in metropolitan regions to enhance employment generation and foster economic growth in labor-abundant countries like India. Further, our preceding empirical analysis (see Section 4.1) indicates that the distribution of workers engaged in KIBS industries is disproportionately concentrated in urban rather than rural regions. Hence, our subsequent empirical focus is to analyze the spatial concentration patterns of KIBS industries in urban areas.
Figure 4. Local Moran’s I cluster map for KIBS industries in urban areas.
4.3. Spatial concentration patterns of KIBS industries (urban area)
As we empirically analyze, the employment distribution of workers engaged in urban hotspots seems higher than in the rural hotspot regions. Therefore, this motivates us to examine further the spatial concentration patterns of KIBS industries across various urban districts/regions in India. Specifically, we have selected the five KIBS industries that exhibit high localization in urban areas (refer to Table ). To evaluate the spatial distribution patterns, it is necessary to compute the Spatially Weighted Ellison-Glaeser index (EGSPAT) index for a specific in each district
. The EGSPAT index, denoted as
, is determined by the product of
and
, which is given as follows:
where represents the Spatially Weighted Ellison-Glaeser index (EGSPAT) for industry (i) and
represents the proportion of employment in the
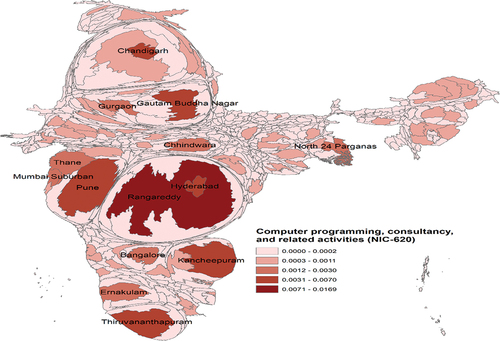
industry within district (j). To depict the spatial distribution of KIBS industries across various districts of India, we adopt an equal-area cartogram, wherein the size of each district is scaled proportionally to the number of workers engaged in KIBS industries. Cartograms are a valuable and intuitive tool for representing statistical information about administrative regions, wherein the size of each region is proportional to a given geographic characteristic (Sun & Li, Citation2010; Wood & Dykes, Citation2008). Further, following Jenks’s (Citation1967) Natural Breaks optimization technique, we have classified the total workforce engaged in KIBS industries into five distinct class intervals. These intervals are visually represented on a cartogram using five different colors. Figure displays the districts with significant expansion in the cartogram for the Management consultancy operations (NIC-702) industry. These districts include Koriya, Bangalore, Deoghar, Jamtara, Solapur, Vadodara, Mandi, Sivasagar, Mahesana, Mumbai, Mumbai Suburban, Chhindwara, Dibrugarh, and Jamui. The results illustrate the highest concentration of worker employment confined to these 14 districts within the urban region. Similarly, Figure demonstrates that the districts of Bangalore, Singrauli, New Delhi, Korba, Dibrugarh, Udupi, and Chhindwara exhibit the highest concentration of employment in the Architectural and engineering activities and associated technical consultation (NIC-711) industry. Figure depicts the spatial concentration patterns with the highest concentration of employment for the Market research and public opinion polling industry (NIC-732) across the various districts Chhindwara, Mumbai, Mumbai Suburban, Khammam, Purnia, Sitapur, Ernakulam, North West, and Thane. In a similar vein, Figures depict the regions of Vadodara, Kachchh, Bangalore, The Dangs, Dakshin Bastar Dantewada, Marigaon, Badgam, Dibrugarh, and Gurdaspur for the technical testing and analysis (NIC-712), and Rangareddy, Pune, Thiruvananthapuram, Gautam Buddha Nagar, Chandigarh, Kancheepuram, and Hyderabad for computer programming, consultancy, and related activities (NIC-620) industry correspondingly. Further, this study aims to identify the individual districts where spatial concentration is evident. The results suggest that the spatial concentration patterns of the KIBS industries in urban areas are confined to a few districts. This indicates that the agglomeration forces have greater strength in some regions. This information can be valuable for urban planners and governments in developing targeted policies suited to each KIBS industry.
Figure 5. Spatial concentration patterns for management consultancy activities (NIC-702) industry across various districts in India.
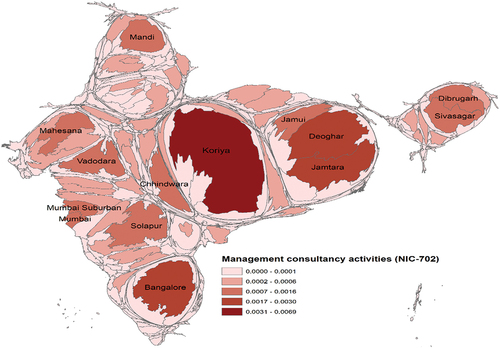
Figure 6. Spatial concentration patterns for Architectural and engineering activities and related technical consultancy (NIC-711) industry across various districts in India.
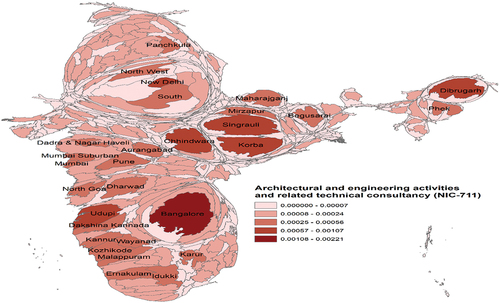
Figure 7. Spatial concentration patterns for market research and public opinion polling (NIC-732) industry across various districts in India.
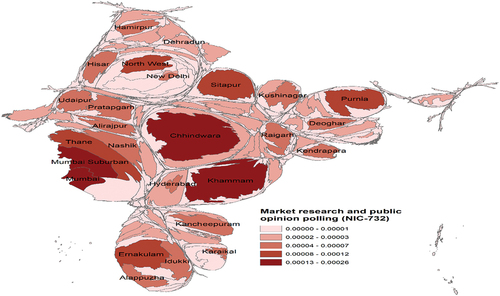
Figure 8. Spatial concentration patterns for technical testing and analysis (NIC-712) industry across various districts in India.
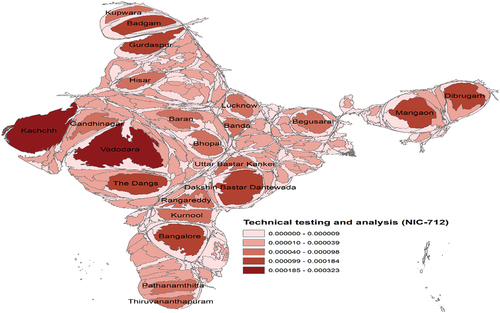
Figure 9. Spatial concentration patterns for Computer programming, consultancy, and related activities (NIC-620) industry across various districts in India.
5. Conclusions
This study has investigated the spatial concentration patterns of 120 service-sector industries using Moran’s I index, LISA technique, and spatially weighted Ellison-Glaeser index by covering 637 districts and 33.60 million establishments in the rural and urban areas at the district level in India. We find that the magnitude of the spatial concentration of service industries is varied, specific to certain industries in rural and urban India. Moreover, empirical findings indicate that the distribution of KIBS industries is geographically skewed towards urban regions. Further, it is worth noting that the prevalence of hotspots in rural areas surpasses in urban areas. However, it is essential to acknowledge that the overall workforce employed in rural hotspots is significantly smaller than in urban hotspots. Hence, the present study further examined the spatial concentration patterns of KIBS industries within urban areas in India. Utilizing a cartogram map, we have identified the districts where a notable spatial concentration of employees of the KIBS industries is spatially visible. Our results in this study suggest that KIBS industries exhibit a high degree of geographical concentration, primarily in a specific few districts. This empirical consequence implies that the forces driving agglomeration play a substantial role in shaping the spatial distribution of KIBS industries, particularly in specific locations. Therefore, formulating appropriate policies for each KIBS industry aids urban planners and district authorities in fostering regional economic growth and ample creation of job opportunities, particularly for a labor-abundant emerging economy like India.
Acknowledgements
We acknowledge our great sense of generosity for the insightful comments and suggestions of both anonymous reviewers of the journal. We would also like to thank Caroline Elliott, Editor-in-Chief of the journal, for allowing us to revise this paper.
Data availability statement
The datasets used in this paper will be available after reasonable request to the corresponding author.
Disclosure statement
No potential conflict of interest was reported by the author(s).
Notes
1. The nature first determinants includes resource endowments, climate, and physical geography, and the nature second determinants includes factor mobility, market size, and infrastructure.
2. Note that KIS and KIBS are part of the service industries, and these industries play a substantial role for employment generation, innovation, and regional economic growth in India.
3. We are following Eurostat (Citation2008) and Schnabl and Zenker (Citation2013) for the identification of KIBS industries based on the three-digit NIC (2008) classification of economic activities. For more details, see Table (Appendix A).
4. Data published by the Central Statistics Office, Ministry of Statistics and Programme Implementation (MOSPI) of India.
5. NIC is a standard classification comparable to that of International Industrial classification standards. NIC is essential to maintain and develop a database of different economic activities of industries.In NIC (2008) report, section g to section s represents the classification of 120 service-sector industries.
6. For more details, see Griffith (Citation1983).
7. A first-order queen’s contiguity rule is constructed by assuming the convention that = 1 when
and
are neighbours (when a polygon shares a vertex or an edge) and
= 0 otherwise.
8. Arauzo-Carod (Citation2007) used the Moran’s I indicator to measure the spatial autocorrelation at a local level in Catalonia.
9. represents the spatial lag effect of a variable
where
represents the spatial weight matrix, which captures the average neighbour effect.
10. Using the spmat command created by Drukker et al. (Citation2013), we calculate the queen contiguity weight matrix in Stata 14.
11. The queen contiguity weight matrix gets a value of 1 when a polygon shares a vertex or an edge.
12. The classification is based on the estimated values of the spatially weighted EG index for the service industry at a 3-digit level.
13. For example, NIC-620 is a highly localized industry having a spatially weighted Ellison-Glaeser (EGSPAT) index value of 0.571 in a rural area, while it is the 9th most localized industry in the case of the urban area with EGSPAT index value is 0.075.
14. We are following Eurostat (Citation2008) for the identification of KIS and LKIS industries based on the three-digit NIC (2008) classification of economic activities. For more details, see Table (Appendix A).
15. KIBS includes divisions from 62 to 63 and 69 to 73 followed by the NIC-2008 code. For more details, see Table (Appendix A).
16. See Table , Appendix A.
17. KIS includes the industries as noted by NIC-512, 620, 663, 702, 722, and 783, while LKIS industries include NIC-493, 774, 813, and 942.
18. KIBS industries mainly belong to professional, scientific, and technical activities (NIC-702, 711, 712, and 732), and Computer programming, consultancy, and related activities (NIC 620).
19. In the rural areas, NIC-472, 473, 474, 531, 772, 952, and 960 and in urban areas, NIC-452, 472, 473, 475, 477, 531, 951, and 960 are less knowledge-intensive services (LKIS) industries, respectively.
20. Moran’s I index pseudo-p-value for rural and urban areas is 0.138 and 0.001, respectively. Results obtained by randomizing 99,999 times in Geoda software.
21. See Tables in Appendix A for a detailed discussion of districts having high-high employment in rural and urban areas, respectively.
References
- Achten, S., & Lessmann, C. (2020). Spatial inequality, geography, and economic activity. World Development, 136, 105114. https://doi.org/10.1016/j.worlddev.2020.105114
- Agarwal, S., & Behera, S. R. (2022a). Do knowledge and technology-intensive industries spatially concentrate in rural and urban areas of India? Evidence from economic census micro-level data. Theoretical Economics Letters, 12(4), 1095–19. https://doi.org/10.4236/tel.2022.124060
- Agarwal, S., & Behera, S. R. (2022b). Do neighbourhood effects matter for the geographical concentration? Evidence from the Indian industries. Theoretical Economics Letters, 12(4), 1007–1033. https://doi.org/10.4236/tel.2022.124055
- Agarwal, S., & Behera, S. R. (2022c). Geographical concentration of knowledge and technology-intensive industries in India: Empirical evidence from establishment-level analysis. Indian Economic Review, 57(2), 1–40. https://doi.org/10.1007/s41775-022-00145-w
- Agarwal, S., & Behera, S. R. (2023). Location and geographical concentration patterns of Indian manufacturing industries: Evidence from the rural and urban areas. The Singapore Economic Review, 1–45. https://doi.org/10.1142/S0217590823500388
- Anselin, L. (1995). Local indicators of spatial association—LISA. Geographical Analysis, 27(2), 93–115. https://doi.org/10.1111/j.1538-4632.1995.tb00338.x
- Anselin, L. (2019). A local indicator of multivariate spatial association: Extending Geary’s C. Geographical Analysis, 51(2), 133–150. https://doi.org/10.1111/gean.12164
- Arauzo-Carod, J. M. (2007). A note on spatial autocorrelation at a local level. Applied Economics Letters, 14(9), 667–671. https://doi.org/10.1080/13504850500461472
- Arbia, G. (2001). The role of spatial effects in the empirical analysis of regional concentration. Journal of Geographical Systems, 3(3), 271–281. https://doi.org/10.1007/PL00011480
- Atems, B. (2013). The spatial dynamics of growth and inequality: Evidence using US county-level data. Economics Letters, 118(1), 19–22. https://doi.org/10.1016/j.econlet.2012.09.004
- Audretsch, D. B., Kritikos, A. S., & Schiersch, A. (2020). Microfirms and innovation in the service sector. Small Business Economics, 55(4), 997–1018. https://doi.org/10.1007/s11187-020-00366-4
- Barca, F., McCann, P., & Rodríguez-Pose, A. (2012). The case for regional development intervention: Place-based versus place-neutral approaches. Journal of Regional Science, 52(1), 134–152. https://doi.org/10.1111/j.1467-9787.2011.00756.x
- Behera, S. R. (2014). Local firms productivity spillover from foreign direct investment: A study of Indian manufacturing industries. International Journal of Technological Learning, Innovation and Development, 7(2), 167–190. https://doi.org/10.1504/IJTLID.2014.065883
- Behera, S. R. (2015a). Do domestic firms really benefit from foreign direct investment? The role of horizontal and vertical spillovers and absorptive capacity. Journal of Economic Development, 40(2), 57. https://doi.org/10.35866/caujed.2015.40.2.003
- Behera, S. R. (2015b). Technology spillover and determinants of foreign direct investment: An analysis of Indian manufacturing industries. Journal of Economic Development, 40(3), 55–83. https://doi.org/10.35866/caujed.2015.40.3.003
- Behera, S. R. (2017). Regional foreign direct investment and technology spillover: Evidence across different clusters in India. Economics of Innovation & New Technology, 26(7), 596–620. https://doi.org/10.1080/10438599.2016.1254850
- Behera, S. R., Dua, P., & Goldar, B. (2012). Foreign direct investment and technology spillover: Evidence across Indian manufacturing industries. The Singapore Economic Review, 57(2), 1250011. https://doi.org/10.1142/S0217590812500117
- Central Statistics Office. (2013). All India report of sixth economic census. 1–239.
- Ciriaci, D., Montresor, S., & Palma, D. (2015). Do KIBS make manufacturing more innovative? An empirical investigation of four European countries. Technological Forecasting & Social Change, 95, 135–151. https://doi.org/10.1016/j.techfore.2015.02.008
- Combes, P. P., & Gobillon, L. (2015). The empirics of agglomeration economies. In Handbook of regional and Urban Economics (vol (Vol. 5, pp. 247–348). Elsevier.
- Corrocher, N., & Cusmano, L. (2014). The ‘KIBS engine’ of regional innovation systems: Empirical evidence from European regions. Regional Studies, 48(7), 1212–1226. https://doi.org/10.1080/00343404.2012.731045
- Dauth, W., Fuchs, M., & Otto, A. (2018). Long‐run processes of geographical concentration and dispersion: Evidence from Germany. Papers in Regional Science, 97(3), 569–593. https://doi.org/10.1111/pirs.12271
- Desmet, K., Ghani, E., O’Connell, S., & Rossi‐Hansberg, E. (2015). The spatial development of India. Journal of Regional Science, 55(1), 10–30. https://doi.org/10.1111/jors.12100
- DiGiacinto, V., Micucci, G., & Tosoni, A. (2020). The agglomeration of knowledge-intensive business services firms. The Annals of Regional Science, 65(3), 557–590. https://doi.org/10.1007/s00168-020-00995-3
- Dixit, A. K., & Stiglitz, J. E. (1977). Monopolistic competition and optimum product diversity. The American Economic Review, 67(3), 297–308.
- Drukker, D. M., Peng, H., Prucha, I. R., & Raciborski, R. (2013). Creating and managing spatial-weighting matrices with the spmat command. The Stata Journal, 13(2), 242–286. https://doi.org/10.1177/1536867X1301300202
- Dua, P., Behera, S. R., & Goldar, B. (2011). Foreign direct investment and technology spillover: An evaluation across different clusters in India. CDE.
- Duranton, G., & Overman, H. G. (2005). Testing for localization using micro-geographic data. The Review of Economic Studies, 72(4), 1077–1106. https://doi.org/10.1111/0034-6527.00362
- Duranton, G., & Puga, D. (2004). Micro-foundations of urban agglomeration economies. Handbook of Regional and Urban Economics, 4, 2063–2117.
- Ellison, G., & Glaeser, E. L. (1997). Geographic concentration in US manufacturing industries: A dartboard approach. Journal of Political Economy, 105(5), 889–927. https://doi.org/10.1086/262098
- Eurostat, N. A. C. E. (2008). Rev. 2–statistical classification of economic activities in the European community. In Office for official publications of the European communities. Luxemburg.
- Ghani, E., Grover, A., & Kerr, W. (2016). Spatial development and agglomeration economies in services–lessons from India. Policy Research Working Paper No. 7741. World Bank,
- Goldar, B., Chawla, I., & Behera, S. R. (2020). Trade liberalization and productivity of Indian manufacturing firms. Indian Growth and Development Review, 13(1), 73–98. https://doi.org/10.1108/IGDR-10-2018-0108
- Graham, D. J., Melo, P. S., Jiwattanakulpaisarn, P., & Noland, R. B. (2010). Testing for causality between productivity and agglomeration economies. Journal of Regional Science, 50(5), 935–951. https://doi.org/10.1111/j.1467-9787.2010.00676.x
- Griffith, D. A. (1983). The boundary value problem in spatial statistical analysis. Journal of Regional Science, 23(3), 377–387. https://doi.org/10.1111/j.1467-9787.1983.tb00996.x
- Grondeau, A. (2007). Formation and emergence of ICT clusters in India: The case of Bangalore and Hyderabad. GeoJournal, 68(1), 31–40. https://doi.org/10.1007/s10708-007-9051-6
- Guimaraes, P., Figueiredo, O., & Woodward, D. (2011). Accounting for neighbouring effects in measures of spatial concentration. Journal of Regional Science, 51(4), 678–693. https://doi.org/10.1111/j.1467-9787.2011.00723.x
- Jacobs, J. (1969). Strategies for helping cities. The American Economic Review, 59(4), 652–656.
- Jacobs, W., Koster, H. R., & van Oort, F. (2014). Co-agglomeration of knowledge-intensive business services and multinational enterprises. Journal of Economic Geography, 14(2), 443–475. https://doi.org/10.1093/jeg/lbs055
- Javalgi, R. R. G., & Grossman, D. A. (2014). Firm resources and host‐country factors impacting internationalization of knowledge‐intensive service firms. Thunderbird International Business Review, 56(3), 285–300. https://doi.org/10.1002/tie.21622
- Jenks, G. F. (1967). The data model concept in statistical mapping. International Yearbook of Cartography, 7, 186–190.
- Joumard, I., Morgavi, H., & Bourrousse, H. (2017). Achieving strong and balanced regional development in India (No. 1412). OECD Publishing.
- Khomiakova, T. (2007). Information technology clusters in India. Transition Studies Review, 14(2), 355–378. https://doi.org/10.1007/s11300-007-0147-y
- Kolko, J. (2010 5). Urbanization, agglomeration, and coagglomeration of service industries. In Agglomeration economics (pp. 151–180). University of Chicago Press
- Krugman, P. (1991). Increasing returns and economic geography. Journal of Political Economy, 99(3), 483–499. https://doi.org/10.1086/261763
- Krugman, P. (1993). First nature, second nature, and metropolitan location. Journal of Regional Science, 33(2), 129–144. https://doi.org/10.1111/j.1467-9787.1993.tb00217.x
- Lafourcade, M., & Mion, G. (2007). Concentration, agglomeration, and the size of plants. Regional Science and Urban Economics, 37(1), 46–68. https://doi.org/10.1016/j.regsciurbeco.2006.04.004
- Lorenzen, M., & Mudambi, R. (2013). Clusters, connectivity, and catch-up: Bollywood and Bangalore in the global economy. Journal of Economic Geography, 13(3), 501–534. https://doi.org/10.1093/jeg/lbs017
- Marshall, A. (1890). Principles of Economics (First ed.). Macmillan and Co. Limited.
- Meliciani, V., & Savona, M. (2015). The determinants of regional specialization in business services: Agglomeration economies, vertical linkages, and innovation. Journal of Economic Geography, 15(2), 387–416. https://doi.org/10.1093/jeg/lbt038
- Miles, I. D., Belousova, V., & Chichkanov, N. (2018). Knowledge-intensive business services: Ambiguities and continuities. Foresight, 20(1), 1–26. https://doi.org/10.1108/FS-10-2017-0058
- Ministry of Finance, Government of India, ”Economic Survey”. (2020–21). (Vol. 2). Department of Economic Affairs, Ministry of Finance, Government of India.
- Muller, E., & Zenker, A. (2001). Business services as actors of knowledge transformation: The role of KIBS in regional and national innovation systems. Research Policy, 30(9), 1501–1516. https://doi.org/10.1016/S0048-7333(01)00164-0
- Pina, K., & Tether, B. S. (2016). Towards understanding variety in knowledge-intensive business services by distinguishing their knowledge bases. Research Policy, 45(2), 401–413. https://doi.org/10.1016/j.respol.2015.10.005
- Schnabl, E., & Zenker, A. (2013). Statistical classification of knowledge-intensive business services (KIBS) with NACE Rev. 2. Fraunhofer ISI.
- Shearmur, R., & Doloreux, D. (2008). Urban hierarchy or local buzz? high-order producer service and (or) knowledge-intensive business service location in Canada, 1991–2001. The Professional Geographer, 60(3), 333–355. https://doi.org/10.1080/00330120801985661
- Shearmur, R., & Doloreux, D. (2019). KIBS as both innovators and knowledge intermediaries in the innovation process: Intermediation as a contingent role. Papers in Regional Science, 98(1), 191–209. https://doi.org/10.1111/pirs.12354
- Sun, H., & Li, Z. (2010). Effectiveness of cartogram for the representation of spatial data. The Cartographic Journal, 47(1), 12–21. https://doi.org/10.1179/000870409X12525737905169
- Wood, P. (2009). Service competitiveness and urban innovation policies in the UK: The implications of the ‘London paradox. Regional Studies, 43(8), 1047–1059. https://doi.org/10.1080/00343400801968437
- Wood, J., & Dykes, J. (2008). Spatially ordered treemaps. IEEE Transactions on Visualization and Computer Graphics, 14(6), 1348–1355. https://doi.org/10.1109/TVCG.2008.165
- Yum, S. (2019). The interaction between knowledge-intensive business services and urban economy. The Annals of Regional Science, 63(1), 53–83. https://doi.org/10.1007/s00168-019-00920-3
Appendix A
Table A1. Classification of knowledge intensive-business services (KIBS) industries
Table A2. Classification of knowledge-intensive services (KIS) and less knowledge-intensive services (LKIS) industries
Table A3. Summary of employment and establishment in KIBS industries
Table A4. High-high employment clusters of KIBS industries in the rural area
Table A5. High-high employment clusters of KIBS industries in the urban area