
 ?Mathematical formulae have been encoded as MathML and are displayed in this HTML version using MathJax in order to improve their display. Uncheck the box to turn MathJax off. This feature requires Javascript. Click on a formula to zoom.
Abstract
In recent times, Africa has experienced remarkable economic growth; nonetheless, this advancement remains far from being considered inclusive, given the persistently high levels of poverty and income inequality across the continent. To this end, this study investigates the role of fiscal policy measures on inclusive growth using absolute and relative pro-poor measures of growth. The study utilizes panel data from 48 African countries spanning the period 1996 to 2020 and employs the Panel System Generalized Method of Moments (GMM) technique for analysis. Estimation results reveal a concerning trend where public debt service exacerbates both poverty and income inequality, underscoring the adverse consequences of mounting public debt pressures in the region. Interestingly, while government expenditure reduces inequality and worsens poverty, an increase in taxation reduces poverty but worsens income inequality. Further, an increase in taxation negatively affects the income shares of the bottom and middle-income groups while the top-income groups benefit. The findings of this study have significant policy implications for improving inclusive growth in the continent.
1. Introduction
The concept of inclusive growth has gained attention due to the central place it holds in the economic development of countries (Aoyagi & Ganelli, Citation2015; Ngepah, Citation2017; Ranieri & Ramos, Citation2013; Sen, Citation2014). Several countries pursue inclusive growth policies to eradicate poverty and income inequality while also fostering long-term development. This becomes critical in a country’s development pattern as it entails a sustainable, broad-based, and paced growth process.
This study is motivated by the increased misalignment between economic growth and inclusive growth (in this case proxied by income inequality and poverty) in Africa. The study also aligns with some of the Sustainable Development Goals (SDG) of the United Nations that aim to eradicate poverty and other deprivations. Specifically, the goals are as follows: 1 - “End poverty in all its forms everywhere” and 10 - “Reduce inequality within and among countries”. According to UNSDG (Citation2021, Citation2022), COVID-19 has reversed more than four years of progress against poverty. In addition, the pandemic also widened income inequality between nations in a generation. This is anticipated to reverse the decline in inequality since the global financial crisis of 2007–2009.
According to the World Economic Forum (Citation2018), countries such as Norway, Iceland, Luxembourg, and Switzerland have been identified as the leading countries in terms of inclusive growth (see also Samans et al., Citation2015, Citation2017). On the other hand, developing countries such as Zimbabwe, Malawi, Lesotho, and Mozambique are among the countries with the least inclusive growth. Most of these countries are in the African continent. Although most African countries have enjoyed stable economic growth in the decade before COVID-19, this has not translated into a significant improvement in the economic well-being of the populace, with poverty and inequality still being a key challenge (see Figure ). Effectively addressing the state of poverty in the region has remained challenging because the sectors responsible for inclusive economic growth are impeded by wage disparities and insufficient skilled labour (Mutiiria et al., Citation2020).
Figure 1. Poverty and income inequality in selected African countries.
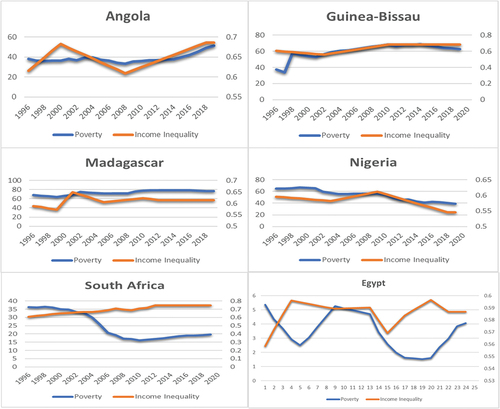
Heshmati et al. (Citation2019) noted that the growing income disparity between the rich and the poor, both between and within countries, has heightened the need to better understand the underlying causes of inequality and develop policy initiatives capable of effectively addressing the income gap. In addition, unchecked income disparities can erode a country’s comparative advantage, causing political and social unrest (Stiglitz, Citation2012, Citation2016). Furthermore, widening inequality can weaken consumption levels in a way that sees those at the top spend a smaller percentage of their income than poorer segments of society Stiglitz (Citation2016). Income inequality could constrain the poor and vulnerable from accessing opportunities that drive growth. Concerning this, Nolan et al. (Citation2012) echoed that income inequality is not healthy and could inhibit long-term growth. In addition, a significant income gap between the rich and the poor can make it difficult for the poor to access adequate educational and medical opportunities (Neckerman & Torche, Citation2007). Improved education and medical services are key to achieving more productivity, therefore, any distortion to aggregate productivity may limit the long-term economic progress of a country. Fiscal policy tools in the form of expenditures and taxes can be employed to address income inequality. For instance, Stiglitz (Citation2016) demonstrates that based on a country’s growth pattern, welfare system, and level of fiscal constraint, the government can use a variety of fiscal policies, including tax and benefit systems, to reduce inequality and the negative consequences of that inequality.
Given the foregoing, this study sets out to determine the impact of fiscal measures on inclusive growth in Africa. More specifically, the study examines the impact across the socio-economic indicators of poverty and inequality. Given that inclusive growth is thought to be pro-poor, previous studies on inclusive growth looked at the use of economic indicators in determining inclusive growth. These include per capita GDP (Amponsah et al., Citation2021; Anand et al., Citation2013; Oyinlola & Adedeji, Citation2021; Oyinlola et al., Citation2020; Tella & Alimi, Citation2016), and employment growth (Ianchovichina & Lundström, Citation2009). In contrast to prior studies (Aslam & Farooq, Citation2019; Aslam & Shabbir, Citation2019; Aslam et al., Citation2021; Ghouse et al., Citation2022; Nchake & Shuaibu, Citation2022; Oyinlola & Adedeji, Citation2021; Oyinlola et al., Citation2020; Zulfiqar et al., Citation2016), this study employs a disaggregated measure of inclusive growth. This approach is adopted for two primary reasons: firstly, to mitigate the potential bias that may arise from aggregating variables, and secondly, to assess the individual responsiveness of each component of inclusive growth to fiscal measures. This disaggregated measure is particularly useful in cases where the government aims to address issues sequentially. The study further considered the use of various fiscal policy measures not relying only on tax but also on government domestic spending and debt servicing. In addition, the dynamic effect of these fiscal measures on the distribution of income was examined.
The findings of the study indicate that government expenditure has the effect of reducing inequality and impairing poverty. Conversely, a rise in taxation has the consequence of reducing poverty but exacerbating income inequality. In the prior scenario, it is posited that government expenditure tends to exhibit an inclination for unproductive or regressive distribution such as debt service. Additionally, it is suggested that this expenditure may potentially contribute to inflationary pressures, thereby limiting its ability to enhance the living conditions of poor people or fulfil their fundamental requirements. However, in the latter scenario, the observed effect could be attributed to the increased tax-to-GDP ratio, particularly when it surpasses the threshold level of 15% set by the World Bank. This phenomenon is commonly observed in many African countries and is believed to have a positive impact on welfare by providing additional resources for social development. Considering the income group model, the study observed that debt servicing increases the income of the top earners while decreasing the income of the lowest earners. This could be attributed to the fact that all income groups are taxed, but in some cases, the top class receive a rebate because they are often the government’s fund lenders. In addition, it was observed that government expenditure has a positive impact on the Top 1% and Top 10% income groups, but a negative impact on the middle 40 and bottom 50 income groups. It is however important to state that these findings are limited to the observed relationship for African countries; consequently, generalization of the findings should be pursued with caution.
2. Literature review
Several approaches to inclusive growth have been identified in the literature. These approaches include the World Bank approach, the Asian Development Bank’s approach, the OECD approach, and the UNDP approach among others. The World Bank approach could be identified with the work of Ianchovichina and Lundström (Citation2009). The World Bank defines inclusive growth as growth that is paced and broad-based across all sectors of the economy, with most of the country’s labour force making substantial contributions. On the other hand, the Asian Development Bank’s approach (Ali & Son, Citation2007; Asian Development Bank, Citation2011; Rauniyar & Kanbur, Citation2010a, Citation2010b) sees inclusive growth as growth accompanied by equity and fairness as well as providing economic opportunities for all (Asian Development Bank, Citation2011). However, the approach is argued to render inclusive growth analytics unworkable because it requires determining how everyone contributed to such growth (Ngepah, Citation2017). The OECD (Citation2014, Citation2016) approach is based on three broad pillars: multidimensionality, distributional considerations, and policy impact. The multidimensionality pillar asserts looking beyond the traditional growth measures of GDP-based, and GDP per capita-based linked welfare to include additional important dimensions of people’s well-being that promote their productive capacity in the economy and society, such as social relations and happiness. The distributional pillar also necessitates analyses of distribution that consider the distributions of multidimensional well-being beyond income (per capita). The UNDP approach (Hirvay, Citation2011; Kjøller-Hansen & Lindbjerg Sperling, Citation2020) demonstrates that growth is inclusive if it occurs in sectors that employ the vulnerable and poor it notes that increasing returns to labour is, therefore, a process that benefits the poor.
Kireyev and Chen (Citation2017) provide a framework for evaluating inclusive growth based on the decomposition of the change in poverty into growth, distribution, and decile effects, which can be obtained using distributive analysis. Similarly, Anand et al. (Citation2013) proposed a strategy that centres on the social opportunity created by social welfare. This requires not only income redistribution but also access to resources and opportunity equity. In addition, McKinley (Citation2010) identified three strands of measures, including poverty and inequality measures (horizontal (share of the population below the set poverty target level) and vertical (Gini coefficient and income share of the poorest 60% of the population)).
This study relies on the premise of fiscal policy theory and assumes that it serves as a stability policy for achieving economic stability. For instance, the traditional Keynesian fiscal policy was designed to stimulate aggregate demand and subsequently boost aggregate output. In this regard, Tanzi and Zee (Citation1997) points out that modern monetary and fiscal policy transcends stabilization into income redistribution as well as resource reallocation. This is supported by Gavin and Hausmann (Citation1998) who argue that low fiscal deficits promote economic growth by lowering the likelihood of a financial crisis. Also, Gupta et al. (Citation2002) and Li and Sarte (Citation2004) contend that personal income tax progressivity programs could be implemented as a strategy for improving equity.
A fiscal system could be in the form of government spending or a tax system, all of which have implications for inclusive growth. Studies such as Mutiu Abimbola Oyinlola and Adedeji (Citation2021) and Whajah et al. (Citation2019) found that the size of the government, measured by government expenditure, has a substantial effect on inclusive growth. Similarly, Kneller et al. (Citation1999) argued that distorting tax systems can impede growth because an efficient and equitable tax system is a crucial component of a growth-promoting strategy. According to Mckay (Citation2002), fiscal policy measures are an important tool for governments to influence income distribution and poverty, but the relationships between fiscal policy and poverty are not well understood. For instance, Gunasinghe et al. (Citation2021) and Muinelo-Gallo and Miranda Lescano (Citation2022) found evidence of a trade-off between efficiency and equity, noting that increasing redistributive spending reduces income inequality while slowing economic growth. According to these studies, a direct tax would be an effective means of reducing income inequality. On the other hand, reduced non-redistributive spending could promote both efficiency and equity objectives, especially in countries with structural budget deficits.
A handful of empirical studies have attempted to identify determinants of pro-poor growth (Kakwani et al., Citation2003; Ravallion, Citation2004; Siwar et al., Citation2021) and inclusive growth. Along this line, Aoyagi and Ganelli (Citation2015) observed that redistributive fiscal policy and monetary policies are effective at fostering inclusive growth. Also, Amponsah et al. (Citation2021) found the impact of government spending on inclusive growth varies based on informality and financial inclusion. Mutiu Abimbola Oyinlola and Adedeji (Citation2021) point out that both aggregate and disaggregated taxes have no significant impact on inclusive growth. However, evidence suggests that all aspects of governance have an impact on inclusive growth. For instance, Satrio et al. (Citation2019) establish that government spending on education and health has a positive and significant impact on inclusive growth, whereas RGDP has a positive but insignificant impact. Similarly, Alekhina and Ganelli (Citation2020) find that fiscal redistribution, female labour force participation, productivity growth, FDI inflows, digitalization, and savings contribute significantly to inclusive growth. In line with this, Ofori and Asongu (Citation2021) emphasize the importance of FDI and ICT diffusion in promoting inclusive growth. It was also discovered that poorer people benefit more from infrastructure than rich people, indicating that infrastructure plays an important role in income distribution (Mutiiria et al., Citation2020).
3. Methodology
This study follows the lead of Chenery et al. (Citation1974) and Shorrocks et al. (Citation1976) who advocate poverty reduction through income redistribution. This aligns with Li and Sarte (Citation2004) who suggest that the change in progressiveness has a significant impact on income inequality. Similarly, McKinley’s (Citation2010) method identified three strands of measures of inclusive growth which include poverty and inequality measures. Likewise, this study utilizes the percentile measure of inequality to determine the fiscal sensitivity of each quartile measure of inequality.
The functional model is given as.
Where IG is the inclusive growth measure. FPS is the fiscal policy measure (tax to GDP ratio, debt service, and government expenditure). The model controls other factors such as GDP, Institutional quality, Remittance, and ICT. Hence, the extended empirical model takes the form of:
North (Citation1990) argues the significance of institutional quality in guaranteeing efficiency, hence its inclusion in the model. Through the efficient allocation of resources and economic liberty, the institutionalization of good governance practices stimulates economic growth, promotes income redistribution, and tackles income equality (Acemoglu et al., Citation2006). The role of governance in enhancing resource mobilization and inclusive growth cannot be overstated. Indeed, the SSA has made some progress in governance as evidenced by the peaceful transition of power in its member countries (Oyinlola et al., Citation2020). Benmamoun and Lehnert (Citation2013) and Cazachevici et al. (Citation2020) found evidence that international remittances boost economic growth, and this could also influence poverty. Alekhina and Ganelli (Citation2020) and Ofori and Asongu (Citation2021) identify information and communication technology (ICT) and digitalization as significant drivers for inclusive growth.
3.1. Estimation technique
This study employs the System Generalized Method of Moments estimator for analysis due to potential endogeneity in the model. The system GMM estimator combines moment conditions for the model in first differences with moment conditions for the model in levels to deal with endogeneity. The GMM estimator accounts for the dependent variable’s persistent nature, the omitted variable problem, measurement error, reverse causality, and cross-sectional heterogeneity (Arellano & Bond, Citation1991; Arellano & Bover, Citation1995; Blundell & Bond, Citation1998; Roodman, Citation2009). When the number of cross-sections is greater than the number of periods (N > T), the GMM estimator is efficient. The Hansen test of overidentification restrictions is used to test the overall validity of the instruments and the Arellano-Bond second-order serial correlation test is used to assess the consistency of the estimated model (Roodman, Citation2009). The two-step system GMM was used in this study. The panel model specification of the empirical model is presented as follows:
Where is a vector of control variables that includes Institution, Remittance, and ICT,
is the white noise error term. Given that different measures of inclusive growth are adopted,
is given as Poverty, Gini coefficient, and Income distribution, all to be estimated in separate models.
3.2. Data and sources
Table presents a detailed description of the data used in the study. Based on data availability, the study covers the period 1996 to 2020.
Table 1. Data description
4. Empirical results and discussion
This section presents the estimated result and the discussion of the findings. Table reports the descriptive statistics for the variables used in the study. Table reveals that Africa has suffered from extreme poverty and income inequality. A maximum poverty level of over 95% of the population is observed, while the most extreme case of income inequality is a Gini coefficient score of 0.84.
Table 2. Descriptive statistics
The Table further shows that the average level of income inequality score (Gini) in the region is 0.62 with an average poverty incidence of about 40% of the population. This underscores the enormity of the development challenges in Africa hence the need for quick and effective policy actions.
4.1. Fiscal measures and poverty in Africa
Table reports the poverty model estimates. Model 1 of the equation shows the relationship between poverty and debt servicing. Here, debt servicing increases poverty indicating a significant adverse effect on the poor across all models. This could be due to channelling resources that could be used for social development towards debt servicing, thereby increasing the vulnerability of the poor. The effect could be compounded by the fact that Africa’s debt is largely external, hence the debt service payment is largely to creditors outside the African economies. More so, according to ONE (Citationn.d.), African countries accumulated a total external debt of US$644.9 billion as of the year 2021. Furthermore, it is projected that these countries will be obligated to make external debt service payments amounting to about US$68.9 billion in the year 2023. The report additionally indicates that a total of 21 African countries with low-income status are currently experiencing or at risk of debt distress. This signifies that the countries encounter challenges in fulfilling their debt obligations or are anticipated to encounter such challenges in the immediate future. Fitch Ratings (Citation2022) projected that the combined external debt service burden of countries it rates in sub-Saharan Africa (excluding South Africa) is expected to rise from 2023 through 2025. Furthermore, this burden is expected to remain notably higher than the average level observed from 2019 to 2021. This implies that enormous resources that could be used for poverty reduction measures could be directed towards external debt servicing. The negative effect of external debt servicing is likely to be higher than internal debt because external debt servicing transfers resources out of the economy. Consequently, the worsening effect of public debt service on poverty could be attributed to the significant external debt burden of African countries.
Table 3. Inclusive growth (poverty)
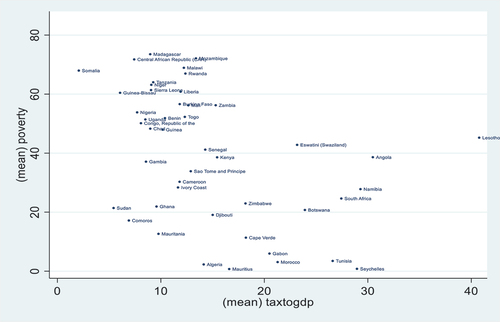
Model 2 shows the relationship between poverty and government expenditure. Government expenditure is found to have a positive and significant impact on poverty. The worsening effect could be based on two factors. Firstly, as argued by Millsap (Citation2021), government spending, if not properly managed could be inflationary and reduce the real purchasing power of the poor. Inflation’s transmission effect could be considered strong because it affects consumption patterns as the poor have a high marginal propensity to consume. Secondly, it is observed that government spending in Africa is largely skewed towards recurrent expenditure. Model 3 presents the impact of the tax-to-GDP ratio on poverty. The result reveals a reducing effect of taxation on poverty. Gaspar et al. (Citation2016) and Raul and Bernard (Citation2018) infer that the incidence of poverty in countries with low tax-to-GDP ratios is relatively higher. The studies argued that an increase in tax to GDP ratio especially above the threshold level of 15% benchmark may be welfare improvement as this will provide additional resources for social development. A cursory view of Figure reveals that the average tax-to-GDP ratio of the sample African countries is below the 15% threshold level. This probably explains why the reduction effect of an increase in taxation on poverty is only significant at a 10% level.
Figure 2. Relationship between poverty and tax-to-GDP ratio in Africa.
An improvement in institutional quality is found to reduce poverty thereby underscoring the role of good governance in poverty eradication. As noted by Acemoglu et al. (Citation2006), institutions play a key role in the development process as well as poverty reduction. An increase in internet usage is also found to reduce poverty. This implies that as economies transit to a digital economy, they may incur less processing costs and access to information usage. It could also indirectly have a positive effect by increasing national income and by extension a reduction in poverty. Mora-Rivera and García-Mora (Citation2021) established that ICT is more likely to reduce poverty in households with internet access than in those without it. Although other control factors such as GDP and remittance largely have the a priori expected signs, the effects are statistically insignificant. This also aligns with the study of Aslam and Shabbir (Citation2019) and Ghouse et al. (Citation2022) that an increase in digitalization could spur inclusive growth The insignificant effect of GDP expansion is not surprising considering that the GDP of African economies have been expanding, with poverty also exhibiting an upward trend.
4.2. Fiscal measures and income inequality in Africa
Table reports the estimates of the inequality model. From model 1, the study observes that debt service has a significant positive effect on income inequality. A rationale for this finding could be that in terms of debt servicing, the government mostly borrows from the rich (especially in the case of internal debt). To service the debt, both the poor and rich are taxed with the ultimate payment going to the rich. This could explain how debt servicing widens the inequality gap. This finding is corroborated by the result of the income shares model presented in Table where debt servicing is found to increase the income shares of the top 1%- and 10%-income groups but decrease the income shares of the middle 40% and bottom 50% income groups. As indicated in the report of the Africa Policy Research Institute (Citationn.d.), a substantial proportion (about 75% since 2011) of debt service paid by sub-Saharan African countries is to private bondholders and commercial lenders. This is likely to increase the income of the high-income groups, especially for the domestic lenders, thereby widening inequality. Further, an increase in government expenditure is revealed to reduce income inequality. This aligns with the findings of Akgun et al. (Citation2018). Government expenditure has the potential to mitigate income inequality through the provision of public goods and services that disproportionately benefit individuals with lower socioeconomic status, such as education, healthcare, and social protection. These expenditures have the potential to enhance the productivity and income levels of individuals with lower socioeconomic status, thereby mitigating the income gap between rich and poor groups.
Table 4. Inclusive growth (Gini)
Table 5. Income shares and fiscal measures
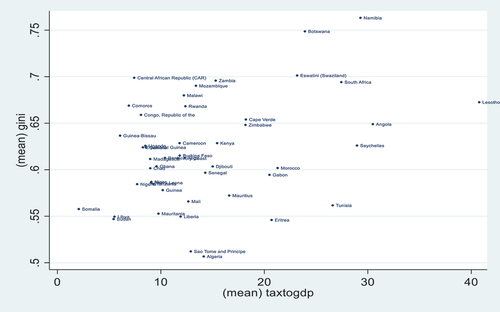
Interestingly, an increase in taxation is revealed to increase income inequality. Though this effect is significant at 10%, the finding is reinforced by the income shares model result presented in Table with taxation having a positive effect on the income shares of the top 1%- and 10%-income groups, but a negative effect on the income shares of the middle 40 and bottom 50 income groups. In addition, the scatterplot of income inequality against the tax-to-GDP ratio, presented in Figure , reveals that countries with a high tax-to-GDP ratio have higher income inequality as observed in Namibia, Botswana, Lesotho, and Eswatini. This reinforces the earlier finding of a worsening effect of taxation on income inequality in the region.
Figure 3. Relationship between Gini and tax-to-GDP ratio in Africa.
An improvement in institutional quality reduces income inequality. This illustrates the significant role of good governance in achieving redistribution of resources. This is found to be consistent with the income share estimates (see Table ) where institutional quality is observed to reduce the shares of the top 1 and top 10 income groups but increases the income shares of the middle 40 and bottom 50 categories. GDP expansion is found to worsen income inequality in the region. This illustrates that the effect of economic prosperity might be beneficial for some while leaving others behind. Remittances were observed to reduce income inequality, though the effect is not strongly significant. This could signify that those at the bottom of the economic ladder are probably the main beneficiaries of remittance flows.
5. Conclusion
The study adds to the literature on the role of fiscal policy measures in achieving inclusive growth in Africa. The model estimates show that while an increase in public debt servicing and government expenditure worsens poverty, an increase in taxation is beneficial for poverty reduction. In terms of income inequality, public debt servicing and taxation increase inequality, while government expenditure reduces it. An implication of these findings is the constraining effect of debt service payments on the fiscal space of African countries which could translate into lesser resources for poverty reduction measures. Further, debt servicing (especially for internal debt) could increase the income shares of the rich (who own the government bonds) thereby worsening inequality levels. The stimulating effect of taxation on inequality points to the ineffectiveness of the tax systems in the region, hence the need for an overhaul of the existing system. Other factors that reduce poverty include internet penetration and the improvement of institutional quality. In addition, an increase in remittance inflow and an improvement in institutional quality improve inequality in the region.
Consequent to these findings, the study highlights the potential of fiscal policy measures in achieving inclusive growth; however, careful design and implementation should be based on the dynamics of each country. Thus, to achieve more inclusive growth, the study recommends the need to review government expenditure in the region by paying more attention to poverty alleviation and social welfare schemes. Further, public debt accumulation needs to be pursued with caution to avoid the worsening effect of huge debt servicing on poverty and inequality. In addition, pursuing debt relief could help reduce the current debt service burden of African countries.
Data statement
The data used for the study is available upon request.
Acknowledgement
The payment of the APC by the University of the West of Scotland is appreciated.
Disclosure statement
No potential conflict of interest was reported by the author(s).
Notes
1. Roodman (Citation2009) explains that in the context of Arellano-Bond GMM regression, which relies on first differences, AR(1) is expected; therefore, the Arellano-Bond AR(1) test result is typically disregarded as the AR(2) test is applied to the residuals in first differences to detect AR(1) in the underlying levels variables. Thus, the study focused on the reporting the AR(2) estimates.
References
- Acemoglu, D., Johnson, S., & Robinson, J. (2006). Understanding prosperity and poverty: Geography, institutions, and the reversal of fortune. Understanding Poverty, 19–14. https://doi.org/10.1093/0195305191.003.0002
- Africa Policy Research Institute. (n.d.). Africa’s debt landscape: Scope for sustainability. Retrieved March 9, 2023, from https://afripoli.org/africas-debt-landscape-scope-for-sustainability
- Akgun, O., Cournede, B., & Fournier, J.-M. (2018). The effects of the tax mix on inequality and growth. OECD Economics Department Working Papers, No. 1447, OECD Publishing. https://doi.org/10.1787/C57eaa14-EnOECD,1447
- Alekhina, V., & Ganelli, G. (2020). Determinants of inclusive growth in ASEAN. IMF Working Papers, 20(118). https://doi.org/10.5089/9781513549194.001
- Ali, I., & Son, H. H. (2007). Measuring inclusive growth. Asian Development Review, 24(1), 11–31. https://doi.org/10.1142/S0116110507000024
- Amponsah, M., Agbola, F. W., & Mahmood, A. (2021). The impact of informality on inclusive growth in sub-Saharan Africa: Does financial inclusion matter? Journal of Policy Modeling, 43(6), 1259–1286. https://doi.org/10.1016/j.jpolmod.2021.03.009
- Anand, R., Mishra, S., & Peiris, S. J. (2013). (Inclusive growth) - inclusive growth: Measurement and Determinants. IMF Working Papers, 13(135), 1. https://doi.org/10.5089/9781484323212.001
- Aoyagi, C., & Ganelli, G. (2015). Asia’s quest for inclusive growth revisited. Journal of Asian Economics, 40. https://doi.org/10.1016/j.asieco.2015.06.005 29–46
- Arellano, M., & Bond, S. (1991). Some tests of specification for panel data: Monte Carlo evidence and an application to employment equations. The Review of Economic Studies, 58(2), 58. https://doi.org/10.2307/2297968
- Arellano, M., & Bover, O. (1995). Another look at the instrumental variable estimation of error-components models. Journal of Econometrics, 68(1), 29–51. https://doi.org/10.1016/0304-4076(94)01642-D
- Asian Development Bank. (2011). Framework of inclusive growth indicators: Key indicators for Asia and the Pacific 2011. Key Indicators for Asia and the Pacific. https://www.adb.org/sites/default/files/publication/42976/ki2011-special-supplement.pdf
- Aslam, A., & Farooq, A. (2019). In pursuit of inclusive institutional growth: A comparative pattern of selected Asian countries. European Online Journal of Natural and Social Sciences, 8(3), –495.
- Aslam, A., Naveed, A., & Shabbir, G. (2021). Is it an institution, digital or social inclusion that matters for inclusive growth? A panel data analysis. Quality & Quantity, 55(1), 333–355. https://doi.org/10.1007/s11135-020-01008-3
- Aslam, A., & Shabbir, G. (2019). Socio-digital inclusion for inclusive growth: Evidence from world-level data. Pakistan Journal of Social Sciences, 39(2), 567–581. http://pjss.bzu.edu.pk/index.php/pjss/article/view/681
- Benmamoun, M., & Lehnert, K. (2013). Financing growth: Comparing the effects of FDI, ODA, and International Remittances. Journal of Economic Development, 38(2). https://jed.cau.ac.kr/archives/38-2/38-2-2.pdf 38 2 43–65. https://doi.org/10.35866/caujed.2013.38.2.002
- Blundell, R., & Bond, S. (1998). Initial conditions and moment restrictions in dynamic panel data models. Journal of Econometrics, 87(1), 115–143. https://doi.org/10.1016/S0304-4076(98)00009-8
- Cazachevici, A., Havranek, T., & Horvath, R. (2020). Remittances and economic growth: A meta-analysis. World Development, 134, 105021. https://doi.org/10.1016/j.worlddev.2020.105021
- Chenery, H., Ahluwalia, S. M., Bel, C. L. G., Duloy, J. H., & Jolly, R. (1974). Redistribution with growth; policies to improve income distribution in developing countries in the context of economic growth. Oxford University Press. ( xx, 304 pp).
- Fitch Ratings. (2022). African sovereigns face rise in external debt service payments. Retrieved March 9, 2023, from https://www.fitchratings.com/research/sovereigns/african-sovereigns-face-rise-in-external-debt-service-payments-14-12-2022
- Gaspar, V., Jaramillo, L., & Wingender, M. P. (2016). Tax capacity and growth: Is there a tipping point?. International Monetary Fund. ( 40 pp).
- Gavin, M., & Hausmann, R. (1998). Macroeconomic volatility and economic Development. In The Political Dimension of Economic Growth: Proceedings of the IEA Conference held in San Jose, Costa Rica (pp. 97–116). London: Palgrave Macmillan UK. https://doi.org/10.1007/978-1-349-26284-7_5
- Ghouse, G., Aslam, A., & Bhatti, M. I. (2022). The impact of the environment, digital–social inclusion, and institutions on inclusive growth: A conceptual and empirical analysis. Energies, 15(19), 7098. https://doi.org/10.3390/en15197098
- Gunasinghe, C., Selvanathan, E. A., Naranpanawa, A., & Forster, J. (2021). Rising income inequality in OECD countries: Does fiscal policy sacrifice economic growth in achieving equity? European Journal of Development Research, 33(6), 1840–1876. https://doi.org/10.1057/s41287-020-00322-8
- Gupta, S., Plant, M. W., Dorsey, T. W., & Clements, B. J. (2002). Is the PRGF living up to expectations? Finance & Development, 0039(2), A007. https://doi.org/10.5089/9781451952896.022.A007
- Heshmati, A., Kim, J., & Wood, J. (2019). A survey of inclusive growth policy. Economies, 7(3), 65. https://doi.org/10.3390/economies7030065
- Hirvay, I. (2011). Consultation on conceptualizing inclusive growth. In United Nations Development Programme 2011ed, Conceptualizing Inclusive Growth. Discussion in a Two-Day Workshop on Inclusive Growth organized by United Nations Development Programme and India Planning Commission October 24-25. New Delhi, India.
- Ianchovichina, E., & Lundström, S. (2009). Inclusive growth analytics: Framework and application. World Bank Policy Research Working Paper, 4851. https://doi.org/10.1596/1813-9450-4851
- Kakwani, N., Son, H. H., Qureshi, S. K., & Arif, G. M. (2003). Pro-poor growth: Concepts and measurement with country case studies (distinguished lecture). The Pakistan Development Review, 42(4I), 417–444. https://doi.org/10.30541/v42i4Ipp.417-444
- Kireyev, A., & Chen, J. (2017). Inclusive growth framework. IMF Working Paper, 127. https://doi.org/10.5089/9781484302156.001
- Kjøller-Hansen, A. O., & Lindbjerg Sperling, L. (2020). Measuring inclusive growth experiences: Five criteria for productive employment. Review of Development Economics, 24(4), 1413–1429. https://doi.org/10.1111/rode.12689
- Kneller, R., Bleaney, M. F., & Gemmell, N. (1999). Fiscal policy and growth: Evidence from OECD countries. Journal of Public Economics, 74(2), 171–190. https://doi.org/10.1016/S0047-2727(99)00022-5
- Li, W., & Sarte, P. D. (2004). Progressive taxation and long-run growth. American Economic Review, 94(5), 1705–1716. https://doi.org/10.1257/0002828043052196
- Mckay, A. (2002). Assessing the impact of fiscal policy on poverty. Discussion Paper World Institute for Development Economics Research (WIDER), 2002/43. http://hdl.handle.net/10419/53081
- McKinley, T. (2010). Inclusive growth criteria and indicators: An inclusive growth index for diagnosis of country progress. Asian Development Bank Working Paper, 14. https://www.adb.org/sites/default/files/publication/28493/adb-wp14-inclusive-growth-criteria.pdf
- Millsap, A. A. (2021). The High Cost of Too Much Government Spending. https://www.forbes.com/sites/adammillsap/2021/08/06/the-high-costs-of-too-much-government-spending/
- Mora-Rivera, J., & García-Mora, F. (2021). Internet access and poverty reduction: Evidence from rural and urban Mexico. Telecommunications Policy, 45(2), 102076. https://doi.org/10.1016/j.telpol.2020.102076
- Muinelo-Gallo, L., & Miranda Lescano, R. (2022). Redistribution and efficiency: An empirical analysis of the relevant trade-offs of welfare state fiscal policies. Review of Development Economics, 26(1), 562–586. https://doi.org/10.1111/rode.12822
- Mutiiria, O. M., Ju, Q., & Dumor, K. (2020). Infrastructure and inclusive growth in sub-saharan Africa: An empirical analysis. Progress in Development Studies, 20(3), 187–207. https://doi.org/10.1177/1464993420927507
- Nchake, M. A., & Shuaibu, M. (2022). Investment in ICT infrastructure and inclusive growth in Africa. Scientific African, 17, e01293. https://doi.org/10.1016/j.sciaf.2022.e01293
- Neckerman, K. M., & Torche, F. (2007). Inequality: Causes and consequences. Annual Review of Sociology, 33(1), 335–357. https://doi.org/10.1146/annurev.soc.33.040406.131755
- Ngepah, N. (2017). A review of theories and evidence of inclusive growth: An economic perspective for Africa. Current Opinion in Environmental Sustainability, 24, 52–57. https://doi.org/10.1016/j.cosust.2017.01.008
- Nolan, B., Salverda, W., & Smeeding, T. M. (2012). The Oxford Handbook of economic inequality. The Oxford Handbook of Economic Inequality. https://doi.org/10.1093/oxfordhb/9780199606061.001.0001
- North, D. C. (1990). Institutions, institutional change and economic performance. Cambridge University Press. 152p. https://doi.org/10.1017/CBO9780511808678
- OECD. (2014). All on board: Making inclusive growth happen. OECD Paris. 197p http://www.oecd.org/inclusive-growth/All-on-Board-Making-Inclusive-Growth-Happen.pdf
- OECD. (2016). Shaping policies for inclusive growth: Voice, inclusion and engagement. In The governance of inclusive growth (pp. pp. 63–95). OECD Publishing. https://doi.org/10.1787/9789264257993-5-en
- Ofori, I. K., & Asongu, S. A. (2021). ICT diffusion, foreign direct investment and inclusive growth in sub-Saharan Africa. Telematics and Informatics, 65, 65. https://doi.org/10.1016/j.tele.2021.101718
- ONE. (n.d.). African debt. Retrieved March 9, 2023. https://data.one.org/topics/african-debt/
- Oyinlola, M. A., & Adedeji, A. A. (2021). Tax structure, human capital, and inclusive growth: A sub-Saharan Africa perspective. Journal of Public Affairs, 22(4), e2670. https://doi.org/10.1002/pa.2670
- Oyinlola, M. A., Adedeji, A. A., Bolarinwa, M. O., & Olabisi, N. (2020). Governance, domestic resource mobilization, and inclusive growth in sub-Saharan Africa. Economic Analysis and Policy, 65, 68–88. https://doi.org/10.1016/j.eap.2019.11.006
- Ranieri, R., & Ramos, R. A. (2013). Inclusive growth: The building up of a concept. International Policy Centre for Inclusive Growth (IPC-IG), 104(March). http://hdl.handle.net/10419/71821
- Raul, F. J.-V., & Bernard, H. (2018, December 28). Getting to 15 Percent: Addressing the Largest Tax Gaps. https://blogs.worldbank.org/governance/getting-15-percent-addressing-largest-tax-gaps
- Rauniyar, G., & Kanbur, R. (2010a). Inclusive Development: Two Papers on conceptualization, application, and the ADB perspective. In Asian Development Bank. https://doi.org/10.1017/CBO9781107415324.004
- Rauniyar, G., & Kanbur, R. (2010b). Inclusive growth and inclusive development: A review and synthesis of Asian Development Bank literature. Journal of the Asia Pacific Economy, 15(4), 455–469. https://doi.org/10.1080/13547860.2010.517680
- Ravallion, M. (2004). Pro-poor growth: A primer. Available at SSRN 610283. https://ssrn.com/abstract=610283
- Roodman, D. (2009). How to do xtabond2: An introduction to difference and system GMM in Stata. The Stata Journal: Promoting Communications on Statistics & Stata, 9(1), 86–136. https://doi.org/10.1177/1536867X0900900106
- Samans, R., Blanke, J., Gemma, C., & Drzeniek, M. (2015). The inclusive growth and development report 2015. Geneva: World Economic Forum, 13. http://www3.weforum.org/docs/WEF_Forum_IncGrwth.pdf
- Samans, R., Blanke, J., Hanouz, M., & Corrigan, G. (2017). The inclusive growth and Development report 2017. World Economic Forum, (January). https://www3.weforum.org/docs/WEF_Forum_IncGrwth_2017.pdf
- Satrio, M. K., Amar, S., & Aimon, H. (2019). Determinants of inclusive growth on the inequality. In Third Padang International Conference On Economics Education, Economics, Business and Management, Accounting and Entrepreneurship (PICEEBA 2019) (pp. 689–699). Atlantis Press. https://doi.org/10.2991/piceeba-19.2019.17
- Sen, K. (2014). Inclusive growth: When may we expect it? when may we not? Asian Development Review, 31(1), 136–162. https://doi.org/10.1162/ADEV_a_00022
- Shorrocks, A. F., Chenery, H., Ahluwalia, M. S., Bell, C. L. G., Duloy, J. H., & Jolly, R. (1976). Redistribution with growth. Economica, 43(170), 206. https://doi.org/10.2307/2553218
- Siwar, C., Idris, N. D. M., & Hussien, M. I. (2021). Pro-poor Growth Policies for Poverty Alleviation. In W. Leal Filho, A. Marisa Azul, L. Brandli, A. Lange Salvia, P. Gökçin Özuyar, & T. Wall (Eds.), Reduced Inequalities. Encyclopedia of the UN Sustainable Development Goals. Springer. https://doi.org/10.1007/978-3-319-95882-8_12
- Stiglitz, J. E. (2012). The price of inequality: How today’s divided society endangers our future. WW Norton & Company. pp 379-399. https://doi.org/10.7916/d8-96ed-6058
- Stiglitz, J. E. (2016). America’s great malaise and what to do about it. Journal of Policy Modeling, 38(4). https://doi.org/10.1016/j.jpolmod.2016.05.007
- Tanzi, V., & Zee, H. H. (1997). Fiscal policy and Long-Run Growth. IMF Staff Papers, 44(2), 179. https://doi.org/10.2307/3867542
- Tella, S., & Alimi, O. (2016). Determinants of inclusive growth in Africa: Role of health and demographic changes. African Journal of Economic Review, 4(2), 138–146. https://www.ajol.info/index.php/ajer/article/view/136050
- UNSDG. (2021). The Sustainable Development Goals report 2021. https://unstats.un.org/sdgs/report/2021/The-Sustainable-Development-Goals-Report-2021.pdf
- UNSDG. (2022). The Sustainable Development Goals report 2022. https://unstats.un.org/sdgs/report/2022/The-Sustainable-Development-Goals-Report-2022.pdf
- Whajah, J., Bokpin, G. A., & Kuttu, S. (2019). Government size, public debt and inclusive growth in Africa. Research in International Business and Finance, 49, 225–240. https://doi.org/10.1016/j.ribaf.2019.03.008
- World Economic Forum. (2018). The inclusive Development index 2018 summary and data highlights. Report. https://www3.weforum.org/docs/WEF_Forum_IncGrwth_2018.pdf
- Zulfiqar, K., Chaudhary, M. A., & Aslam, A. (2016). Financial inclusion and its implications for inclusive growth in Pakistan. Pakistan Economic and Social Review, 54(2), 297–325. https://www.jstor.org/stable/26616711