
Abstract
Predictability of the various financial instruments can lead to more trust and investment. The study examines the long-term and causal relationship between various Nifty indices and the Ethereum cryptocurrency. This study considers the data from April 2015 to December 2022 in two phases, pre-covid and post-covid. Johansen’s cointegration test was used to determine if the vectors in the data set are cointegrated, using the Max-Eigen and Trace tests for evaluation. The Granger causality test was also used to explore the short-term causal relationship between Ethereum and the five Nifty indices. The study found that post-pandemic daily returns of stock market indices have developed a significant cointegration with the cryptocurrency over time. The Granger causality test results showed bi-directional relationships of Nifty 50, Nifty 200 and Nifty Next 50 with Ethereum and a unidirectional relationship between Nifty Auto and Ethereum. The non-linear results reveal a one-way relationship pre-covid and a bi-directional relationship post-covid except for Nifty Banks. Johansen’s cointegration test, both in the pre-and post-covid-era, indicated that these indices had a substantial long-term cointegration with cryptocurrencies. This study also offers guidance to investors in making long-term investment decisions and to regulatory authorities. This implied that the investing decisions resulted in developing a causal relationship between the equity market and cryptocurrencies, which seemed very unlikely before 2020. This indicates that a new and young investor also considered cryptocurrencies a viable alternate investment option compared to traditional options such as fixed deposits, gold, and other fixed-income instruments.
Impact statement
The study explores the relationship between Nifty indices and Ethereum cryptocurrency. Bi-directional relationships between Nifty 50, Nifty 200, and Nifty Next 50 with Ethereum are observed. Pre-COVID, a one-way relationship is noted, whereas the relationship was bi-directional post-COVID. These results indicate that consumer trust is increasing in cryptocurrencies and is being accepted as viable investments over traditional investment options. This signals a shift in investor preferences. This finding will also increase the predictability of the market and will impact investor decisions and regulatory frameworks.
Introduction
Nifty 50, otherwise known as the Nifty, is an Indian stock market index comprising 50 of the largest public companies listed on the Indian National Stock Exchange (NSE). It is usually a measure of India’s equity market’s performance and is regarded as a benchmark index for the Indian equities market. Cryptocurrency is a digital currency that uses high levels of encryption to ensure security. Cryptocurrencies are not controlled by any bank or regulatory body and work in a decentralised manner. The evolution of cryptocurrencies can be traced back to 2009 when Bitcoin was introduced. However, it came to India in the year 2012 and started gaining popularity from the year 2013. In India, the government did not recognise cryptocurrencies as a legal form of trade till 2020. In 2020, the trade of cryptocurrency was legalised. With this move, investors’ interest also started growing. It has been reported that the evolution of digital financial assets is inevitable (Koshelev, Citation2022). It is important to note that cryptocurrency and the stock market are not directly related; however, both are expected to be affected by changes in market conditions. As the stock market and cryptocurrencies are both impacted by market conditions, it is essential to see the relationship between these financial instruments.
The evidence suggests a positive relationship exists between the global stock market and the cryptocurrency market; e.g., in the years 2018 and 2019, the selloff in the global stock market led to a decline in NIFTY and cryptocurrencies. In this context, this study investigates the long-term relationship between the Indian stock market and the price of one of the leading cryptocurrencies, i.e. Ethereum. For this purpose, five Nifty indices are selected, i.e., Nifty 50, Nifty Next 50, Nifty 200, Nifty Auto, Nifty Bank and the cryptocurrency Ethereum. The literature also suggests the impact of unprecedented events on such relationships. As COVID was one such unusual event in history, it was apt to take this event as the benchmark for the comparison. Hence, this analysis is conducted for pre and post-Covid situations. Our study investigates the evolving relationship between Nifty indices and Ethereum cryptocurrency, which can assist investors in developing investment tactics and policymakers in creating market-related regulations highlighting new investment avenues in a dynamic market landscape. This study will help young investors decide whether to invest in cryptocurrencies.
Literature review
This section explores the relationship between various asset classes and the impact of Covid on these relationships.
Correlation between various asset classes
The financial markets have become increasingly interconnected in recent years, and researchers have examined the dynamic relationships between various asset classes. Matha et al. (Citation2022) analyse and find considerable interconnections between these different asset classes in the Indian financial market. Another study by Adebola et al. (Citation2019) examines the relationship between the daily prices of gold and blockchain-based currencies. It was evident that convergence and cointegration existed between the mentioned asset classes, suggesting that they may be used as alternative safe-haven assets. Beckmann et al. (Citation2015) looked at the effect of commodity prices, such as gold and currency exchange rates, on each other and discovered the possibility of using gold as a hedging mechanism against currency rate fluctuations.
Ross (Citation2013) explored the concept of arbitrage pricing, while the role of ‘Balance of Payments’ in the equilibrium of a portfolio is explored by Frenkel and Rodriguez (Citation1975). Patel (Citation2017) examined the co-movement and integration among stock markets, while ‘Oil, gold, US Dollar and Stock Market Interdependencies: A Global Analytical Insight’ analyses the interdependencies between oil, gold, the US dollar, and stock markets. Finally, Tudor and Popescu-Dutaa (Citation2012) analysed the effect of variability of share market returns on the changeability of exchange rates.
Much research in Middle Eastern economies has concerned the relationship between shares and the forex market. One study examined this relationship specifically in Saudi Arabia finds that the markets mentioned above considerably affected each other in a two-way manner (Parsva & Tang, Citation2017). Another study focused on Pakistan and discovered how the stock prices of that country impacted the exchange rates. These findings highlight the importance of understanding the specific dynamics of each economy when studying this relationship (Farooq et al., Citation2004). Commodity prices, US currency, and interest rates are key factors impacting stock markets and exchange rates (Akram, Citation2009). A study of the interdependence of these factors found that share prices were related to commodity markets, while the exchange rates were significantly affected by US currency and interest rates (Adjasi et al., Citation2011). Beckmann and Czudaj (Citation2013) examined the financial interdependence of international stock markets and found evidence of increasing interconnectedness between markets, particularly after the 2008 global crisis. These studies demonstrate the complex web of factors influencing stock markets and exchange rates. The relationship between the currencies of the countries involved in the export of oil and the price of oil itself has also been studied extensively (Saxena & Bhadauriya, Citation2012). One study found that the currencies of oil exporters were directly related to oil prices but not oil importers (Singh & Sharma, Citation2018). Another study found evidence of a significant impact of oil prices on stock market returns. At the same time, they performed studies to explore the interactions among equity indices, oil prices, other commodities and currency during financial turmoil (Ingalhalli et al., Citation2016).
Finally, the impact of the changeability of oil prices on the equity markets of involved countries was studied, with findings suggesting that oil price volatility significantly negatively impacts net-oil importer countries’ stock markets (Aydoğan et al., Citation2017). The literature indicate that all these financial assets are interrelated and affect each other positively or negatively.
Cryptocurrency and stock market
In recent times, the role of cryptocurrency and its relationship with various asset classes has gained a lot of significance. Several studies have studied this relationship. Bouri et al. (Citation2018) tested the asymmetry in non-linear short-run and long-run connections between US commodity indices and cryptocurrencies. The study finds evidence of such relationships, indicating that bitcoin may act as a diversifier for commodity and gold prices. On the other hand, Klein et al. (Citation2018) challenge the notion that bitcoin is a safe-haven asset. The findings showed that bitcoin was significantly volatile compared to gold and that its correlation with other assets is relatively weak.
Moreover, the study finds that bitcoin does not provide diversification benefits in a traditional portfolio. Blau (Citation2017) investigated and found that even blue-chip cryptocurrencies such as Bitcoin are volatile due to being susceptible to speculation. Balcilar et al. (Citation2017) examined and discovered the importance of trading volume regarding the volatility of Bitcoin and the expected daily returns, particularly in the distribution’s tails. Aravind (Citation2017) investigates the impact of foreign exchange volatility on the Indian stock market. The study finds that, particularly during times of high volatility, foreign exchange and secondary equity market in India are directly related. Finally, Elsayed et al. (Citation2022) analysed the volatility and return connectedness of cryptocurrencies and gold in uncertainty. The study finds evidence of strong return connectedness between cryptocurrencies and gold during times of uncertainty, indicating that they may be used as alternative safe-haven assets.
The recent emergence of cryptocurrencies as a new asset class has raised questions about their relationship with traditional assets such as gold. The study by Yang et al. (Citation2022) explores the effectiveness of various artificial intelligence techniques in forecasting gold prices, while Aras (Citation2021) applies a similar approach to the Bitcoin market. Several studies, including Thampanya et al. (Citation2020) and Bagci and Koylu (Citation2019) analyse the correlation between gold and cryptocurrencies, with the former focusing on the hedging effectiveness of the two assets. Angela and Sun (Citation2020) use the Ethereum market as a case study to determine which factors the prices of cryptocurrencies depend upon. Huynh et al. (Citation2020) examine the spillover effects between the cryptocurrency and gold markets. Some studies showed a positive relationship between traditional financial assets and cryptocurrencies (Shilov & Zubarev, Citation2021). A study by Caferra and Vidal-Tomás (Citation2021) conducted a study on cryptocurrencies and the stock market and concluded that cryptocurrency and stock prices fell steeply during Covid. However, cryptocurrencies promptly rebounded, while stock markets could not rebound. Another study by Yarovaya et al. (Citation2021) reported that COVID-19 does not increase the herding in cryptocurrency markets. It was also noted that herding behaviour was common in all markets, but this behaviour was not noticed during Covid.
Gaps in literature
These studies highlight the complex and multidirectional connections amid stock markets, currencies, and various economic factors such as commodity prices and oil prices. The specific dynamics of each economy must be considered when studying these relationships, as the causal relationships between these factors can vary significantly between countries. These conclusions heavily impacted new and young investors and policymakers seeking to understand and navigate the complex world of global economics.
Unprecedented events are reported to have a significant impact on various asset classes. However, it is essential to note that as COVID-19 was also a unique, unusual event, its effect on different financial instruments was minimal. More specifically, the impact of COVID-19 on the interrelationship of these asset classes is even more limited. Chien et al. (Citation2021) examined the correlation between equity market returns and energy price movements in the USA, Europe, and China. The study finds that an environmental wavelet nexus was started by the covid-19 pandemic between energy prices and equity returns in these developed markets. Mahdi et al. (Citation2021), in the context of COVID-19, apply support vector machines to predict how returns from blockchain-based currency and gold are related. Kim et al. (Citation2021) analyses the extent to which various cryptocurrencies are causally connected. Wei et al. (Citation2023) reported that during Covid, a diverse set of financial assets helped in hedging the risk of Bitcoin. Among various asset classes, gold is found to have worked as a safe trading option during COVID-19 (Noman et al., Citation2023). In this context, this study explores the impact of COVID-19 on the correlation between Ethereum and significant stock indices market, i.e. Nifty 50, Nifty Next 50, Nifty 200, Nifty Auto, and Nifty Bank.
Objectives and methodology
This study attempts to analyse the relationship between nifty and the cryptocurrency price. The objective of the study is to analyse whether different nifty indices daily returns granger cause Ethereum daily returns. Ethereum is considered for the analysis because it has a 68% share in overall traded cryptocurrencies. Ethereum smart contracts run on the Ethereum blockchain and are self-executing, meaning that trades would get automatically executed if the underlying conditions are met. The current study inspects the long-term and causal connection of Nifty 50, Nifty 200, Nifty Next 50, Nifty Auto and Nifty Bank with the cryptocurrency Ethereum. Daily data of time series from the date 1 April 2015 to 31 December 2022, have been considered for this empirical analysis. The spot price data for indices were retrieved from the Bloomberg Terminals. The data on Ethereum prices were attained from www.coinmarketcap.com. Previous studies have suggested that coin-ranking sites, such as Coinmarketcap, include most of the cryptocurrency trading activity and have the same underlying processes as the main exchange platforms (Coinbase and Bitstamp) and alternative coin-ranking sites (Cryptocom-pare). This justified the selection of a database to extract data for this study. Another study by Alexander and Dakos (Citation2020) mentioned that Coinmarketcap is used by most of the academic literature because they rank both coins and exchanges by trading volume and market capitalisation. The dates were further divided into pre-covid (before March 2020) and post-covid (on and after March 2020). A natural log was applied to reduce the skewness.
The Granger’s linear test (Granger, Citation1969) is one of the most popular methods to check the non-causality between the variables. As the linear assumption of the test causes a problem with low power to detect non-linear relationships, non-linear tests are also required. A non-linear version of the of Granger’s test is used by Hiemstra and Jones (Citation1994), but an improved version for the large sample is proposed by Diks and Panchenko (Citation2006). In a study on cryptocurrency and emerging stock markets, Xunfa et al. (Citation2020) suggest using Liang’s causality analysis as it is more robust. Studies have suggested the multifractal asymmetric detrended cross-correlation analysis (MF-ADCCA) approach for assets like cryptocurrency with more information asymmetry (Kristjanpoller et al., Citation2020). Bouri et al. (Citation2017a) use non-linear symmetric and asymmetric test for non-causality by replacing the Vector Autoregression to test the relation between gold and oil prices. Bouri et al. (Citation2017b) applied rolling causality analysis for out-of-the-sample rolling exercises and the widely used Granger’s test. Han et al. (Citation2016) suggest using more advanced cross-quantilograms to test the dependence between time series and check whether the relationship between the variables changes across different parts of their distributions. This study uses the traditional Grangers test for linear causality and Diks and Panchenko (Citation2006) test for non-linear causality to ensure robustness checks. The proposed methods provide replicability and interpretability as these methods have been widely used for detecting causality. Hamouda (Citation2021) also used a similar methodology. Diks and Panchenko (Citation2006) suggest decreased rejection rates for increased lag length and a bandwidth value between 0.5 and 1.5.
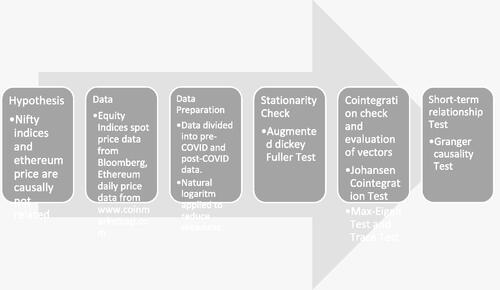
Furthermore, for the stationarity check, the Augmented Dicky Fuller test was used. This data’s stationarity suggests the future constancy of the statistical features. For the validity of the Granger-causality and Johansen cointegration test, the time series data needed to be stationary. The Johansen cointegration test was applied to investigate whether the data set’s vectors are cointegrating. The Max-Eigen test and the Trace test are used, respectively, to evaluate the cointegrated vectors. The Granger causality test also examined the short-term causal relationship between Ethereum and the five nifty indices. The study’s conceptual framework is adapted from Matha et al. (Citation2022) and is presented in .
Figure 1. Conceptual framework.
illustrates an overview of descriptive statistics for the pre and post Covid dataset. Negative returns were seen across the Nifty 50, Nifty 200, Nifty Next 50, Nifty Auto, Nifty Bank, and Ethereum, with Nifty Auto posting the best mean returns (−0.007 percent). The biggest deviations for Ethereum and Nifty Auto, with 5.95 percent and 1.22 percent, respectively, were shown by the standard deviation, which explained the departure from the actual mean. According to this analysis, only the Nifty Next 50 and Ethereum have a positive skewness in the data. The data were overly peaked, according to the kurtosis measurement of data flatness. The Jarque-Bera test hypothesises (H0) the data to be normally distributed, which is discovered not to be acceptable by inconsequential test statistics found out at 5% L.O.S., in statistical terms, accepting the alternate hypothesis (H1). For the post covid data, negative returns were seen across the Nifty 50, Nifty 200, Nifty Next 50, Nifty Auto, Nifty Bank, and Ethereum, with Nifty Bank” posting the best mean returns (−0.039 percent). The biggest deviations for Ethereum and Nifty Bank, with 5.34 percent and 1.96 percent, respectively, were shown by the standard deviation, which explained the departure from the actual mean. All the Nifty Indices and Ethereum have positive skewness in the data, according to this analysis. The Jarque-Bera test again hypothesises (H0) the data to be normally distributed, which, just like before, is once again discovered not to be acceptable by inconsequential test statistics found out at 5% L.O.S., in statistical terms, accepting the alternate hypothesis (H1).
Table 1. Descriptive statistics (pre and post Covid) and ADF Test.
The ADF test, a commonly used method in econometrics and forecasting to assess data stationarity, is defined as the consistency of mean and variance over time in the data. To determine stationarity, the ADF test employs a unit root test. Here, H0: Dataset is non- stationary, which would indicate the presence of a unit root. However, if the ADF test results fall below the critical value at a 5% significance level (p-value < 5%), it implies H0 is not acceptable, i.e., the acceptable conclusion would be that the data is stationary due to lack of a ‘unit root’. In the case of the data analysed, as shown in , the results of the ADF test indicated that there is stationarity present in the log-scale representation of the data, and the alternate hypothesis is to be considered accepted.
Results and discussion
The Johansen Cointegration Test is a statistical method for determining if more than one time series variables are connected over a prolonged period. The test, based on the eigenvalues of the model, applies a VECM (Vector Error Correction Model) to the data and calculates a test statistic. The hypothesis of cointegration is tested by comparing the test statistic to critical values. Evidence of cointegration indicates that the variables have a long-term equilibrium relationship, meaning short-term deviations will eventually be corrected. This method is commonly used in finance and economics to analyse long-term relationships between variables related to rates and prices in currency and equity market. The test identifies cointegrating vectors in the data and is performed in two parts: the Trace test and Maximum Eigen test. The test results are shown in , and independent and dependent variables, i.e., Nifty and Ethereum, are considered. The null hypothesis for this study is that there is no cointegration between these variables. This is further tested at a 5% L.O.S. The long-term connection amongst the variables is considered proven only when the ‘Trace’ and ‘Max-Eigen’ values > their respective critical values, which are 15.49471 and 14.26460, respectively, at a 5% L.O.S. The test results identified ‘Trace’ and ‘Max-Eigen’ values, for both pre-Covid and post-Covid situations, are consistently higher than the critical values, leading to the acceptance of the alternative hypothesis that there exists cointegration among the variables. This test measures a time series data’s capacity to forecast future behaviour by comparing it to the previous behaviour of another time series data. The test was used to investigate the causal connection between the returns on five nifty indices and Ethereum. The assertion that the variables are not causally connected—the null hypothesis—was put to the test. Once the ADF confirmed the stationarity amongst the variables, the cointegration test revealed cointegrating pairs amid variables, asserting the existence of ‘Granger causality’ in either a one-way or two-way manner.
Table 2. Johansen cointegration test results.
The test results of the Granger Causality are shown in . The ‘Granger Causality’ Test results showed no signs of causality among the Nifty 50 and other indices and Ethereum daily returns before COVID-19. But, in the post-pandemic situation, Granger Causality was found. Nifty 50, Nifty 200, and Nifty Next 50 seemed to have a bi-directional Granger Causality with Ethereum daily returns, while Nifty Auto had a unidirectional Granger Causality with Ethereum Daily Returns. Nifty Bank showed no causality whatsoever. It is important to note that various studies have reportedly argued that unprecedented events significantly impact these relationships (Kamal & Wahlstrøm, Citation2023; Wei et al., Citation2023).
Table 3. Granger causality test results.
The non-linear causality results are presented in . The results suggest a unidirectional non-linear relationship between Nifty Indices and Ethereum pre-covid. The results differ from the linear tests where no sign of causality was reported pre-covid. The non-linear relationship post-covid was similar to the results of linear tests. The results for the relation between Nifty Banks and Ethereum were identical, with no sign of causality reported pre-COVID and post-COVID. Linear and non-linear results were the opposite for Nifty Auto and Ethereum, where the results were significant for Ethereum and Nifty Auto in linear tests, and there was a significant non-linear relationship between Ethereum and Nifty Auto and Ethereum.
Table 4. Non-linear causality between Ethereum and Nifty indices.
Several studies have reported the impact of various cryptocurrencies on various financial instruments. A study on six major cryptocurrencies and their bilateral linkages with six stock market indices concluded that there was no evidence of cointegration and that Bitcoin and Stock market indices are decoupled (Gil-Alana et al., Citation2020). This study is in line with ours, in which no cointegration was found before COVID-19. A recent study by Mensi et al. (Citation2023) reported that cryptocurrencies have a leadership effect over the volatility indices. They also concluded that cryptocurrency and volatility markets are insignificantly (weakly) connected under normal market conditions. Our study also showed that the pre-Covid linear relationship and one-way non-linear relationship were not very significant, but the post-Covid relationship was significant. Unprecedented events are supposed to impact the prices of cryptocurrency. A recent study on the impact of the Russia-Ukrainian war also reported that the demand for cryptocurrency increased post-escalation, mainly to circumvent the imposed sanctions (Kamal & Wahlstrøm, Citation2023). Ha (Citation2023) also reported on similar lines and said that COVID-19 had impacted the connectedness and reached its peak during peak. They looked at the net total directional connectedness, and it was suggested that cryptocurrency and stock have a heterogeneous role. It is important to note that the relation between the stock market is context-specific. A study in South Africa revealed that stock exchanges are weakly integrated with Bitcoin in South Africa (Nyakurukwa & Seetharam, Citation2023). Some studies also reported that cryptos were more stable and irregular than international stock markets. However, these indices were more unstable and irregular during the COVID-19 pandemic (Lahmiri & Bekiros, Citation2020). There are debates around developed and emerging markets and their relation with cryptos. A study from 15 developed and 15 emerging stock markets concluded that in terms of directional predictability, there is no difference between developed and developing markets (Omri, Citation2023a). A cross-country analysis of five countries, including Japan, China, Venezuela, Sweden and Estonia, for five years (2014–2017) indicated that Bitcoin was treated as a safe asset only in Venezuela. In Japan and China, bitcoin has behaved as a diversifier. However, it acted as a weak hedge in economies like Sweden and Estonia, which are considered Bitcoin-friendly (Kliber et al., Citation2019). Some studies have also found that cryptocurrencies were siginifcant in revealing ETF returns (Omri et.al. 2023b). Similar to our study, Ethereum and Bitcoin were found to be closely correalted to European tosck market (Gambarelli et al., Citation2023). These results can help predict the possible returns from the market based on the performance of Ethereum.
Conclusion
This study examines the association and cause-and-effect connectedness between Indian market Indices and cryptocurrency (Ethereum). The study found that post the pandemic, daily returns of stock market indices have developed a significant cointegration with the cryptocurrency. The Granger causality test results showed bi-directional relationships of Nifty 50, Nifty 200 and Nifty Next 50 with Ethereum and a unidirectional relationship between Nifty Auto and Ethereum. The results also found that Ethereum price movements can predict future price changes in some share market indices, and similarly, index spot prices can predict the price change of Ethereum. At the same time, the non-linear results reveal similar results post-covid and a one-way relationship pre-covid. This, in hindsight, might be valuable in developing new investment strategies and diversifying investors’ funds. According to Johansen’s cointegration test, these indices had a substantial long-term cointegration with cryptocurrencies in both the pre-covid world and the post-covid era. The current findings highlight the importance of the factors’ long-term relationships. As a result, this study offers guidance to investors in making long-term investment decisions and to regulatory authorities.
Furthermore, a unidirectional association between Nifty Auto and Ethereum has been established. Together, these findings imply that cryptocurrencies considerably impact the equity market’s performance in the current market climate. The analysis of the relationship between the performance of cryptocurrencies is imperative because there has been resent events of crypto collapse, such as FTX, and BlockFi bankruptcy, in the recent times (Vidal-Tomás et al., Citation2023). To emphasise transparent pricing by avoiding price volatility, regulatory authorities and policymakers could enact the policies promptly as a preventive step.
As a result, investors can use the outcomes to forecast the predicted income from a certain investing strategy that was examined in the study. This paper aims to assist the prevailing literature by analysing the potential connections between capital markets and blockchain-based currencies and the simultaneous impact of many factors on equity indicators. In 2020, when the interest rates in India hit a decadal low of 3.25%, low-risk investors also had to turn to the Stock Market, posing an unusual figure of 1.5 Cr new de-mat and trading accounts within the next twelve months. Furthermore, their investing decisions resulted in developing a causal relationship between the equity market and cryptocurrencies, which seemed very unlikely before 2020, which in hindsight means new and young investors also considered cryptocurrencies as a viable alternate investment option as compared to more traditional options such as Fixed Deposits, gold, and other Fixed income instruments. Though, in reality, this relationship looks very unlikely, statistics say otherwise. So, investors and portfolio managers may use this information to develop hedging strategies to mitigate risks in equity and crypto markets. The scope of future research can be increased by taking into account more sector-specific Nifty and Sensex indexes and additional cryptocurrencies. The collapse of certain cryptocurrencies in the recent past and events happening in the future can also be good points of research for analysing the impact of such events on stock indies or other financial instruments. Additionally, cross-country comparison research can be done to make the findings more generalizable.
Author contributions
Rik Bose: conception and design, analysis and interpretation of the data, drafting of the paper. Jeevan Nagarkar: conception and design, drafting of the paper. Sushant Malik: conception and design, analysis and interpretation of the data. Nisha Bharti: conception and design, revising it critically for intellectual content. All the authors were involved in the final approval of the version to be published; and that all authors agree to be accountable for all aspects of the work.
Acknowledgment
The authors received no direct funding for this research.
Disclosure statement
No potential conflict of interest was reported by the author(s).
Data availability statement
The data that support the findings of this study are available from the corresponding author, N.B., upon reasonable request.
Additional information
Notes on contributors
Rik Bose
Rik Bose is a Post Graduate Student at Symbiosis Institute of International Business, Symbiosis International (Deemed University). His research interest include Capital markets and Credit risk.
Jeevan Nagarkar
Dr Jeevan Nagarkar is an Assistant Professor at Symbiosis Institute of International Business, Symbiosis International (Deemed University) in the area of Management. His research Interest include capital market, capital flows and commercial Banking.
Sushant Malik
Mr. Sushant Malik is an Assistant Professor at Symbiosis Institute of International Business, Symbiosis International (Deemed University) in the area of Management. His research Interest include Economics and General Management.
Nisha Bharti
Dr Nisha Bharti is an Assistant Professor at Symbiosis Institute of International Business, Symbiosis International (Deemed University) in the area of management. Her research Interest include Financial inclusion and general management.
References
- Adebola, S. S., Gil-Alana, L. A., & Madigu, G. (2019). Gold prices and the cryptocurrencies: Evidence of convergence and cointegration. Physica A: Statistical Mechanics and Its Applications, 523, 1227–1236. https://doi.org/10.1016/j.physa.2019.04.123
- Adjasi, C. K. d., Biekpe, N. B., & Osei, K. A. (2011). Stock prices and exchange rate dynamics in selected African countries: a bivariate analysis. African Journal of Economic and Management Studies, 2(2), 143–164. https://doi.org/10.1108/20400701111165623
- Akram, Q. F. (2009). Commodity prices, interest rates and the dollar. Energy Economics, 31(6), 838–851. https://doi.org/10.1016/j.eneco.2009.05.016
- Alexander, C., & Dakos, M. (2020). A critical investigation of cryptocurrency data and analysis. Quantitative Finance, 20(2), 173–188. https://doi.org/10.1080/14697688.2019.1641347
- Angela, O., & Sun, Y. (2020). Factors affecting cryptocurrency prices: Evidence from Ethereum. Proceedings of 2020 International Conference on Information Management and Technology, ICIMTech 2020 (pp. 318–323). IEEE. https://ieeexplore.ieee.org/document/9211195
- Aras, S. (2021). Stacking hybrid GARCH models for forecasting Bitcoin volatility. Expert Systems with Applications, 174, 114747. https://doi.org/10.1016/j.eswa.2021.114747
- Aravind, M. (2017). FX volatility impact on Indian stock market: An empirical investigation. Vision, 21(3), 284–294. https://doi.org/10.1177/0972262917716760
- Aydoğan, B., Tunç, G., & Yelkenci, T. (2017). The impact of oil price volatility on net-oil exporter and importer countries’ stock markets. Eurasian Economic Review, 7(2), 231–253. https://doi.org/10.1007/S40822-017-0065-1/TABLES/5
- Bagci, H., & Koylu, M. K. (2019). Cryptocurrency: Determining the correlation between Bitcoin cryptocurrency and gold prices. In Fatih Ayhan, Burak Darici (Eds.), Cryptocurrency in all aspects (pp. 193–206).https://www.peterlang.com/document/1110947#:∼:text=Summary,expert%20researchers%20in%20their%20fields
- Balcilar, M., Bouri, E., Gupta, R., & Roubaud, D. (2017). Can volume predict Bitcoin returns and volatility? A quantiles-based approach. Economic Modelling, 64, 74–81. https://doi.org/10.1016/j.econmod.2017.03.019
- Beckmann, J., & Czudaj, R. (2013). Is there a homogeneous causality pattern between oil prices and currencies of oil importers and exporters? Energy Economics, 40, 665–678. https://doi.org/10.1016/j.eneco.2013.08.007
- Beckmann, J., Czudaj, R., & Pilbeam, K. (2015). Causality and volatility patterns between gold prices and exchange rates. The North American Journal of Economics and Finance, 34, 292–300. https://doi.org/10.1016/j.najef.2015.09.015
- Blau, B. M. (2017). Price dynamics and speculative trading in bitcoin. Research in International Business and Finance, 41, 493–499. https://doi.org/10.1016/j.ribaf.2017.05.010
- Bouri, E., Jain, A., Biswal, P. C., & Roubaud, D. (2017). Cointegration and non-linear causality amongst gold, oil, and the Indian stock market: Evidence from implied volatility indices. Resources Policy, 52, 201–206. https://doi.org/10.1016/j.resourpol.2017.03.003
- Bouri, E., Roubaud, D., Jammazi, R., & Assaf, A. (2017). Uncovering frequency domain causality between gold and the stock markets of China and India: Evidence from implied volatility indices. Finance Research Letters, 23, 23–30. https://doi.org/10.1016/j.frl.2017.06.010
- Bouri, E., Gupta, R., Lahiani, A., & Shahbaz, M. (2018). Testing for asymmetric non-linear short- and long-run relationships between bitcoin, aggregate commodity and gold prices. Resources Policy, 57, 224–235. https://doi.org/10.1016/j.resourpol.2018.03.008
- Caferra, R., & Vidal-Tomás, D. (2021). Who raised from the abyss? A comparison between cryptocurrency and stock market dynamics during the COVID-19 pandemic. Finance Research Letters, 43, 101954. https://doi.org/10.1016/j.frl.2021.101954
- Chien, F. S., Sadiq, M., Kamran, H. W., Nawaz, M. A., Hussain, M. S., & Raza, M. (2021). Co-movement of energy prices and stock market return: Environmental wavelet nexus of COVID-19 pandemic from the USA, Europe, and China. Environmental Science and Pollution Research, 28(25), 32359–32373. https://doi.org/10.1007/S11356-021-12938-2/TABLES/4
- Diks, C., & Panchenko, V. (2006). A new statistic and practical guidelines for nonparametric Granger causality testing. Journal of Economic Dynamics and Control, 30(9–10), 1647–1669. https://doi.org/10.1016/j.jedc.2005.08.008
- Elsayed, A. H., Gozgor, G., & Yarovaya, L. (2022). Volatility and return connectedness of cryptocurrency, gold, and uncertainty: Evidence from the cryptocurrency uncertainty indices. Finance Research Letters, 47, 102732. https://doi.org/10.1016/j.frl.2022.102732
- Farooq, M. T., Keung, W. W., & Kazmi, A. A. (2004). Linkage between stock market prices and exchange rate: A causality analysis for Pakistan. The Pakistan Development Review, 43(4II), 639–649. https://doi.org/10.2307/41261018
- Frenkel, J. A., & Rodriguez, C. A. (1975). Portfolio equilibrium and the balance of payments: A monetary approach. The American Economic Review, 65(4), 674–688. https://doi.org/10.2307/1806543
- Gambarelli, L., Marchi, G., & Muzzioli, S. (2023). Hedging effectiveness of cryptocurrencies in the European stock market. Journal of International Financial Markets, Institutions and Money, 84, 101757. https://doi.org/10.1016/j.intfin.2023.101757
- Gil-Alana, L. A., Abakah, E. J. A., & Rojo, M. F. R. (2020). Cryptocurrencies and stock market indices. Are they related? Research in International Business and Finance, 51, 101063. https://doi.org/10.1016/j.ribaf.2019.101063
- Granger, C. W. (1969). Investigating causal relations by econometric models and cross-spectral methods. Econometrica, 37(3), 424–438. https://doi.org/10.2307/1912791
- Ha, L. T. (2023). Interlinkages of cryptocurrency and stock markets during COVID-19 pandemic by applying a TVP-VAR extended joint connected approach. Journal of Economic Studies, 50(3), 407–428. https://doi.org/10.1108/JES-01-2022-0055
- Hamouda, F. (2021). Identifying economic shocks with stock repurchase programs. Cogent Economics & Finance, 9(1), 1968112. https://doi.org/10.1080/23322039.2021.1968112
- Han, H., Linton, O., Oka, T., & Whang, Y. J. (2016). The cross-quantilogram: Measuring quantile dependence and testing directional predictability between time series. Journal of Econometrics, 193(1), 251–270. https://doi.org/10.1016/j.jeconom.2016.03.001
- Hiemstra, C., & Jones, J. D. (1994). Testing for linear and non-linear Granger causality in the stock price-volume relation. The Journal of Finance, 49(5), 1639–1664. https://doi.org/10.2307/2329266
- Huynh, T. L. D., Nasir, M. A., Vo, X. V., & Nguyen, T. T. (2020). “Small things matter most”: The spillover effects in the cryptocurrency market and gold as a silver bullet. The North American Journal of Economics and Finance, 54, 101277. https://doi.org/10.1016/j.najef.2020.101277
- Ingalhalli, V., Poornima, B. G., & Reddy, Y. V. (2016). A study on dynamic relationship between oil, gold, FOREX and stock markets in Indian context. Paradigm, 20(1), 83–91. https://doi.org/10.1177/0971890716637706
- Koshelev, K. A. (2022). Trends in the evolution of the digital financial assets market in the context of the digital transformation of the global economy. Finance: Theory and Practice, 26(4), 80–94. https://doi.org/10.26794/2587-5671-2022-26-4-80-9
- Lahmiri, S., & Bekiros, S. (2020). The impact of COVID-19 pandemic upon stability and sequential irregularity of equity and cryptocurrency markets. Chaos, Solitons, and Fractals, 138, 109936. https://doi.org/10.1016/j.chaos.2020.109936
- Kamal, M. R., & Wahlstrøm, R. R. (2023). Cryptocurrencies and the threat versus the act event of geopolitical risk. Finance Research Letters, 57, 104224. https://doi.org/10.1016/j.frl.2023.104224
- Kim, M. J., Canh, N. P., & Park, S. Y. (2021). Causal relationship among cryptocurrencies: A conditional quantile approach. Finance Research Letters, 42, 101879. https://doi.org/10.1016/j.frl.2020.101879
- Klein, T., Pham Thu, H., & Walther, T. (2018). Bitcoin is not the new gold – a comparison of volatility, correlation, and portfolio performance. International Review of Financial Analysis, 59, 105–116. https://doi.org/10.1016/j.irfa.2018.07.010
- Kliber, A., Marszałek, P., Musiałkowska, I., & Świerczyńska, K. (2019). Bitcoin: Safe haven, hedge or diversifier? Perception of bitcoin in the context of a country’s economic situation—a stochastic volatility approach. Physica A: Statistical Mechanics and Its Applications, 524, 246–257. https://doi.org/10.1016/j.physa.2019.04.145
- Kristjanpoller, W., Bouri, E., & Takaishi, T. (2020). Cryptocurrencies and equity funds: Evidence from an asymmetric multifractal analysis. Physica A: Statistical Mechanics and Its Applications, 545, 123711. https://doi.org/10.1016/j.physa.2019.123711
- Mahdi, E., Leiva, V., Mara’Beh, S., & Martin-Barreiro, C. (2021). A new approach to predicting cryptocurrency returns based on the gold prices with support vector machines during the COVID-19 pandemic using sensor-related data. Sensors, 21(18), 6319. https://doi.org/10.3390/S21186319
- Matha, R., E. G., Kumar, S., & Raghavendra. (2022). Dynamic relationship between equity, bond, commodity, forex and foreign institutional investments: Evidence from India. Investment Management and Financial Innovations, 19(4), 65–82. https://doi.org/10.21511/IMFI.19(4).2022.06
- Mensi, W., Gubareva, M., Ko, H. U., Vo, X. V., & Kang, S. H. (2023). Tail spillover effects between cryptocurrencies and uncertainty in the gold, oil, and stock markets. Financial Innovation, 9(1), 92. https://doi.org/10.1186/s40854-023-00498-y
- Noman, A. H. M., Karim, M. M., Hassan, M. K., Khan, M. A., & Pervin, S. (2023). COVID-19 pandemic and the dynamics of major investable assets: What gives shelter to investors? International Review of Economics & Finance, 86, 14–30. https://doi.org/10.1016/j.iref.2023.03.003
- Nyakurukwa, K., & Seetharam, Y. (2023). Stock market integration in Africa: Further evidence from an information‐theoretic framework. International Finance, 26(1), 2–18. https://doi.org/10.1111/infi.12419
- Omri, I. (2023). Directional predictability and volatility spillover effect from stock market indexes to Bitcoin: Evidence from developed and emerging markets. The Journal of Risk Finance, 24(2), 226–243. https://doi.org/10.1108/JRF-06-2022-0130
- Omrı, I., & Ozcelebı, O. (2023). Examination of the impacts of cryptocurrency uncertainty on exchange-traded funds. Singapore Economic Review, https://doi.org/10.1142/S0217590823500509
- Parsva, P., & Tang, C. F. (2017). A note on the interaction between stock prices and exchange rates in Middle-East economies. Ekonomska Istraživanja [Economic Research}, 30(1), 836–844. https://doi.org/10.1080/1331677X.2017.1311222
- Patel, R. J. (2017). Co-movement and integration among stock markets : A study of 14 countries. Indian Journal of Finance, 11(9), 53–66. https://doi.org/10.17010/ijf/2017/v11i9/118089
- Ross, S. A. (2013). The arbitrage theory of capital asset pricing, 11–30.https://www.worldscientific.com/doi/abs/10.1142/9789814417358_0001
- Saxena, S. P., & Bhadauriya, S. (2012). Causal analysis of oil prices and macroeconomic performance: Evidence from India. Asia-Pacific Journal of Management Research and Innovation, 8(4), 451–459. https://doi.org/10.1177/2319510X13481904
- Shilov, K. D., & Zubarev, A. V. (2021). Evolution of Bitcoin as a financial asset. Finance: Theory and Practice, 25(5), 150–171. https://doi.org/10.26794/2587-5671-2021-25-5-150-171
- Singh, N. P., & Sharma, S. (2018). Cointegration and causality among dollar, oil, gold and sensex across global financial crisis. Vision, 22(4), 365–376. https://doi.org/10.1177/0972262918804336
- Thampanya, N., Nasir, M. A., & Huynh, T. L. D. (2020). Asymmetric correlation and hedging effectiveness of gold & cryptocurrencies: From pre-industrial to the 4th industrial revolution. Technological Forecasting and Social Change, 159, 120195. https://doi.org/10.1016/J.TECHFORE.2020.120195
- Tudor, C., & Popescu-Dutaa, C. (2012). On the causal relationship between stock returns and exchange rates changes for 13 developed and emerging markets. Procedia - Social and Behavioral Sciences, 57, 275–282. https://doi.org/10.1016/j.sbspro.2012.09.1186
- Vidal-Tomás, D., Briola, A., & Aste, T. (2023). FTX’s downfall and Binance’s consolidation: The fragility of centralised digital finance. Physica A: Statistical Mechanics and Its Applications, 625, 129044. https://doi.org/10.1016/j.physa.2023.129044
- Wei, L., Lee, M. C., Cheng, W. H., Tang, C. H., & You, J. W. (2023). Evaluating the efficiency of financial assets as hedges against Bitcoin risk during the COVID-19 pandemic. Mathematics, 11(13), 2917. https://doi.org/10.3390/math11132917
- Xunfa, L. U., Liu, S. K., San Liang, X., Zhang, Z., & Hairong, C. U. I. (2020). The break point-dependent causality between the cryptocurrency and emerging stock markets. Economic Computation and Economic Cybernetics Studies and Research, 54(4/2020), 203–216. https://doi.org/10.24818/18423264/54.4.20.13
- Yang, J., De Montigny, D., & Treleaven, P. (2022). ANN, LSTM, and SVR for Gold Price Forecasting. 2022 IEEE Symposium on Computational Intelligence for Financial Engineering and Economics, CIFEr 2022 - Proceedings. https://doi.org/10.1109/CIFER52523.2022.9776141
- Yarovaya, L., Matkovskyy, R., & Jalan, A. (2021). The effects of a “black swan” event (COVID-19) on herding behavior in cryptocurrency markets. Journal of International Financial Markets, Institutions and Money, 75, 101321. https://doi.org/10.1016/j.intfin.2021.101321