
ABSTRACT
Among the vital signs collected during hospital triage, respiratory rate is an important parameter associated with physiological, pathophysiological, and emotional changes. In recent years, the importance of its verification in emergency centers due to the severe acute respiratory syndrome 2 (SARS2) pandemic has become very clear, although it is still one of the least evaluated and collected vital signs. In this context, infrared imaging has been shown to be a reliable estimator of respiratory rate, with the advantage of not requiring physical contact with patients. The objective of this study was to evaluate the potential of analyzing a sequence of thermal images as an estimator of respiratory rate in the clinical routine of an emergency room. We used an infrared thermal camera (T540, Flir Systems) to obtain the respiratory rate data of 136 patients, based on nostrils’ temperature fluctuation, during the peak of the COVID-19 pandemic in Brazil and compared it with the chest incursion count method, commonly employed in the emergency screening procedures. We found a good agreement between both methods, with Bland-Altman limits of agreement ranging from −4 to 4 min−1, no proportional bias (R2 = 0.021, p = 0.095), and a strong correlation between them (r = 0.95, p < 0.001). Our results suggest that infrared thermography has potential to be a good estimator of respiratory rate in the routine of an emergency room.
Introduction
Vital signs are the primary interface between the health-care team and a patient’s clinical conditions, reflecting the circulatory, respiratory, neurological, and endocrine functions of the individual [Citation1]. Basically, four vital signs are used in the clinical routine: heart and respiratory rate, body temperature, and blood pressure.
Respiratory Rate (RR) was an important part of the criteria for determining poor respiratory quality, presumption of severity, and poor prognosis in SARS2 patients [Citation2], once severe cases can lead to alveolar damage and progressive respiratory failure [Citation3].
In adults, RR ranges from 12 to 18 min−1 under resting conditions and can be useful in assessing the severity of several diseases related to respiratory disorders, such as obstructive sleep apnea, bronchitis, and asthma; it is also an important predictor of cardiac arrest and admission to intensive care unit [Citation4–6]. In some guidelines, tachypnea is defined as a RR greater than 20 bpm and advises chest radiography when detected [Citation7]. In addition, some studies have indicated that, coupled with oxygen saturation (SATO2), RR has proven to be a valuable metric in determining clinical deterioration [Citation8,Citation9], with an increase of 3 to 5 breaths per minute, for example, indicating a progressive worsening of the overall clinical picture [Citation9].
In the Emergency Room (ER), most common methods to assess RR are auscultation of chest respiratory flow and/or the mere counting of respiratory incursions by the health-care provider. Not uncommonly, inaccurate measurement of RR can have significant implications for patient care, and interestingly, this parameter remains the only vital sign usually measured manually [Citation10,Citation11]. Furthermore, in addition to being less accurate than using sensors, they are particularly problematic during outbreaks of highly contagious diseases as it involves direct patient contact and does not allow continuous monitoring of the patient’s clinical status for this parameter [Citation12–15].
Infrared thermography imaging has shown reliable results as an estimator of RR, suggesting that it could be a clinically relevant alternative to currently available methods [Citation6,Citation16–18]. The evaluation of RR through thermography is based on the fluctuation of nostrils temperature during the respiratory cycle [Citation6,Citation18]. In the respiration cycle, the cold air is inspired as a result of inspiration and warm air is exhaled from lungs, during expiration. The thermal camera is sensible enough to detect this fluctuation, thus it is possible to calculate an estimate of the person’s RR without any physical contact [Citation19].
Therefore, in this study, we aimed to provide a framework to collect RR through infrared thermography and assess its potential as an estimator for this parameter when compared to the chest incursion count method, usually employed in the ER.
Methods
Patient acclimation and study design
We evaluated the body temperature and respiratory rate of 136 patients at admission to the ER of the University Hospital of São Paulo (HU-USP). Data collection took place during the first peak of the Covid-19 pandemic in Brazil, from June to September 2020; a scenario that allowed us to obtain mild to serious changes in the respiratory patterns. At the patient admission and after the initial registration, the subject was invited to sit in front of the equipment for 5 minutes for thermal acclimation, it was also asked to remove the mask, glasses, and any other object that could interfere in data collection. As the collection took place in a hospital emergency department and we tried to simulate the daily routine of the screening procedure for respiratory viral syndromes, no extra effort was made to control room temperature. The thermal data was captured using a FLIR T540 Thermal Camera (minimum resolution 320X240, thermal sensitivity less than 40 mK) attached to a rod connected to a computer, where the operator had control to begin the data collection. The patient was positioned around 0.80 m from the thermal sensor and, after the thermal acclimation, a radiometric video of 30 seconds was captured at 30 fps and stored for RR and skin facial temperature analysis. No physical contact between the operator and patient occurred during thermographic collection. After data collection, we also sought to assess the incidence of COVID-19 in patients, so we used a nasopharyngeal swab RT-PCR testing for COVID-19.
Respiratory rate estimation with infrared thermography
The standard procedure for RR assessment in the Emergency Department is based on counting patients’ chest incursions; each cycle of inspiration and expiration corresponds to 1 complete respiratory cycle. The health-care provider usually asks the patient to lie in a supine position, places one hand on the patient’s wrist, and observes the patient counting chest movements for 30 seconds. We classified abnormal RR as values greater than 18 min−1 (breath per minute) and normal values ranging between 12 and 18 min−1 [Citation6]. Once this is the most common procedure to assess RR in the ER and the only one collected by health staff on occasion, we considered this method the ground truth for comparisons with thermography.
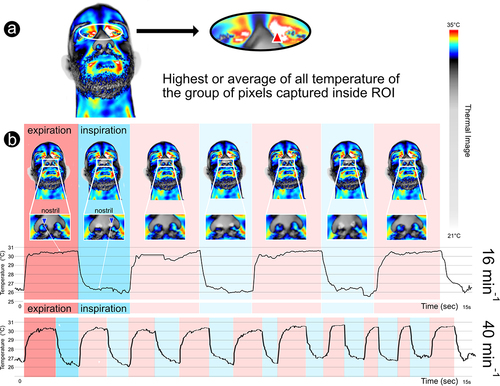
To evaluate the thermal data, we processed the radiometric videos in the Flir Tools+TM software and the region of Interest (nostril environment) was tracked manually by the operator (). During these 30 seconds of radiometric capture, the respiratory waveforms were extracted and analyzed by a blinded operator, who was unaware of the patient’s SARS-CoV-2 RT-PCR test results. In order to compare the breath per minute (min−1), we multiplied the obtained values by 2. A video of the process of capturing RR using infrared camera is provided as supplementary material.
Figure 1. Methodology used to collect clinical parameters through infrared thermography: a – Regions of interest (ROIs) used to collect IRT superficial max face temperature (red triangle: max mid-eye corner temperature between both eyes); b – IRT respiratory rate collection, evidencing the breath waveforms (16 min−1 and 40 min−1), through nostril temperature fluctuation, recorded in real time (blue triangle – in this case minimum temperature being captured at each frame inside the ROI – rectangle).
Alongside RR, we collected the following parameters of each patient evaluated during the hospital admission: sex, age (in years), heart rate (HR, in bpm), Oxygen Saturation (SATO2, in %), and the max temperature of the face (°C) (). These parameters are commonly collected during early patient evaluation and admission.
Data analysis
After checking for normality using the Shapiro-Francia test, non-normal data were represented by median and interquartile range (IQR), while symmetric data were reported by mean and standard deviation (SD). Univariate statistics of each parameter were performed using the Mann-Whitney-Wilcoxon or t-Student test, according to data distribution.
For evaluation of the potential of thermography to correctly estimate RR, we used Bland-Altman (BA) plots to compare the ground truth method (chest incursion counting) with infrared thermography in order to check the limits of agreement between them. BA plots illustrate the difference between the two measurements as a function of means and the confidence interval is defined as two standard deviation ranges within which 95% of the differences lie [Citation20,Citation21]. Proportional bias was checked by a regression using the differences as the outcome variable and the mean values between the two methods as the predictor. The proportional bias analysis is important, once it allows us to check if there is any tendency in our target measurements according to the mean values of our measures. In other words, it allows us to determine whether the target method tends to miss up or down related to the average. In a perfect scenario, differences between measurements of both methods should tend to zero and no bias should be found.
Ethical guidelines
Written informed consent was obtained from all participants or their guardians (mostly a close family member). The study was approved by the Research Ethics Committee of HU-USP, São Paulo, Brazil and is approved in the Plataforma Brasil system under CAAE −33665920.0.0000.0076. The personal data of all participants are protected by anonymity and the eventual use of thermal images of the subjects’ faces in scientific publications is covered by the consent form.
Results
clearly shows that it is possible to distinguish different respiratory patterns using infrared imaging. In this figure, it is possible to identify two different patterns of respiratory rate: (1) normal with a frequency of 16 min−1 and (2) abnormal with a frequency of 40 min−1 (indicating tachypnea).
shows a summary of the demography and the descriptive statistics of each parameter evaluated in this study, grouped by PCR results. As can be seen in statistical differences were found for age, SATO2 and RR (for both thermography and chest incursion). Among all parameters collected, our results suggest that RR has the most potential to separate COVID-19 infected from non-infected, with positive cases usually having significantly higher respiratory frequency (RRChestIncursion: negatives = 17 iqr 2; positives = 24 iqr 9; RRInfrared: negatives = 16 iqr 4; positives = 26 iqr 10).
Figure 2. Box plots and statistical comparisons between negative (0) and positive (1) cases of COVID-19, for each parameter evaluated. Statistical significances were found for age (t = −2.16, p = 0.03), oxygen saturation (W = 3069.5, p < 0.001), infrared RR (W = 880, p < 0.001), and chest incursion RR (W = 914, p < 0.001).
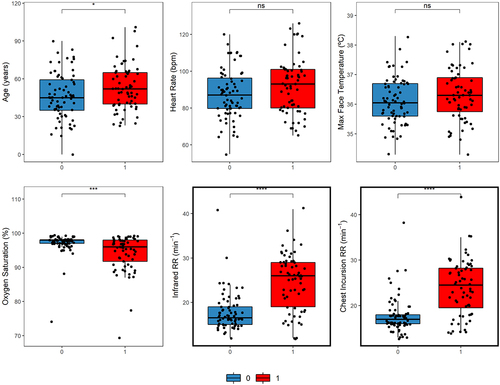
Table 1. Demography of study’s participants with summary statistics of the parameters evaluated. Age, Max Face Temperature and Heart Rate are represented by means and standard deviation, Respiratory Frequency and Oxygen Saturation in median and interquartile range, according to their statistical distribution.
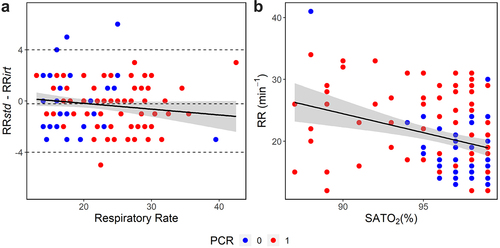
BA analysis is shown in with the limits of agreement ranging from −4 to 4 bpm. The mean difference of measurements between both methods was 0.21 min−1 and was not statistically different from zero (W = 2748, p = 0.128). No significant proportional bias was found (R2 = 0.021, p = 0.095) and a high correlation between the measurements of both methods was obtained (r = 0.95, p < 0.001). Finally, shows a negative and significant correlation between RR and SATO2 (r = −0.32, p < 0.001), indicating a tendency of patients with abnormal patterns of RR to present lower oxygen saturation in blood, which is expected.
Figure 3. Bland-Altman plot and correlation between RR and SATO2. (a) Limits of agreement varied from −4 to 4 min−1 with the mean of differences between measurements of −0.21 min−1 (dashed lines); solid line represents a linear regression (95% CI, shaded area), indicating that no proportional bias was found (R2 = 0.021, p = 0.095). Respiratory rate was calculated as the average of RRstd and RRirt. (b) Correlation between RR and SATO2 grouped by RT-PCR result (r = −0.32, p < 0.001) (negative = 0 and positive = 1 for COVID-19).
Discussion
As shown in , Infrared thermography showed good agreement regarding the estimation of RR when compared to the chest incursion counting. Limits of agreement ranged from −4 to 4 min−1 and, although it was wider than in other studies, such as [Citation6], it is important to take into account that the ground truth method used in this study is prone to errors, once it depends on manual counting chest incursions by the health staff and could be affected by heavy workload, stress, and distractions during the ER routine in the pandemic. We also found high correlation between methods (r = 0.95) and no apparent proportional bias, reinforcing the potential of thermography as a RR estimator. When considered the results grouped by the results of RT-PCR test, both techniques were able to detect significant differences between infected and noninfected for COVID-19 at the same level of statistical confidence, with positive cases having higher respiratory frequencies ().
The role of infrared thermography on the estimation of RR is relatively new and some studies have tested its usage with generally promising results, usually based on nostril temperature fluctuation. Most studies took place in controlled environments and aimed mostly to propose algorithms to track RR automatically and to compare thermography with different ground truth methods, with healthy subjects simulating different breath patterns. For the time, our study tested the potential of this technique to estimate RR in adults in an ER routine, during COVID-19 pandemics.
Fei and Pavlidis [Citation17] developed an algorithm to track the nostrils of 20 healthy individuals to recover the breath waveforms using infrared thermography (Flir SC6000, 640 × 512 px). The authors used a thermistor to directly register the nostrils temperature variation as the ground truth method and compared to results obtained through the thermal camera. In their experiment, it was possible to recover the breath waveforms with high degree of agreement between methods, concluding that thermography can potentially be used as an investigative tool for breathing physiology.
Infrared thermography showed to be useful to extract breath-to-breath timing intervals and relative tidal volume [Citation18]. The author’s experiment was carried out in 25 participants that simulated different breath patterns and thermal data was collected using a TVS-700 and a FLIR SC6000, as ground truth the inductance plethysmography was applied. The results showed high correlation and agreement between both methods, demonstrating the potential use of infrared image to monitor respiration process.
Pereira et al. [Citation6] found an excellent agreement between estimated RR, using thermography, compared to the thoracic effort measured with piezo plethysmography as the ground truth. The authors evaluated the performance of infrared images in 11 health subjects that simulated 3 different respiratory patterns (normal breathing, breathing with head movement and a sequence of different breathing patterns), concluding that infrared thermography is a promising and clinically relevant alternative for standard methods of collecting RR. In another study, Pereira et al. [Citation22] expanded their initial findings to 20 subjects and found, for RR, a mean error of 0.03 ± 0.01 and a RMSE of 0.71 ± 0.30 min−1 when comparing infrared thermography to piezo plethysmography, reinforcing their initial findings.
Other studies have shown the potential of thermography to monitor respiration of neonates. Abbas et al. [Citation16] collected thermal data of seven premature infants in order to track their respiratory patterns, using a VarioCAM HR with a thermal sensitivity of 0.05°C at 30°C. In this study, promising preliminary results on infant’s nostrils tracking were obtained and the respiration process was successfully monitored based on 0.3°C to 0.5°C temperature variation between inspiration and expiration phases. Finally, Lorato et al. [Citation23] tested infrared imaging to monitor respiration of neonates using 152 minutes of infrared recording in seven infants. As ground truth, the authors used chest impedance, which can be obtrusive and cause skin damage to the infants. The authors developed a system independent of nostril tracking and facial landmark detection in multi-camera low resolution thermal videos (Flir Lepton Cameras, 60 × 80 pixels) based on three image thermal signatures: pseudo-periodicity, respiration rate spatial clusters, and thermal gradient. Despite serious limitations due to ward routine, the authors were able to detect both respiratory motion and flow, when the camera position was favorable.
In conclusion, we found that infrared imaging can be quite useful and an accurate estimator of RR in practical conditions. In a context of high contagious epidemics, this is especially valuable for safety of early screening procedures for SARS2 diseases in the emergency room, due to noncontact and harmless radiation, characteristics of infrared technique. We can also emphasize that, through the sequence of breathing data collected by infrared thermography, it is also possible to obtain the average time of inspirations and expirations in real time. This opens up the possibilities of future works to explore, with more details, the flow of heat exchanges in the nostrils associated with those parameters.
List of Abbreviations
RR Respiratory rate;
ER Emergency room;
HR Heart rate;
BA Bland-Altman;
SATO2 Oxygen saturation;
RT-PCR Reverse transcription polymerase chain reaction;
SARS Severe acute respiratory syndrome;
CI Confidence Interval.
Disclosure statement
No potential conflict of interest was reported by the authors.
References
- Chester JG, Rudolph JL. Vital signs in older patients: age-related changes. J Am Med Dir Assoc. 2011;12(5):337–343. PMID: 21450180; PMCID: PMC3102151.
- Rechtman E, Curtin P, Navarro E, et al. Vital signs assessed in initial clinical encounters predict COVID-19 mortality in an NYC hospital system. Sci Rep. 2020;10:21545.
- Huang C, Wang Y, Li X, et al. Clinical features of patients infected with 2019 novel coronavirus in Wuhan, China. Lancet. 2020;395(10223):497–506. PMID: 31986264; PMCID: PMC7159299.
- Cretikos MA, Bellomo R, Hillman K, et al. Respiratory rate: the neglected vital sign. Med J Aust. 2008;188(11):657–659. PMID: 18513176.
- Droitcour AD, Seto TB, Park B-K, et al. Non-contact respiratory rate measurement validation for hospitalized patients. Annu Int Conf IEEE Eng Med Biol Soc. 2009;2009:4812–4815. PMID: 19963625; PMCID: PMC4313750
- Pereira CB, Yu X, Czaplik M, et al. Remote monitoring of breathing dynamics using infrared thermography. Biomed Opt Express. 2015;6(11):4378–4394. PMID: 26601003; PMCID: PMC4646547.
- Ebell MH. Predicting pneumonia in adults with respiratory illness. Am Fam Physician. 2007;76(4):560–562. PMID: 17853631
- Mochizuki K, Shintani R, Mori K, et al. Importance of respiratory rate for the prediction of clinical deterioration after emergency department discharge: a single‐center, case–control study. Acute Med Surg. 2017;4(2):172–178.
- Molgaard RR, Larsen P, Hakonsen SJ. Effectiveness of respiratory rates in determining clinical deterioration: a systematic review protocol. JBI Database Syst Rev Implement Rep. 2016;14(7):19–27.
- Bianchi W, Dugas AF, Hsieh Y-H, et al. Revitalizing a vital sign: improving detection of tachypnea at primary triage. Ann Emerg Med. 2013;61(1):37–43. PMID: 22738682.
- Zane RD. Emergency department triage respiratory rate measurements are often inaccurate. NEJM J Watch. 2013.
- Centre for Clinical Practice at NICE (UK). Acutely ill patients in hospital: recognition of and response to acute illness in adults in hospital. London: national Institute for Health and Clinical Excellence (UK); 2007
- Philip KEJ, Pack E, Cambiano V, et al. The accuracy of respiratory rate assessment by doctors in a London teaching hospital: a cross-sectional study. J Clin Monit Comput. 2015;29:455–460.
- Lovett PB, Buchwald JM, Stürmann K, et al. The vexatious vital: neither clinical measurements by nurses nor an electronic monitor provides accurate measurements of respiratory rate in triage. Ann Emerg Med. 2005;45(1):68–76. PMID: 15635313.
- Edmonds ZV, Mower WR, Lovato LM, et al. The reliability of vital sign measurements. Ann Emerg Med. 2002;39(3):233–237.
- Abbas AK, Heimann K, Jergus K, et al. Neonatal non-contact respiratory monitoring based on real-time infrared thermography. Biomed Eng Online. 2011;10(1):93. PMID: 22243660; PMCID: PMC3258209.
- Fei J, Pavlidis I. Thermistor at a distance: unobtrusive measurement of breathing. IEEE Trans Biomed Eng. 2010;57(4):988–998. PMID: 19789102.
- Lewis GF, Gatto RG, Porges SW. A novel method for extracting respiration rate and relative tidal volume from infrared thermography. Psychophysiology. 2011;48(7):877–887. PMID: 21214587; PMCID: PMC3107393.
- Pan F, Yang L, Li Y, et al. Factors associated with death outcome in patients with severe coronavirus disease-19 (COVID-19): a case-control study. Int J Med Sci. 2020;17(9):1281–1292. PMID: 32547323; PMCID: PMC7294915.
- Bland JM, Altman DG. Measuring agreement in method comparison studies. Stat Methods Med Res. 1999;8(2):135–160. PMID: 10501650.
- Bland JM, Altman DG. Statistical methods for assessing agreement between two methods of clinical measurement. Lancet. 1986;327(8476):307–310. PMID: 2868172.
- Pereira CB, Czaplik M, Blazek V, et al. Monitoring of cardiorespiratory signals using thermal imaging: a Pilot Study on healthy human subjects. Sensors. 2018;18(5):1541. PMID: 29757248; PMCID: PMC5982845.
- Lorato I, Stuijk S, Meftah M , et al. Multi-camera infrared thermography for infant respiration monitoring. Biomed Opt Express. 2020;11:4848–4861.