
 ?Mathematical formulae have been encoded as MathML and are displayed in this HTML version using MathJax in order to improve their display. Uncheck the box to turn MathJax off. This feature requires Javascript. Click on a formula to zoom.
ABSTRACT
The Bharathapuzha river (Length = 209 km; Area = 6186 km2; order (N) = 8th) is the second-largest river in Kerala State, India. The midland part of the river (Area = 1854 km2) has been studied to bring out the variation in hydrochemistry and quality due to anthropogenic and geological influences. The study area is the ‘rice-bowl’ of the State and is characterized by its unique geography, sub-humid to semi-arid climate, industrial activities, and intense agricultural practices. The major ion chemistry of the Bharathapuzha river, based on surface water from 27 locations for three seasons, is mainly controlled by carbonate weathering, with Ca2+ and HCO3− ions dominating the composition. Gibbs plots revealed rock–water interaction as the major mechanism controlling the surface water chemistry, and scatter diagrams revealed carbonate weathering significantly and silicate weathering marginally contributing the ions to the surface water. Majority of the water quality parameters exhibited values within the desirable limits of WHO guidelines and Bureau of Indian Standards for drinking purposes, and showed distinct seasonal variations. Quality degradation was observed at some locations, where the tributaries were close to industrial units and domestic dwellings. Strong correlation results of K+ with Cl− and PO43-, and the presence of organochlorine pesticides aldrin and heptachlor indicate the use of nutrients and pesticides in the study area. The quality assessment revealed that 44% of samples in monsoon, 67% in post-monsoon, and 33% in pre-monsoon were suitable for drinking and domestic purposes, and almost all samples except one were found to be suitable for irrigational purpose.
Introduction
Surface water plays an important role in the overall development activities of every country, particularly in agriculture, fisheries, and power development. The health and well-being of the human race are closely tied up with the quality of water they use. Today, due to various anthropogenic activities, the surface water receives untreated sewage, industrial and agricultural effluents, domestic wastes, etc., that result in water pollution (Kosygin, Dhamendra, & Gyaneshwari, Citation2007; Prakash Kengnal, Megeri, Giriyappanavar, & Patil, Citation2015). Even countries with vast water resources are also threatened with deteriorating water quality (Sharma, Bajracharya, Sitaula, & Merz, Citation2005). Water quality is much depending on the desired use of water, hence different uses require different criteria of water quality assessment as well as a standard method for reporting and comparing the result of water analysis (Babiker, Mohamed, & Hiyama, Citation2007). Therefore, understanding the chemical composition of water is essential for evaluating its suitability for different purposes. The chemical composition of surface water and its properties in a region is governed by natural processes such as precipitation rate, weathering processes, soil erosion, and anthropogenic effects (Jarvie, Whitton, & Neal, Citation1998; Nouri et al., Citation2009, Citation2011; Todd, Citation1980). The chemical composition of natural waters strongly reflects the geology of the catchment area in which it originates (Bricker & Rice, Citation1989; Clark, Citation1924; Hem, Citation1985). Stallard and Edmond (Citation1981, Citation1983) assessed the influence of geology and weathering environment on the dissolved constituents in the rivers of the Amazon. Among various anthropogenic sources, agricultural non-point pollution, particularly the nutrient leaching or runoff from rice fields, is the leading source of water quality deterioration in rivers and lakes (Ahmad et al., Citation1994; Galloway et al., Citation2003; Laegreid, Bockman, & Karlstad, Citation1999). Several types of agricultural pollutants such as fertilizers and pesticides were also found to impose severe damage to the aquatic ecosystem (Mullick & Konar, Citation1999). Problems arising out of water quality deterioration are as severe as those related to water availability. It is reported that about 70% of India’s surface water resources are already contaminated (Rao & Mamatha, Citation2004). The condition in Kerala State in the SW of India is equally alarming and as per reports, the water in various stretches of many rivers in the State is not potable (KSPCB, Citation2000).
Palakkad district, chiefly Chittur and Palakkad taluks, are known as the ‘rice bowl’ of Kerala State, India, with plenty of paddy fields and palm trees, and its economy is sustained primarily by agriculture which engages more than 65% of workers in this sector. The people in the district rely mainly on surface water like rivers and reservoirs for agricultural and drinking purposes. Since they thrive predominantly on agricultural activities, the use of fertilizers and pesticides has become a common practice. Nutrients from fertilizers or wastes, not utilized by paddy crops, may enter from the farmyard into the surface water or groundwater, ultimately making it unsuitable for drinking (Kiely, Citation1998). In addition to this, several industrial units set up on the banks of the upstream portion of the Bharathapuzha river might have an influence on the quality of surface water. Considering the agricultural and industrial activities, unique climate, geology, and the soaring water demand, an attempt has been made in this paper to depict the spatial and temporal variation in the chemical attributes, nutrients and pesticide contents in the river water samples.
Study area
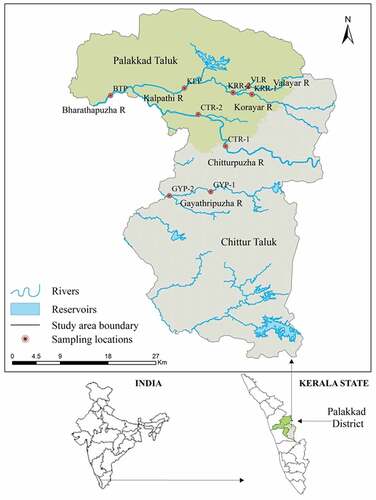
The Bharathapuzha river (L = 209 km; A = 6186 km2, N = 8th) is one of the two largest rivers in Kerala, India. The river originates from the Western Ghats at Anaimalai Hills (elevation = 1964 m.s.l) and flows through highland, midland, lowland, and coastal land, and joins the Arabian Sea in the west coast at Ponnani. The midland part of this river and its major tributaries flowing through Palakkad and Chittur taluks (Area = 1854 km2) of Palakkad district, Kerala were selected for the study. The important tributaries of Bharathapuzha, which drain through the study area include Korayar, Walayar, Kalpathipuzha, Chitturpuzha, and Gayathripuzha. Most of the Bharathapuzha river basin, in the midland and parts of lowland, are under intense agricultural activities. Palakkad district alone contributes about 34% of the total rice paddy production in the State. The study area showing major tributaries and sampling sites is shown in .
Figure 1. Location map showing the major tributaries of Bharathapuzha and the corresponding sampling sites.
Geology
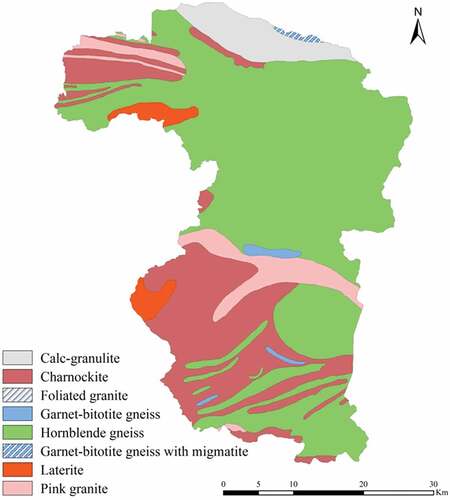
Archean crystallines are the major rock types encountered in the study area that include charnockites, khondalites, calc-granulites, hornblende gneiss, migmatites, and gneisses (Soman, Citation1977). Khondalites and calc-granulites are seen in the northern part of Palakkad and are traversed by a number of pegmatite veins. The ‘Palakkad Gap’ (L = 32 km), a prominent structural discontinuity in the 960 km long Western Ghats of India lies toward the eastern part, is covered mainly by hornblende-biotite gneiss and is migmatised. The northern flank of the Gap consists of a meta-sedimentary sequence of khondalite and calc-granulite with crystalline limestone bands (Soman, Citation1977). Pegmatites and quartz veins are observed all over the district, especially in the eastern and north-eastern parts. Extensive cover of laterite occurs all over the midland region of the district forming the ‘Palakkad Gap’ – a structural gap in the Western Ghats. These rocks have undergone weathering into laterite, further weathering has given rise to lateritic soil (Water Atlas of Kerala, Citation1995). The detailed geology of the study area is depicted in .
Figure 2. Geological map of the study area.
Climate
The annual average rainfall of Palakkad district is 2106.0 mm (India Meteorological Department IMD, Pune). The rainfall decreases from the west toward east, varying from 2850.0 mm in the west (at Mannarkkad) to 1757.0 mm near the southeastern part (at Chittur). At Palakkad, maximum temperature ranges from 28.1°C to 37.4°C, whereas minimum temperature ranges from 22.2°C to 25.3°C. The annual average maximum and minimum temperatures are 32.3°C and 23.4°C, respectively.
Land use/land cover
The study area is spread over 1854 km2. Among the various land use/land cover types, forest and agricultural land share nearly 30% each, followed by rice paddy cultivation with 15%. The land use/land cover map and the areal extent of different classes are depicted in and respectively.
Figure 3. Land use/land cover map of the study area.
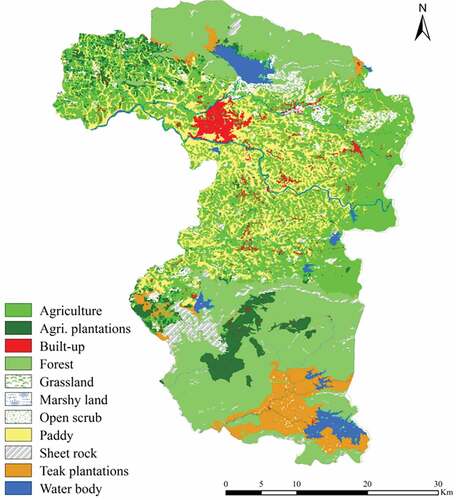
Table 1. Land use/land cover classes in the study area.
Materials and methods
A total of 27 (9 sites × 3 seasons) river water samples were collected from the selected sites of the prominent tributaries of Bharathapuzha, viz., Valayar (VLR), Korayar (KRR-1 & KRR-2), Kalpathipuzha (KLP), Chitturpuzha (CTR-1 & CTR-2), Gayathripuzha (GYP-1 & GYP-2), and the Bharathapuzha mainstream (BTP) for three seasons, viz., monsoon (MON) and post-monsoon (POM) of 2005 and pre-monsoon (PRM) of 2006. The portrait of surface water sampling sites is shown in .
Table 2. Portrait of surface water sampling locations.
The samples were analyzed for various chemical attributes following standard procedures of APHA (Citation1995). The temperature and pH were measured at the site. Electrical Conductivity (EC) and Total Dissolved Solids (TDS) were analyzed with the Water and Soil Analysis Kit model 1160 E. Total alkalinity (TA), total hardness (TH), Ca2+, Mg2+, CO32-, HCO3−, and Cl− were estimated by standard titrimetric methods. Na+ and K+ were measured with the flame photometric method. Nutrients such as NO3−, PO43-, and SiO2 were analyzed using Spectrophotometer following brucine, stannous chloride, and molybdosilicate methods, respectively.
The pesticide analysis was done by adopting the standard procedure available (AOAC, Citation2000) using GC-Shimadzu 2010 equipped with ECD (63Ni). For this purpose, four river samples, one from each of the major tributaries (viz., KLP, CTR-1, GYP-1, and BTP), were selected for MON and PRM, and three river samples, one each from CTR-1, GYP-1, and BTP for POM. These were analyzed for 14 important organochlorine pesticides (viz., α-HCH, β-HCH, γ-HCH, δ-HCH, α-Endosulfan, β-Endosulfan, Endosulfan sulfate, O,P-DDT, P,P-DDT, P,P-DDE, P,P-DDD, aldrin, heptachlor, and dicofol).
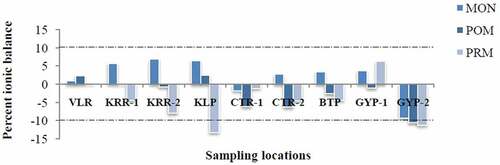
The data of water quality were statistically analyzed using SPSS v.13.0 (SPSS, Citation1997). Location, geology, and land use/land cover maps were generated employing GIS (ArcGIS 9.1). The maps were prepared using Survey of India toposheets (1:50,000, 1967) & (1:25,000, 1989), land use/land cover map of Palakkad district (1995) procured from State Land Use Board and geology map prepared by CGWB (Citation2005) after modification based on field study. The quality of analytical data was evaluated by computing the ionic balance, which is calculated by comparing the sum of the equivalents of the cations with that of anions (Hounslow, Citation1995) using the following formula.
A positive number means that either there are excess cations or insufficient anions in the analysis, whereas a negative number corresponds to excess anions or insufficient cations. For freshwater, balance is assumed to be good if it is ±10% (Celesceri, Greenberg, & Eaten, Citation1998). Almost all the samples in the study area (i.e. 24 out of 27) showed values within this limit, which in turn indicates the high quality of analytical data ().
Figure 4. Percent ionic balance of surface water samples.
Results and discussion
The analytical results of physico-chemical attributes of river water samples in the study area for MON, POM, and PRM showing minimum, maximum, mean, and standard deviation are given in .
Table 3. Statistical summary of the analytical data, Bharathapuzha river.
Spatial and temporal variations of physico-chemical parameters
Spatio-temporal variations were quite evident, and the parameters such as Dissolved Oxygen (DO), Ca2+, Total Alkalinity (TA), and HCO3− were found to have higher contents during MON. Further, Total Dissolved Solids (TDS), Cl−, major cations (Mg2+, Na+ & K+) and nutrients (PO43- & SiO2) showed abundance during PRM. Spatial variations do exist for the majority of parameters with maximum concentration at KRR-1 and VLR (i.e. tributary samples). The spatio-temporal variations of the physico-chemical parameters are depicted in
Figure 5. Spatial and temporal variation of major cations in the surface water samples.
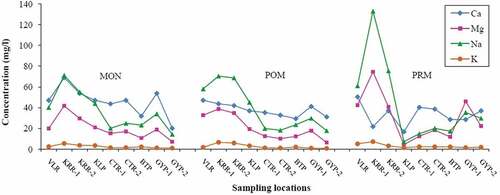
Figure 6. Spatial and temporal variation of major anions in the surface water samples.
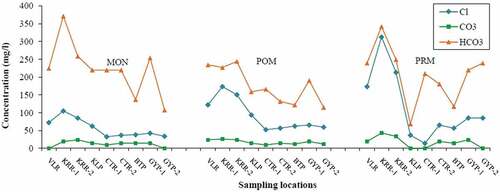
Figure 7. Spatial and temporal variation of TDS, TH, and TA in the the surface water samples.
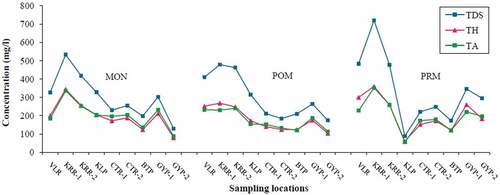
pH of analyzed samples did not vary much, and maintained a slightly alkaline nature throughout the study period. Maximum values were recorded during MON with a mean value of 7.9. Heavy rains facilitated the dissolution of crystalline limestone that is disseminated in the linear belt of khondalite in the study area, which in turn made the water slightly alkaline (Bajpayee & Verma, Citation2001). DO was abundant in most of the locations and showed season-wise averages 8.5, 9.2, and 6.8 mg/l for MON, POM, and PRM, respectively. A sharp decline in DO (2.0 mg/l) was observed at VLR during PRM. The higher concentrations during MON and POM were due to the flushing of water during rain and increased solubility of oxygen at lower temperatures. Decreases in DO can be explained by lower oxygen saturation under higher water temperatures, higher rates of organic matter decomposition, and lower re-aeration rates under low-flow conditions (Mimikou, Baltas, Varanou, & Pantazis, Citation2000). EC of water samples in the study area showed seasonal averages 531, 461, and 517 µs/cm for MON, POM, and PRM, respectively. The concentration of TDS followed similar seasonal variation, and the corresponding averages recorded were 302, 301, and 339 mg/l. Both EC and TDS results showed maximum value at KRR-1 during the entire study period. This site is situated near to the industrial units established along the riverside, and their influence is reflected in the elevated concentrations.
Total Hardness (TH) values revealed that most of the river samples belonged to hard to very hard. Very hard types (Sawyer & McCarty, Citation1967) showed maximum concentrations in PRM, particularly at stations KRR-1 and VLR. Geologically, khondalites are one of the important rock types in the study area and are associated with crystalline limestone (CGWB, Citation2005). The leaching of Ca2+ & Mg2+ from these rocks added to the total hardness. This also facilitated an increase in alkalinity values and so for bicarbonates, carbonates, and hydroxides (Stumm & Morgan, Citation1973). Alkalinity and hardness are related through common ions formed in aquatic systems. Specifically, the counter-ions associated with the bicarbonate and carbonate fraction of alkalinity are the principal cations responsible for hardness (usually Ca2+ & Mg2+). As a result, the carbonate fraction of hardness is chemically equivalent to the bicarbonates of alkalinity present in water (Burton & Pitt, Citation2002) in areas where the water interacts with limestone (Timmons, Ebeling, Wheaton, Summerfelt, & Vinci, Citation2002). That is why the water samples in the study area showed similar spatio-temporal and concentration variations for total hardness and alkalinity ().
The abundance of cations during MON was found in the order Ca2+> Na+> Mg2+> K+, and that of POM and PRM in the order Na+> Ca2+> Mg2+> K+. Higher contents of Ca2+ during MON may be due to the dissolution of calcium bearing rocks in the study area, while evaporation and Ca2+ precipitation during the dry season could be the reason for elevated Na+ concentration (Al-Mikhlafi, Das, Kaur, & Kaur, Citation2003). Further, the exchange of Ca2+ for Na+ ions in waters might have reduced the concentration of Ca2+ (Hem, Citation1991). The content of Mg2+ in the water samples showed relatively lower values with seasonal averages 20, 21, and 30 mg/l for MON, POM, and PRM, respectively. Weathering of carbonates is generally considered to be the major source of Ca2+ and Mg2+ in surface water (Al-Mikhlafi et al., Citation2003). The content of K+ also showed lower values with seasonal averages below 3 mg/l. Since clay minerals in natural water have a tendency to fix K+ and to participate in the formation of secondary minerals, the level of K+ would be very low (Mathess, Citation1982). Among the anions, HCO3− exhibited dominance over the rest, and the contents were relatively higher during MON. Bicarbonate in the surface water is derived from silicate and carbonate weathering (Al-Mikhlafi et al., Citation2003).
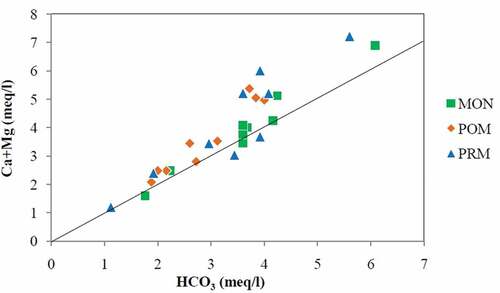
Zhang, Huang, Letolle, and Jusserand (Citation1995) have suggested 0.50 (in molar ratio) as the stoichiometric relationships of (Ca2++Mg2+)/ HCO3− in the case of carbonate weathering. The molar ratios calculated for the present investigations are very close to the suggested value, and the corresponding seasonal averages are 0.53, 0.61, and 0.60 for MON, POM, and PRM. Similarly, plots of (Ca2++Mg2+) vs HCO3− () showed that most of the points for all the seasons linearly spread around the equiline. The average ratios of (Ca2++Mg2+)/ HCO3− are 1.07, 1.22, and 1.21 for MON, POM, and PRM, respectively.
Figure 8. Scatter diagram of (Ca2++Mg2+) vs HCO3.
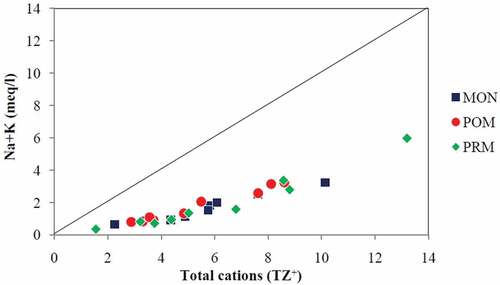
Moreover, the plots of (Ca2++Mg2+) vs total cations () and (Na++K+) vs total cations () showed that the entire points were falling below the equiline, and it is quite obvious that (Ca+ & Mg+) are enriched more than two times the amount of (Na+ and K+). Further, it is seen that the data points are very close to the equiline for (Ca2++Mg2+) vs total cations compared to (Na++K+) vs total cations suggesting carbonate weathering as dominant in the study area (Srinivasamoorthy et al., Citation2008). Though the linear relationship of (Na++K+) vs total cations indicates silicate weathering, which is the major source of Na+ and K+ (Stallard & Edmond, Citation1983; Vasu et al., Citation2017), the low ratio between (Na++K+) and total cations indicates that silicate weathering is not significant in the major ion chemistry of the surface water in the study area. The ratios of (Ca2++Mg2+) to total cations are 0.71, 0.69, and 0.72 for MON, POM, and PRM, respectively, while the corresponding ratios of (Na++K+) to total cations are 0.29, 0.31 & 0.28.
Figure 9. Scatter diagram of (Ca2++Mg2+) vs total cations (TZ+).
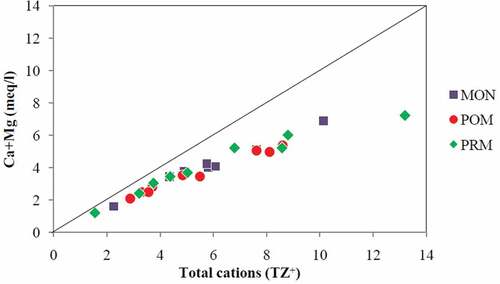
Figure 10. Scatter diagram of (Na++K+) vs total cations (TZ+).
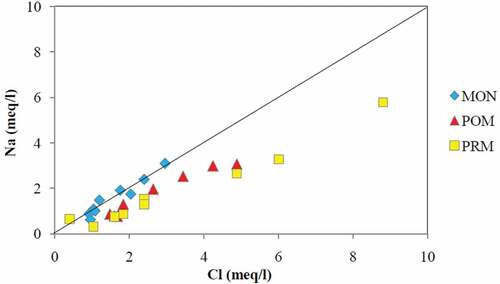
Chloride showed average values 56, 93, and 116 mg/l for MON, POM, and PRM seasons, respectively. Maximum values were recorded at KRR-1 throughout the study period. Generally, Cl− enters into the surface water from natural sources like atmospheric deposition of oceanic aerosols and weathering of rock salts (Chattopadhyay, Asa Rani, & Sangeetha, Citation2005). Anthropogenic sources were found to be dominant for Cl− contents in several previous studies (Roy, Gaillardet, & Allegre, Citation1999). The relation of Na+ vs Cl− in the surface water samples for the three seasons is demonstrated in . Generally, if Na+ is originated from the halite dissolution, then the molar ratio of Na+/Cl− should be approximately equal to 1. While if the ratio is greater than 1, Na+ is mainly contributed by silicate weathering, whereas less than 1 indicates derivation from anthropogenic sources (Adimalla, Citation2018; Kanagaraj & Elango, Citation2016). The figure indicates the sources as silicate weathering during MON and anthropogenic inputs during POM and PRM.
Figure 11. Scatter diagram of Na+ vs Cl.
NO3− and PO43- are the vital nutrients responsible for eutrophication in natural water bodies, which in turn depletes DO, ultimately affecting aquatic ecosystems (Smith, Citation2003). The present study showed a very low concentration of NO3− irrespective of seasons. Generally, NO3− enter the water due to the effect of rain that carries the residual chemical fertilizers applied to the agricultural fields (Babu, Padmalal, Maya, Sreeja, & Arun, Citation2007). Anthropogenic sources such as industrial and domestic sewage effluents, particularly runoff from agricultural fields, could be attributed to its presence, as it is an agricultural dominated basin (Chattopadhyay et al., Citation2005).
The PO43- in natural surface water mostly ranges between 0.005 and 0.020 mg/L (Chapman & Kimstach, Citation1992). As per this, PO43- content in all the samples was fairly high in the study area. Geologically, PO43- derives from weathering of mineral apatite and fluorite, which are noticed in the eastern part of the study area. Besides, intensification of agriculture using phosphatic fertilizers might also have increased its contents in surface water. SiO2 was the dominant nutrient present in all the samples and the seasonal average showed relatively higher contents in PRM (18.57 mg/l), followed by MON (14.41 mg/l) and POM (7.89 mg/l). Bajpayee and Verma (Citation2001), in their studies, established silicate dominance in Palakkad district. The silicate content is within the range of earlier studies conducted elsewhere in the world (for example, Hawaiian Islands – 3 mg/l to >30 mg/l; Davis, Citation1969).
Pesticide content
Pesticide concentration was below the detectable limit (<0.05 ppb) in all the selected samples during MON and POM. In contrast, all the samples during PRM showed pesticide contents. Among them, KLP (0.0289 ppm) and BTP (0.0092 ppm) exhibited the presence of heptachlor, and CTR-1 (0.0126 ppm) and GYP-1 (0.008 ppm) indicated aldrin contents. The guideline value for both heptachlor and aldrin in drinking water is 0.03 ppb (WHO, Citation2008). Comparing this value, the samples exceeded the limit. The presence of pesticides reflects its use in the river basin. The land use/land cover investigation () established plantation activities in the study area, in addition to paddy cultivation. The major agricultural plantations comprise rubber, coffee, tea, orange, etc. The pesticides using in such activities might have reached to the water system through agricultural runoff or aerial drifting. Heptachlor and heptachlor epoxide can travel long distances in the wind from places where they are released, such as treated fields or manufacturing sites (USDHHS, Citation1993). Volatilization is the major mechanism of transport of topically applied heptachlor. In one study, 90% of heptachlor was volatilized from bare moist soil in 2 to 3 days following application (Taylor, Glotfelty, Glass, Freeman, & Edwards, Citation1976).
Correlation analysis
The parameters showing correlation coefficient >0.7 are considered to be strongly correlated, whereas values between 0.5 and 0.7 show moderate correlation (Mason, Lind, & Marchal, Citation1983; Weber & Lamb, Citation1970). The correlation matrix of selected parameters for MON, POM, and PRM is shown in . It shows high levels of positive and negative correlation among different ions. Most of the anions and cations showed significant correlations (>0.7) with TDS, which in turn with EC. The major exchangeable ions like Na+ and Ca2+; Na+ and Mg2+ correlate positively. This reveals that rock weathering plays an important role in the major ion chemistry of the surface water in the study area. However, Na+ and Ca2+ showed very low positive correlations during PRM because of the evaporation effect and Ca2+ precipitation (Stimson, Frape, Drimmie, & Rudolph, Citation2001).
Table 4. Correlation matrix of water quality parameters for MON, POM, and PRM.
The TH and TA showed a strong positive correlation among themselves and with divalent ions such as Ca2+, Mg2+, CO32-, and HCO3−. This is a clear indication of carbonate wreathing in the study area (Timmons et al., Citation2002). Among the nutrients, PO43- is strongly correlated with Cl−, which proves a common source of anthropogenic origin such as agrochemical inputs (Bhatt & McDowell, Citation2007). Similar observations were already made in several previous studies (Meybeck, Citation1989). Fertilizer input in the river water was again proved with the strong correlation results of K+ with Cl− and PO43-. Silica showed moderate significant correlation with Mg2+ and not with any other major cations. Since Ca2+, Mg2+, and SiO2 appear to be the rock components, they are removed most readily in solution by river water (Davis, Citation1969). The correlation analyses reveal that the chemical budget of ions in the surface water depends primarily on rock–water interactions and anthropogenic activities, and the concurrent increase/decrease in the composition of these ions in the waters is predominantly due to the result of dissolution/precipitation reaction and concentration effects.
Gibb’s diagram
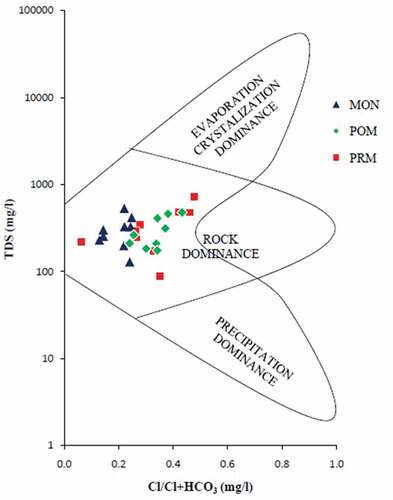
Gibb’s diagrams, representing the ratios of Na+/(Na++Ca2+) and Cl−/(Cl−+HCO3−) as a function of TDS are widely employed to assess the functional sources of dissolved chemical constituents (Gibbs, Citation1970). Gibbs proposed the diagram to understand the relationship of the chemical components of waters from their respective aquifer lithologies. The diagram has three distinct fields, namely precipitation dominance, evaporation dominance, and rock dominance. Naturally, surface water chemistry is largely controlled by processes like rock weathering, e.g. Ca2+/HCO3−, atmospheric precipitation, e.g. Na+/Cl−, and by evaporation/crystallization (Wu & Gibson, Citation1996). The Gibbs ratio for the ions Na+/(Na++Ca2+) and Cl−/(Cl−+HCO3−) of water samples was plotted separately against the respective values of TDS (). The Gibbs diagrams for the preset study show points falling chiefly in the rock dominance field, revealing rock–water interaction as the major mechanism controlling the surface water chemistry. A recent study in the Basin also supports this finding (Manjula & Unnikrishnan Warrier, Citation2019). But as the season changes from MON to PRM, evaporation/crystallization mechanism also begins to operate (). The results of Gibb’s diagram are also substantiated by the correlation studies, which in turn, gives an idea about the different sources of ions in the samples.
Figure 12. Gibbs diagram of Na+/ (Na++Ca2+) vs TDS.
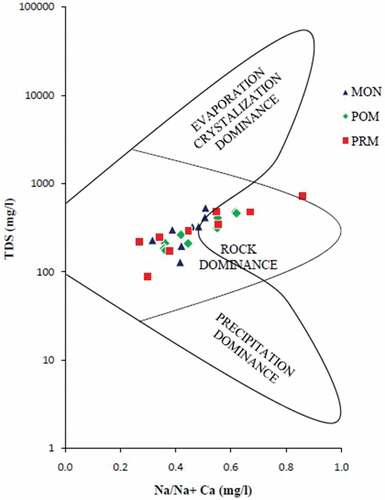
Figure 13. Gibbs diagram of Cl−/(Cl−+HCO3−) vs TDS.
Drinking water quality
Analytical results of physico-chemical parameters were compared with the standard guideline values recommended by WHO (WHO, Citation2008) and the Bureau of Indian Standards (BIS, Citation2012) for drinking purposes (). The majority of parameters showed values within the desirable limits. However, parameters such as TDS, TH, TA, Mg2+, and Cl− exceeded the limits at some locations in different seasons. Among these parameters, TA was found to be slightly higher in more number of samples. The presence of high levels of TDS may be objectionable to consumers, owing to excessive scaling in water pipes, heaters, boilers, and household appliances. Drinking water becomes significantly and increasingly unpalatable at TDS levels greater than about 1000 mg/liter (WHO, Citation2008). The TH and TA in higher concentrations cause scale deposition in the treatment works, distribution system, and tanks within buildings. TH also results in excessive soap consumption and subsequent “scum” formation (WHO, Citation2008). An increased amount of Mg also makes the water hard.
Table 5. Surface water samples of the study area exceeding the maximum desirable limits prescribed by WHO and Bureau of Indian Standards (BIS) for drinking purposes.
The sampling location KRR-1 showed exceeded values for all these parameters during MON and PRM. The content of Cl− was found beyond the limit only in PRM, and that too at KRR-1. Excessive Cl− concentration increases rates of corrosion of metals in the distribution system, depending on the alkalinity of water. This can lead to increased concentrations of metals in the supply. No health-based guideline value is proposed for chloride in drinking-water. However, chloride concentrations in excess of about 250 mg/liter can give rise to detectable taste in water (WHO, Citation2008). Moreover, four samples collected during PRM revealed the presence of pesticides Aldrin and Heptachlor crossing the WHO drinking water guidelines. Prolonged exposure to heptachlor has been associated with damage to the liver and central nervous system toxicity. Aldrin, under most environmental conditions, is rapidly converted into dieldrin, which is a highly persistent organochlorine compound that has low mobility in soil, can be lost to the atmosphere and bioaccumulate. Both aldrin and heptachlor were already banned in India (Kumar, Citation2004). The percentage of surface water samples showing good quality for all the studied parameters for MON, POM, and PRM are found to be 44%, 67%, and 33%, respectively.
Irrigation water quality
The suitability of surface water for irrigation is affected by the total content of soluble salts and the relative proportion of Na+ to Ca2+ and Mg2+. For the purpose of classifying irrigation water, Richards (Citation1954) recognized four groups of salinity zones based on EC. While a high salt content (high EC) in water leads to the formation of saline soil, high Na+ content leads to the development of alkaline soil. The Na+ or alkali hazard can be determined from the sodium adsorption ratio (SAR) proposed by Karanth (Citation1987). Eaton (Citation1950) proposed residual sodium carbonate (RSC) value for the quality rating of irrigation water. Another parameter called sodium percent (Na+ %) was introduced by Wilcox (Citation1955) for classifying irrigation water. All the above parameters except EC were determined using the ionic concentrations expressed in milliequivalents/liter. The calculated values are grouped into different classes of suitability for irrigation. The irrigation quality parameters and the hazards at different classes are given in . In the present investigation only one sample (KRR-1) falls in the high category of EC for all the seasons. All other samples maintain good quality for all these parameters throughout the study period.
Table 6. Irrigation water quality parameters and their hazard levels at different classes.
Conclusion
The physico-chemical analyses in the midland region of Bharathapuzha river (India) and its major tributaries showed distinct spatio-temporal variation with concentration, in general, increasing from MON to PRM seasons. The study indicates that variation in hydrochemistry and water quality is mainly due to anthropogenic and geological influences. For instance, sampling points at Korayar (KRR-1 & KRR-2) and Valayar (VLR) exhibited high contents of TDS, TH, TA, and Cl−, and very low DO, indicating anthropogenic activities. The major ion chemistry of water is mainly controlled by carbonate weathering, with Ca2+ and HCO3− ions dominating. Gibbs plots revealed rock–water interaction as the major mechanism controlling surface water chemistry. The relationships of (Na++K+) vs total cations, Na+ vs Cl−, and moderate correlation between SiO2 & Mg2+ show that silicate weathering is also partly contributing to the water chemistry. Fertilizer input in the river water was proved with strong correlation results of K+ with Cl− and PO43-. Organo-chlorine pesticides – aldrin and heptachlor – were detected with concentrations exceeding WHO guideline values in two samples during PRM. The quality assessment revealed that 44% samples in monsoon, 67% in post-monsoon, and 33% in pre-monsoon were good for drinking and domestic purposes after making proper chlorination methods for microbial contamination, and almost all the samples except one (KRR-1) were found to be good for irrigational purpose. Since the people in the study area rely chiefly on surface water for their day-to-day activities especially for agriculture, maintaining its quality is highly essential.
Disclosure statement
No potential conflict of interest was reported by the authors.
Additional information
Funding
References
- Adimalla, N. (2018). Groundwater quality for drinking and irrigation purposes and potential health risks assessment: A case study from semi-arid region of south India. Exposure and Health. doi:10.1007/s12403-018-0288-8
- Ahmad, A. R., Zulkefli, M., Ahmed, M., Aminuddin, B.Y., Sharma, M. L., & Zain, M. M. (1994). Environmental impact of agricultural inorganic pollution on groundwater resources of the Kelantan Plain, Malaysia. Agricultural impacts on groundwater quality, Kota Bharu, Malaysia, October 24-27, 1994. Aminuddin, B. Y., Sharma, M. L., Zain, M. M. (pp. 8–21). Canberra: ACT: Australian Centre for International Agricultural Research.
- Al-Mikhlafi, A. S., Das, B. K., Kaur, & Kaur, P. (2003). Water chemistry of Mansar Lake (India): An indication of source area weathering and seasonal variability. Environmental Geology, 44(6), 645–653. doi:10.1007/s00254-003-0798-x
- AOAC. (2000). Official methods of analysis of AOAC International (17th Edition (990.06). Gaithersburg, MD, USA: The Association of Official Analytical Chemists.
- APHA. (1995). Standard methods for the examination of water and wastewater (19th Edition ed.). New York: American Public Health Association Inc.
- Babiker, I. S., Mohamed, M. A. A., & Hiyama, T. (2007). Assessing groundwater quality using GIS. Water Resources Management, 21(4), 699–715. doi:10.1007/s11269-006-9059-6
- Babu, K. N., Padmalal, D., Maya, K., Sreeja, R., & Arun, P. R. (2007). Quality of surface and groundwater around tile and brick clay mines in the Chalakudy River Basin, Southwestern India. Journal of the Geological Society of India, 69, 279–284.
- Bajpayee, S. K., & Verma, A. (2001). Water quality of rivers of Kerala, South Western, India. In V. Subramanian & A. L. Ramanathan (Eds.), Proceedings of the International Workshop on Ecohydrology (pp. 307–308). New Delhi, India: Capital Publishing Company.
- Bhatt, M. P., & McDowell, W. H. (2007). Evolution of chemistry along the Bagmati drainage network in Kathmandu Valley. Water, Air, and Soil Pollution, 185(1–4), 165–176. doi:10.1007/s11270-007-9439-4
- BIS. (2012). Specifications for drinking water, IS: 10500:2012. New Delhi, India: Bureau of Indian Standards.
- Bricker, O. P., & Rice, K. C. (1989). Acid deposition to streams: A geology based method predicts their sensitivity. Environmental Science & Technology, 23(4), 379–485. doi:10.1021/es00181a001
- Burton, G. A., Jr., & Pitt, R. E. (2002). Storm effects handbook: A toolbox for watershed managers, scientists, and engineers. In Lewis Publishers. Boca Raton, FL.
- Celesceri, L., Greenberg, A. E., & Eaten, A. D. (1998). Standard and methods for the examination of water and wastewater. Washington D.C., USA: APHA.
- CGWB. (2005). District groundwater management studies of Palghat District. Kerala, India: Central Ground Water Board.
- Chapman, D., & Kimstach, V. (1992). Selection of water quality variables. In D. Chapman (Ed.), Water quality assessment (pp. 59–126). Cambridge, Great Britian: UNESCO, WHO, and UNEP.
- Chattopadhyay, S., Asa Rani, L., & Sangeetha, P. V. (2005). Water quality variations as linked to land use pattern: A case study in Chalakudy river basin, Kerala. Current Science, 89(12), 2167.
- Clark, F. W. (1924). The data of geochemistry. US Geol Survey Prof Paper 770.
- Davis, S. N. (1969). Silica in streams and groundwater of Hawaii. Project completion report of identification of irrigation return water in the subsurface. OWRR Project No. B-010-HI, Grant Agreement No. 14-01-001-1495.
- Eaton, F. M. (1950). Significance of carbonates in irrigation waters. Soil Science, 69(2), 123. doi:10.1097/00010694-195002000-00004
- Galloway, J. N., Aber, J. D., Erisman, A. J. W., Seitzinger, S. P., Howarth, R. W., Cowling, E. B., & Cosby, J. (2003). The nitrogen cascade. Bioscience, 53(4), 341–356. doi:10.1641/0006-3568(2003)053[0341:TNC]2.0.CO;2
- Gibbs, R. J. (1970). Mechanisms controlling world water chemistry. Science, 170(3962), 1088–1090. doi:10.1126/science.170.3962.1088
- Hem, J. D. (1985). Study and interpretation of the chemical characteristics of natural water. US Water-Supply Paper 2254.
- Hem, J. D. (1991). Study and interpretation of the chemical characteristics of natural water (Book 2254, 3rd Ed ed.). Jodhpur, India: Scientific Pub.
- Hounslow, A. W. (1995). Water quality data, analysis, and interpretation (pp. 397). Boca Raton, Florida, U.S.A.: Lewis Publisher.
- Jarvie, H. P., Whitton, B. A., & Neal, C. (1998). Nitrogen and phosphorus in east coast British rivers: Speciation, sources, and biological significance. Science of the Total Environment, 210-211(79–109), 31. doi:10.1016/S0048-9697(98)00109-0
- Kanagaraj, G., & Elango, L. (2016). Hydrogeochemical processes and impact of tanning industries on groundwater quality in Ambur, Vellore District, Tamil Nadu, India. Environmental Science and Pollution Research, [CrossRef] [PubMed] 23(23), 24364–24383. doi:10.1007/s11356-016-7639-4.
- Karanth, K. R. (1987). Groundwater assessment, development, and management. New Delhi, India: Tata McGraw-Hill.
- Kiely, G. (1998). Environmental engineering (pp. 217–431). London, United Kingdom: McGraw-Hill International Edition.
- Kosygin, L., Dhamendra, H., & Gyaneshwari, R. (2007). Pollution status and conservation strategies of Moirang river, Manipur with a note on its aquatic bio-resources. Journal of Environmental Biology, 28(3), 669–673.
- KSPCB. (2000). Kerala state pollution control board, zoning, and classification of major rivers of Kerala on the basis of designated best use (pp. 1–27). Thiruvananthapuram, Kerala, India: Government of Kerala.
- Kumar, A. (2004). Environmental contamination & bioreclamation (pp. 346–347). New Delhi, India: APH Publishing Corporation.
- Laegreid, M., Bockman, O. C., & Karlstad, O. (1999). Agriculture fertilizers and environment. England: CABI Publ., Wallingford and Norsk Hydro ASA.
- Manjula, P., & Unnikrishnan Warrier, C. (2019). Evaluation of water quality of Thuthapuzha Sub-basin of Bharathapuzha, Kerala, India. Applied Water Science, 9(4), 70. doi:10.1007/s13201-019-0937-5
- Mason, R. O., Lind, D. A., & Marchal, W. G. (1983). Statistics: An Introduction (pp. 368–383). New York, USA: Harcourt Brace Jovanovich, Inc.
- Mathess, G. (1982). The properties of groundwater. New York, USA: Wiley.
- Meybeck, M. (1989). The quality of rivers: From pristine stage to global pollution. Global Planetary Change, 1(4), 283–309. doi:10.1016/0921-8181(89)90007-6
- Mimikou, M. A., Baltas, E., Varanou, E., & Pantazis, K. (2000). Regional impacts of climate change on water resources quantity and quality indicators. Journal of Hydrology, 234(1–2), 95–109. doi:10.1016/S0022-1694(00)00244-4
- Mullick & Konar. (1999). Combined influence of heavy metals, petroleum product, and detergents, pesticides, and fertilizers on the worms (Branchura Sowerbyi). Environment and Ecology, 9, 1032–1037.
- Nouri, J., Khorasani, N., Lorestani, B., Karami, M., Hassani, A. H., & Yousefi, N. (2009). Accumulation of heavy metals in soil and uptake by plant species with phytoremediation potential. Environmental Earth Sciences, 59(2), 315–323 (9). doi:10.1007/s12665-009-0028-2
- Nouri, J., Lorestani, B., Yousefi, N., Khorasani, N., Hasani, A. H., Seif, S., & Cheraghi, M. (2011). Phytoremediation potential of native plants grown in the vicinity of Ahangaran lead–zinc mine (Hamedan, Iran). Environmental Earth Sciences, 62(3), 639–644 (7). doi:10.1007/s12665-010-0553-z
- Prakash Kengnal, M. N., Megeri, B. S., Giriyappanavar, & Patil, R. R. (2015). Multivariate analysis for the water quality assessment in rural and urban vicinity of Krishna River (India). Asian Journal of Water, Environment and Pollution, 12(2), 73–80.
- Rao, S. M., & Mamatha, P. (2004). Water quality in sustainable water management. Current Science, 87, 942–947.
- Richards, L. A. (1954). Diagnosis and improvement of saline and alkali soils. In Agricultural handbook 60 (pp. 160). Washington, DC, USA: USDA.
- Roy, S., Gaillardet, J., & Allegre, C. J. (1999). Geochemistry of dissolved and suspended loads of the Seine river, France: Anthropogenic impact, carbonate and silicate. Geochimica Et Cosmochimica Acta, 63(9), 1277–1292. doi:10.1016/S0016-7037(99)00099-X
- Sawyer, C. N., & McCarty, P. L. (1967). Chemistry for sanitary engineers (2nd Ed. ed., pp. 518). New York, USA: McGraw-Hill.
- Sharma, S., Bajracharya, R. M., Sitaula, B. K., & Merz, J. (2005). Water quality in the Central Himalaya. Current Science, 89(5), 774–786.
- Smith, V. H. (2003). Eutrophication of freshwater and coastal marine ecosystems: A global problem. Environmental Science and Pollution Research, 10(2), 126–139. doi:10.1065/espr2002.12.142
- Soman, K. (1977). Geology of Kerala (pp. 280). Bangalore, India-560019: published by Geological Society of India.
- SPSS. (1997). SPSS base statistics, version 13.0. Chicago, USA: Author.
- Srinivasamoorthy, K., Chidambaram, S., Prasanna, M. V., Vasanthavihar, M., Peter, J., & Anandhan, P. (2008). Identification of major sources controlling groundwater chemistry from a hard rock terrain – A case study from Mettur taluk, Salem district, Tamil Nadu, India. Journal of Earth System Science, 117(1), February 2008, 49–58. doi:10.1007/s12040-008-0012-3.
- Stallard, R. F., & Edmond, J. M. (1981). Geochemistry of the Amazon:1. Precipitation chemistry and the marine contribution to the dissolved load at the time of peak discharge. Journal of Geophysical Research, 86(C10), 9844–9858. doi:10.1029/JC086iC10p09844
- Stallard, R. F., & Edmond, J. M. (1983). Geochemistry of Amazon: 2. The influence of geology and weathering environment on the dissolved load. Journal of Geophysical Research: Oceans, 88(C14), 9671–9688. doi:10.1029/JC088iC14p09671
- Stimson, J., Frape, S., Drimmie, R., & Rudolph, D. (2001). Isotopic and geochemical evidence of regional-scale anisotropy and interconnectivity of an alluvial fan system, Cochabamba Valley, Bolivia. Applied Geochemistry, 16(9–10), 1097–1114. doi:10.1016/S0883-2927(01)00019-1
- Stumm, W., & Morgan, J. J. (1973). Aquatic chemistry. New York, USA: Wiley-Inter science.
- Taylor, A. W., Glotfelty, D. E., Glass, B. L., Freeman, H. P., & Edwards, W. M. (1976). Volatilization of dieldrin and heptachlor from a maize field. Journal of Agricultural and Food Chemistry, 24(3), 625–631. doi:10.1021/jf60205a030
- Timmons, M. B., Ebeling, J. M., Wheaton, F. W., Summerfelt, S. T., & Vinci, B. J. (2002). Recirculating aquaculture systems (2nd ed). Ithaca, N.Y: CAYUGA AQUA VENTURES.
- Todd, D. (1980). Groundwater hydrology (2nd edn, pp. 535). New York, USA: Wiley.
- USDHHS. (1993). Toxicological profile for Heptachlor/Heptachlor Epoxide. USA: Department of Health and Human Services, Public Health Service, Agency for Toxic Substances, and Disease Registry.
- Vasu, D., Singh, S. K., Tiwary, P., Sahu, N., Ray, S. K., Butte, P., & Duraisami, V. P. (2017). Influence of geochemical processes on hydrochemistry and irrigation suitability of groundwater in part of semi-arid Deccan Plateau, India. Applied Water Science, 7(7), 3803–3815. doi:10.1007/s13201-017-0528-2
- Water Atlas of Kerala. (1995). Ed., P. Basak. CWRDM: Kozhikode- 673 571, India. 82.
- Weber, J. C., & Lamb, D. R. (1970). Statistics and research in physical education (Vol. 222, pp. 59–64). London: St.Louis: C.V. Mosby Co.
- WHO. (2008). Guidelines for drinking water quality. In The third edition incorporating the first and second addenda Volume 1 recommendations, 515. Geneva, Switzerland: World Health Organization.
- Wilcox, L. V. (1955). Classification and use of Irrigation waters, U.S (pp. 969). Washington D.C., USA: Department of Agriculture.
- Wu, Y., & Gibson, C. E. (1996). Mechanical controlling the water chemistry of small lakes in Northern Ireland. Water Resource, 30(1), 178–182.
- Zhang, J., Huang, W. W., Letolle, R., & Jusserand, C. (1995). Major element chemistry of the Huanghe (Yellow River), China: Weathering processes and chemical fluxes. Journal of Hydrology, 168(1–4), 173–203. doi:10.1016/0022-1694(94)02635-O