
 ?Mathematical formulae have been encoded as MathML and are displayed in this HTML version using MathJax in order to improve their display. Uncheck the box to turn MathJax off. This feature requires Javascript. Click on a formula to zoom.
ABSTRACT
Water scarcity is a major feature in Egypt. However, events of heavy rain occur increasingly, leading to repetitive flash floods. Wadi Billi is a poorly gauged drainage basin in the Eastern Desert of Egypt and hosts El-Gouna town in the delta, which depends on the desalination of brackish groundwater as the main source of freshwater. On 9 March 2014, the wadi was exposed to a flash flood event that extended to the Red Sea causing damages to humans and infrastructure. In this paper, a system of infiltration trenches supported with a series of simple surface and subsurface dams has been designed to protect the downstream urban area and recharge the flooded water into shallow aquifers. The rainfall-runoff and sediment transport processes have been modeled using a 1D lumped hydrological model. The susceptible areas for groundwater recharge have been determined using geospatial analysis. The results show that the storm event produced 1,78 million m3 of flooded water carrying 5523 t of sediments. The streams and valleys that penetrate the downstream mountain formation have the highest potentiality for groundwater recharge. Four longitudinal infiltration trenches are needed with an average dimensions of 3,000 m × 25 m × 15 cm. In addition to 37 simple surface dams and 10 sub-surface dams with a total length of 2.7 km and 0.94 km, respectively. The spatial analysis showed almost 27.63 km is potentially suitable to extend the infiltration trenches with a width range of 25–250 m, which have a minimum capacity to recharge more than 4 million m3 for one event. By considering El-Gouna’s water demands, harvesting the flooded water for one flash flood event provides a new source of cheap and high-quality freshwater for 162–261 days. In addition to avoiding the potential damages for infrastructure and human lives.
Introduction
Flash floods within red sea drainage basins
Egypt is a vulnerable country to climate changes, which intensify and accelerate the hydrological cycle. Increasing the temperature by 2°C in coinciding with 20% of precipitation reduction, will reduce the Nile water flow by 88% (Elsaeed, Citation2011). Meanwhile, flash floods are more frequently produced and drain toward either the Red Sea or the Nile River through wadis. Unfortunately, most wadis are ungauged, and many urban settlements are located within their deltas without flood protection measures, which has led to catastrophic losses in the last decades, and . Abdel-Fattah, Kantoshu, and Sumi (Citation2015) estimated the damages’ cost for the period 1975–2014 by 1.2 billion USD/year.
Figure 1. Frequency of flash flood events in Egypt and the number of affected cities, modified after (Almasalmeh, Citation2019; Attia, Citation2017).
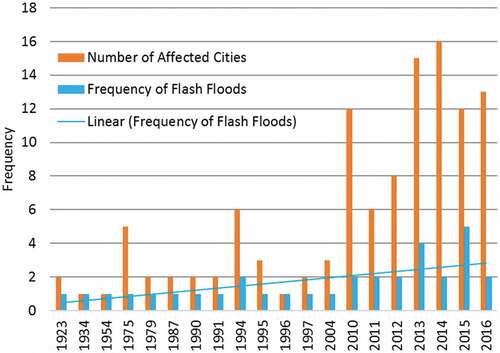
Table 1. Recently reported flash flood events along eastern desert of Egypt.
Wadi Billi
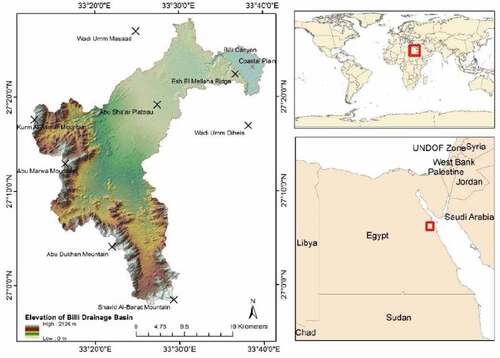
Wadi Billi is an arid drainage basin located in the Eastern Desert of Egypt, between the coordinates 33° 12’ 33” to 33° 40’ 18” E and 26° 57’ 56” to 27° 28’ 20” N, . The wadi has an elongated shape with an area of 878.7 km2, and a maximum elevation of 2,126 meters above sea level. The wadi consists of five typical morphometric features which are, from west to east: high elevated mountains, pediment plain, canyon, coastal mountains, and coastal plain.
Figure 2. Wadi Billi location.
Wadi Billi is undeveloped, except the delta, where El-Gouna town settled since the 1990s.
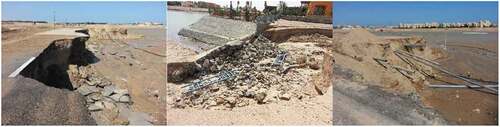
On 9 March 2014, Wadi Billi exposed to a storm event and the floodwater passed through the canyon toward the Red Sea causing damages to the infrastructure of El-Gouna town, . The runoff was partly measured in the field using a mobile electromagnetic flow rate measurement device by Hadidi (Citation2016). The recorded values are not very reliable as the number of the measurement is limited to 6 values of unequal time interval over 18 hr, and was done only in one point of shallow water due to the difficult accessibility. Thus, the resulted hydrograph cannot be used to calibrate the model results. However, it could be used as an indication for the hydrograph shape, minimum water volume and main inflection points.
Figure 3. Collapse of El-Gouna infrastructure caused by the flash flood in 2014: main road (left), bank protection (middle), and cutting lines of electricity, internet and phone (right) (Helal, Citation2014).
El-Gouna city
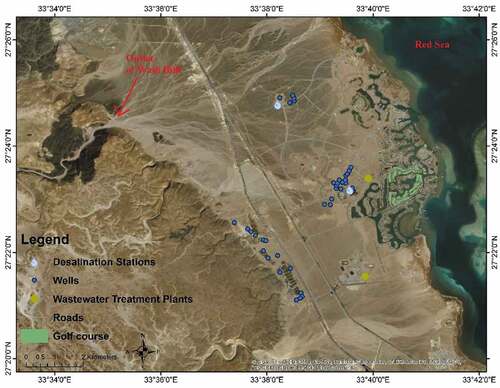
El-Gouna is a touristic urban area located in the wadi delta, about 20 km north of Hurghada. It is characterized by many lagoons () and had a built-up area of 7 km2 with a coastal length of 10 km (Marketing Office, Citation2018).
Figure 4. Satellite image of El-Gouna coastal plain showing the water infrastructure.
The available water resources of El-Gouna are limited and need to be desalinated, reused, or transferred through pipelines. The seasonal variation of visitors is maximizing the difficulty of managing the available water resources (Wellmann & Morosuk, Citation2016).
Desalinating brackish groundwater is the main source of potable water, with the capacity of 9,500 m3/d for drinking water and 1,500 m3/d for irrigation. Almost 36 of 70 wells are active, where 21 of them are saline with 52–60 mS/cm and distributed on the coastal plain with 18–30 m in depth, and 10 are brackish with 8–11 mS/cm and extend next to the ridge’s foots with depth of 68–107 m. In addition to 5 wells of brackish water used only for irrigation with depth 42–53 m. It is worth mentioning that other wells are not used due to low discharge or high salinity (Tzoupanos, Citation2015). According to Shafik (Citation2014), the existing groundwater originates mainly from 6000 years ago. Thus, the local aquifers are at the risk of depletion.
All the produced wastewater is treated and reused for irrigation purposes (Shafik, Citation2014). According to Tzoupanos (Citation2015), El-Gouna wastewater treatment plants produce a maximum of 4,750 m3/d of treated water. To cover the shortage in irrigation demands, Orascom Hotels Development imported wastewater from the Hurghada treatment plant, transport it through pipelines and reuse it (Shafik, Citation2014).
The domestic water demand highly fluctuates during the year due to the seasonal visitors, which could double the local population (Wellmann & Morosuk, Citation2016). Therefore, the average daily consumption range between 6,820 and 11,000 m3/d (Meier, Tutwiler, Dessouky, & Zayad, Citation2017).
The sustainable approach of El-Gouna is still evolving, and it is facing crucial problems in the transition period from growth and expansion to a sustainable steady-state situation (Meier et al., Citation2017). Harvesting floodwater and using it as a non-conventional source for freshwater is a reasonable solution to protect El-Gouna and meet its local demand. This will transform the significant potential risks into significant potential opportunities and contributes to the local sustainable development.
Previous studies
Multiple studies are taken place to design a suitable stormwater management system, . The feasibility of using retention basins for protection and harvesting floodwater is questionable; because of the high potential evapotranspiration loss (1636.42 mm/year), high infiltration losses, and the storage efficiency is highly reduced in case of sediments accumulation. In addition to the limited protection capability during the event of 45 mm, and almost no protection during the 90 mm event (Almasalmeh, Citation2020). Therefore, the required stormwater management system needs to face challenges and meet the local demands.
Table 2. Studies for mitigation and harvesting floodwater.
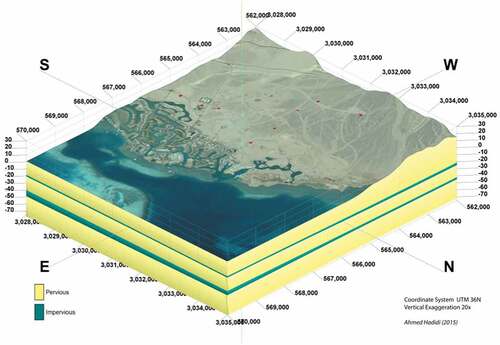
A 3D lithological model for the coastal plain has been developed to investigate the possibility of groundwater recharge, based on four boreholes and 15 liner samples. The results show two main mud horizons with wide lateral extension are suitable as aquitards to store the recharged water into two main shallow aquifers, . The drainable capacity is estimated as 100 million m3 for the first aquifer (up to the surface) and 30 million m3 for the second one (Hadidi, Citation2016).
Figure 5. 3D hydrostratigraphic model of the area. Red dots refer to the boreholes and liner samples (Hadidi, Citation2016).
Methodology
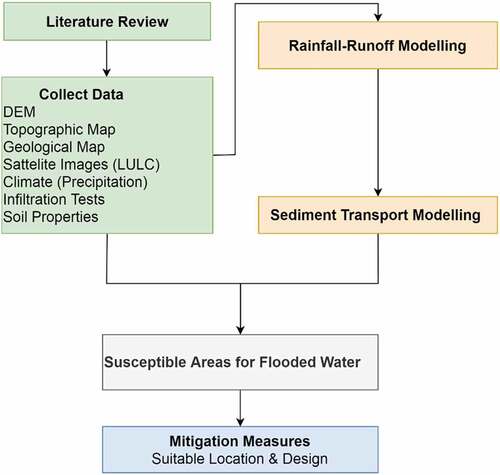
Achieving the research objectives required to carry out a literature study for the factors that control the hydrological response of Wadi Billi, and to collect the relevant data for the study area. The lumped-based hydrological model of HEC-HMS has been used to model the rainfall-runoff processes. Then, the resulting hydrograph has been used to predict the sediment yield. The susceptible areas for flooded water have been determined using geoprocessing techniques. Finally, the suitable dimensions have been designed. summarizes the steps of the general methodology followed in this research:
Figure 6. Flow chart of the general methodology.
Results and discussion
Rainfall-runoff modeling
The recorded average rainfall depth is 42.72 mm. The runoff hydrograph has been simulated till the measuring point at the wadi’s canyon using HEC-HMS. The Curve Number model has been used to calculate the losses () (Feldman, Citation2000):
Table 3. Parameters of SCS curve number model for Wadi Billi, after Mishra and Singh (Citation2003).
Where is the accumulated excess rainfall depth [mm], P is the total rainfall depth [mm],
is the initial abstraction (initial loss) [mm],
, S is the potential maximum retention (infiltration) [mm], CN is an empirical parameter and estimated from tables as a function of land use, soil type, and antecedent moisture condition.
The Kinematic Wave model has been used to simulate the overland flow (Feldman, Citation2000):
Where, is the discharge [m3/s],
horizontal distance along the flow path [m],
is the cross-sectional flow area [m2],
time [hr], q is the lateral inflow per unit length of channel [m3/s].
Where, is the friction slope or energy gradient [m/m],
is the bed slope [m/m].
The wadi has been represented by one plane of previous soil, overland flow length, average slope, and average overland roughness ().
Table 4. Input parameters of kinematic wave model for Wadi Billi.
The Muskingum-Cunge model has been used for channel routing (Feldman, Citation2000):
Where, is the vertical distance along the flow path [m].
Standard configuration has been followed to represent the channel cross-section along with channel length, average roughness and average slope ().
Table 5. Input parameters of muskingum-cunge model for Billi drainage network.
For poorly gauged arid wadis, most of the methods are expected to produce over- or underestimated results. Therefore, it is suggested to follow the approach of Kerby-Kirpich as it is based on limited input parameter that can be derived through geospatial analysis tools in ArcMap 10.5 ().
Table 6. Time concentration parameters for Wadi Billi.
Where, Tc is the required time for a raindrop at the furthest remote point to reach the wadi’s outlet [min], To is the concentration time for overland flow [min], Tch is the concentration time for longest watercourse [min].
Where, is overland roughness coefficient [m/s1/3],
is the length of overland flow [ft], So is the average dimensionless slope ratio of overland flow [ft/ft].
Where, Lch is the longest water flow path [ft], Sch is the average dimensionless slope ratio of longest water flow path [ft/ft].
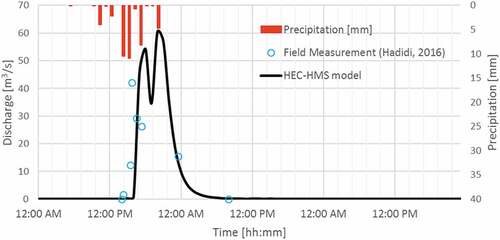
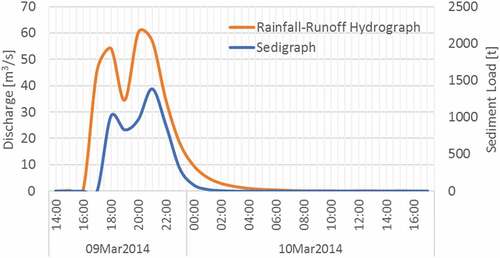
Only 2.19 mm of excess precipitation has been transferred to direct runoff. The flood hydrograph shows two peaks and meets the storm’s pattern. The maximum peak is 60.3 m3/s at 08:00 PM and is shifted by the travel time from the precipitation maximum depth, . The predicted flood volume is 1,78 million m3, which covers El-Gouna’s demands for 162–261 days.
Figure 7. Runoff hydrograph for the flood event of 9 March 2014.
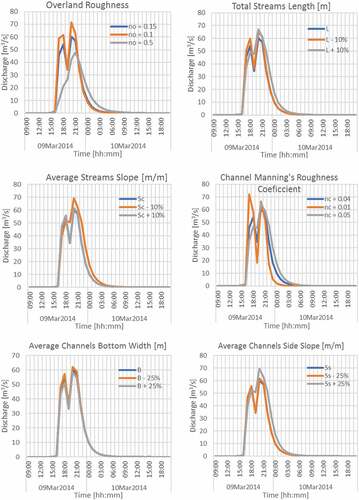
Due to the absence of reliable field measurements, calibrating the simulated hydrograph is not possible. Therefore, a sensitivity analysis has been applied to all input parameters in the models’ equations to determine its influence on the predicted hydrograph and to determine the main source of uncertainty.
The applied range of values for each parameter is estimated according to the possible range of mistakes. For the parameters derived using geoprocessing techniques, the applied range is the actual measurement ± 10%, because of the measurement accuracy. While for the parameters based on field measurements, the used range is the actual measurement ± 25%.
Generally, high sensitivity has been noticed for parameters that influence water volume (total rainfall depth, Curve Number, impervious area, and wadi area) and bottom friction (overland and channel roughness), . The peak value, runoff volume, and even the shape of the hydrograph are significantly changed with direct relation for water volume parameters and with an inverse relation for bottom friction parameters. The time to peak is almost the same, and the morphometric parameters showed an insignificant effect.
Figure 8. Sensitivity analysis for rainfall-runoff modeling parameters.
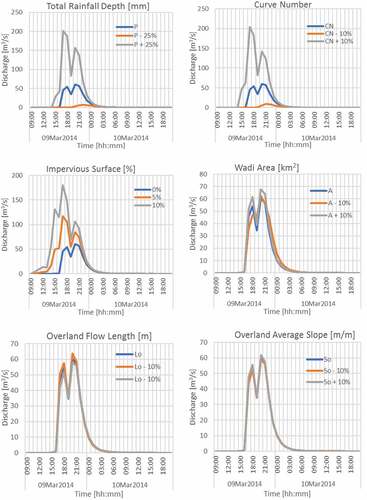
Figure 8. (Continued).
Sediment transport modeling
The soil erosion and sediment yield that accompany the flood event have been simulated. The Modified USLE method has been used to calculate the upland erosion () after Williams (Citation1995) as cited by (Almasalmeh, Saleh & Mourad, Citation2022):
Table 7. Input parameters for modified USLE.
Where S is the sediment yield [t], Q is the runoff volume [m3], is the threshold peak flow rate [m3/s], K is the soil erodibility factor [-], LS is the topographic factor [-], C is the cover and management factor [-], and P is the support practice factor [-].
The Laursen-Copeland model is used to simulate the total load transported toward the wadi’s outlet due to its suitability for wide range of grain size 0.011–29 mm (Brunner, Citation2010):
Where is the sediment discharge concentration [Ib.ft−3],
is the specific weight of water [Ib.ft−3],
is the mean particle diameter [ft], D is the effective depth of the flow [ft],
is the bed shear stress due to grain resistance [Ib.ft−2],
is the critical bed shear stress [Ib.ft−2], f is the function of the ratio of the latter two variables as defined by a figure in Laursen (1958),
is the shear velocity [Ib.s−1],
is the particle fall velocity [Ib.s−1].
The resulted sedigraph () coincides with the runoff hydrograph in terms of shape and time to peaks. Two peaks have been predicted at the wadi outlet. The first one attains 1015 t at 06:00 PM and the second one is 1386 t at 09:00 PM. The total transported sediment load is 5,523.1 t for the whole event.
Figure 9. Sedigraph of Wadi Billi for the flood event of 9 March 2014.
Due to the absence of field records, model calibration is not possible. Also, there are no published studies considering the transported sediments by flash flood events within similar wadis in the neighborhood. Therefore, a sensitivity analysis has been applied to determine the range and the main source of uncertainty.
All factors of the Modified USLE model have been considered, as well as the threshold of soil erosion and the exponent. The range of used values is matching with the possible range of mistakes. For the factors derived using remote sensing and geoprocessing techniques, the applied range is the actual measurement ± 10%, because of the measurement accuracy. While for the factors that require field measurements, the used range is the actual measurement ± 25%.
The results () show that all factors are equally sensitive and significantly influence the predicted sedigraph in terms of the sediment load and peak values. No changes have been noticed in terms of time to peak or sedigraph shape. The threshold of soil erosion almost did not influence the resulting sedigraph. This can be attributed to the nature of flash flood runoff, where the runoff hydrograph is characterized by a rapid rise and fall limbs. Therefore, the difference of discharge between each two subsequent simulation steps is larger than the applied range of threshold values. The exponent controls the distribution of the same sediment load over the time series. Thus, it significantly influences the peak values and the sedigraph shape.
Figure 10. Sensitivity analysis for sediment transport modeling factors.
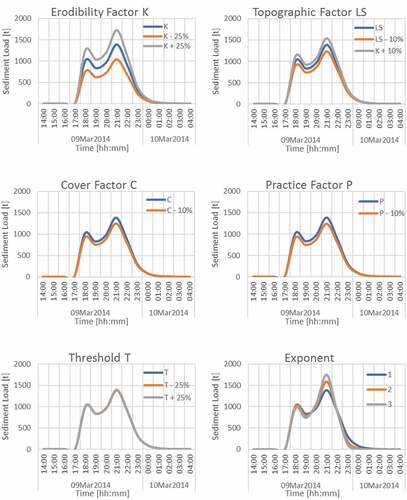
Due to the accuracy of remote sensing and GIS techniques, the topographic, cover, and practice management factors are realistic to a large extend. While, special consideration is required for the erodibility factor, as it is derived based on limited soil tests.
Areas Of groundwater recharge
The potential areas for groundwater recharge are distributed where flood inundation exists. Therefore, the flood inundation map was drawn based on causal parameters, which influence the initial favorable conditions for the occurrence of flood events. The applied approach is modified a little bit from the suggested one by Theilen-Willige (Citation2019), where the effect of land elevation has been excluded to consider wadi’s mid and upstream.
The hydrogeological and morphometric parameters for Wadi Billi have been analyzed and combined using the weighting overlay technique through ArcMap 10.5. The weights and rating values that determine the relative importance and influence amount of each parameter ( and ) are determined based on literature consulting and expert knowledge. The aim is to determine the flattest areas susceptible to flood and to high surface water input. The selected hazard scale has been subdivided into 3 classes.
Figure 11. A) Flood susceptibility over landsat 8 image for Wadi Billi, b) DEM (ASTER, Citation2011), and causality parameters: c) flow accumulation > 5,000 d) drop raster < 100,000 e) slope map f) curvature map g) aspect map.
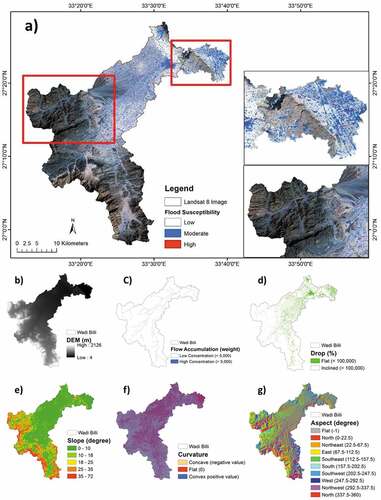
Table 8. Causal parameters that influencing the initial favorable conditions for the occurrence of flood events, after Theilen-Willige (Citation2019).
The resulting map ( a) shows the spatial distribution of susceptible areas that will be flooded by excess water with a resolution of 30 × 30 m. It shows mainly a moderate risk degree distributed over the pediment and coastal plains. A higher risk degree exists within streams in the valleys that penetrate the coastal mountain formation or extends within pediment plain until the wadi’s delta. Therefore, it is likely to have local groundwater aquifers within the determined areas, and they are potentially valid to construct measures for artificial recharge.
Infiltration trenches
Many techniques have been discussed in the literature to harvest and manage stormwater within a regional undeveloped watershed. However, Wadi Billi has its unique specifications in terms of high annual potential losses by evapotranspiration and infiltration, the flood events’ interval of a couple of years, and the vulnerable water management system of El-Gouna.
A solution with high potentiality has been discussed in the frame of the Applied Hydrogeology module (Tröger & Wannous, Citation2018). The aim is to protect El-Gouna against flood risks and to recharge the flooded water into a series of shallow coastal aquifers. This would optimize the quality of local groundwater, minimize the desalination’s costs and balance the seawater intrusion. The idea is to construct infiltration trenches supported by a series of simple surface and subsurface dams. The infiltration trenches are used to facilitate shallow groundwater recharge. The surface dams are made of gabions from the local environment and are used to slow down the water velocity and precipitate the sediments. This will prevent clogging and ensure high operating efficiency. While the subsurface dams would be made of sheet piles to control the groundwater flow between the managed shallow aquifers.
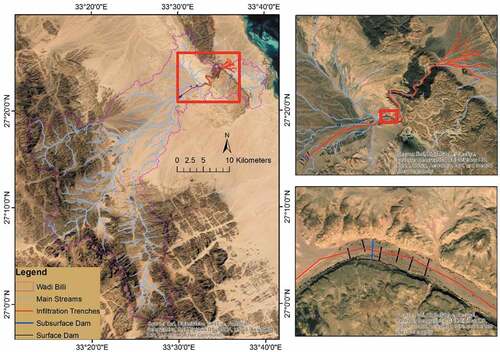
The surface dams have to be constructed upstream and within the Billi canyon, while the subsurface dams have to be at the borders of the managed aquifers. The infiltration trenches should extend parallel to the main streams through the Billi canyon and delta, where the flood susceptibility is the highest, .
Figure 12. Suggested stormwater management system.
The suitable dimensions have been designed based on the Connecticut Department of Environmental Protection (Citation2004). The approach considers only the infiltration that takes place throughout the trench bottom () and ignores the trench sides:
Figure 13. Side view of infiltration trench (Connecticut department of environmental protection, Citation2004).
where A is the bottom area of trench m2, V is the runoff volume m3, Kf is the infiltration rate of surrounding native soil mm/hr, n is the void space fraction in the storage media, and T is the retention time hr.
The trench depth D [m] can be calculated as follows:
The infiltration rate has been estimated as an average value from the field tests done by TU Berlin students within the main valley (Elsisi, George, & Hubeishi, Citation2018). While the average porosity is measured in the laboratory by Hadidi (Citation2016) using 23 samples. The floods interval is a couple of years. Therefore, there are no limitations for the retention time, except to avoid soil losses due to high potential evaporation. shows the required dimensions for the flood event of 9 March 2014.
Table 9. Infiltration trench dimensions.
Due to the valley nature in terms of width variability and meander streams, four longitudinal trenches could be used with an average dimension of 3,000 × 25 × 6 m. The spatial analysis shows that the total length for the required 37 surface dams is 2.7 km, while it is 0.94 km for the required 10 sub-surface dams, distributed over five potential locations.
It is worth mentioning the average porosity of soil is high and close to the standard void space value (n = 0.4). Therefore, it is required only to scrap the surface clay layer (crust layer) in the depth of centimeters, and there is no need to excavate 6 m in depth and re-fill them with standard soil. This will significantly minimize the construction costs.
The spatial analysis showed almost 27.63 km is potentially suitable to extend infiltration trenches with a minimum width of 25 m (and may expand to 250 m in some places), which have a minimum capacity to recharge more than 4 million m3 in one event.
The expected limitations are related to the required regular maintenance after each flood event, where scaping the newly formed clay layer is necessary to keep the high-performance efficiency.
Conclusions
Storm water management systems are needed in areas that exposed to flash floods. They are considered as a good solution to reduce flood risks and water scarcity in arid and semiarid areas. This paper attempts to harvest the floodwater of the flash flood event of 9 March 2014 within Wadi Billi, Egypt. The suggested stormwater management system that consists of infiltration trenches and a series of simple surface and subsurface dams has been designed. The flood hydrograph and the transported sediments have been predicted using HEC-HMS hydrological model. The infiltration rate has been estimated as an average value from field tests, while the average porosity is measured in the laboratory using 23 samples. The susceptible areas for groundwater recharge have been defined using geospatial analysis using ArcMap. Due to the high average porosity of the soil, scraping only the surface clay layer (crust layer) in the depth of centimeters is required. Therefore, the designed system may consist of four longitudinal trenches with average dimensions of 3,000 m × 25 m × 15 cm; 37 surface dams with a total length of 2.7 km; and 10 sub-surface dams with a total length of 0.94 km. The calculations showed that the designed system has the capacity to recharge more than 4 million m3 in one event, and harvesting the floodwater of 9 March 2014 could cover the local demands of El-Gouna city for 162–261 days.
6. Acknowledgements
The first author acknowledges Prof. Reinhard Hinkelmann and Mrs. Franziska Tügel from Chair of Water Resources Management and Modeling of Hydrosystems, Technische Universität Berlin, for the fruitful discussions and comments.
Disclosure statement
No potential conflict of interest was reported by the author(s).
References
- Abdel-Fattah, M., Kantoshu, S., & Sumi, T. (2015). Integrated management of flash flood in wadi system of Egypt: Disaster prevention and water harvesting. Disaster Prevention Research Institute Annuals, 58(B), 485–496.
- Almasalmeh, O. (2019). Master dissertation: Storm flow generation in ungauged watersheds based on geomorphological characteristics: Case study of Billi drainage basin, Egypt. Cairo: British University in Egypt.
- Almasalmeh, O., 2020. Master dissertation: Rainfall-runoff and sediment transport modelling of Wadi Billi, Egypt, El-Gouna: Water Engineering, Technische Universitat Berlin Campus El-Gouna.
- Almasalmeh, O., Saleh, A., & Mourad, K. (2022). Soil erosion and sediment transport modelling using hydrological models and remote sensing techniques in Wadi Billi, Egypt. Modeling Earth Systems and Environment, 8, 1215–1226. doi:10.1007/s40808-021-01144-1.
- ASTER, A. S. T., & R. R. P, E. A., 2011. Digital elevation model, s.l.: METI & NASA.
- Attia, K., 2017. Presentation: vulnerability to extreme events due to climate change in Egypt, Beirut: High Level Conference on Climate Change Assessment and Adaptation in the Arab Region.
- Brunner, G. W. (2010). HEC-RAS, river analysis system hydraulic reference manual. US Aemy Corps of Engineers, Hydrologic Engineering Center: Davis.
- Connecticut Department of Environmental Protection. 2004. Chapter 11: Design Guidance: Infiltration Practices. In Connecticut Stormwater Quality Manual 1–12.DEP Bureau of Water Management: Inland Water Resources Division
- DREF, 2010. Egypt: Flash floods, s.l: International federation of of red cross and red crescent socities
- Elnazer, A. A., Salman, S. A., & Asmoay, A. S. (2017). Flash Flood hazard affected ras gharib city, red sea, Egypt: A proposed fash flood channel. Natural Hazards, 89(6), 1389–1400. doi:10.1007/s11069-017-3030-0
- Elsaeed, Gamal. (2011). Chapter: Effects of climate change on Egypt’s water supply. Dubrovnik, Croatia: The NATO Advanced Research Workshop on climate Change, Human Health and National Security.
- Elsisi, M., George, M., & Hubeishi, Y. (2018). Flash flood management of Wadi Bili. El-Gouna, Egypt: Water Engineering Department, Technischen Universität Berlin.
- Feldman, A. D. (2000). Hydrologic modeling system HEC-HMS: Technical reference manual. Davis, USA: Hydrologic Engineering Center, U.S. Army Corps of Engineers.
- Hadidi, A. (2016). Ph.D dissertation: Wadi Bili catchment in the eastern desert: Flash floods, geological model and hydrogeology. Berlin, Germany: Technischen Universität Berlin.
- Helal, A. (2014). Photos of flash flood event of 9th march 2014. Ashraf Helal, Director of El-Gouna Desalination Station Plant: El-Gouna.
- Marafini, Ester, Tügel, Franziska, Özgen, Ilhan, Hinkelmann, Reinhard, Rocca, Michele La, et al., 2018. Flash flood simulations based on shallow water equations to investigate protection measures for El Gouna, Egypt. Palermo, 13th International Conference on Hydroinformatics (HIC), pp. 1298–1305.
- Marketing Office, E. G., 2018. El-Gouna. Available at: https://elgouna.com/ [Accessed 22 June 2018].
- Meier, A., Tutwiler, R., Dessouky, N., & Zayad, H. (2017). Planned communities with a sustainability focus: Egyptian case studies, SRTP-2017-2.2. Davis: Sustainability Research and Training Program, University of California.
- Mishra, S. K., & Singh, V. P., 2003. Soil conservation service curve number (SCS-CN) methodology. 1st edition ed. s.l.: SPRINGER-SCIENCE+BUSINESSMEDIA, B. V.
- Moawad, M. B., Aziz, A. O. A., & Mamtimin, B. (2016). Flash floods in the Sahara: A case study for the 28 january 2013 flood in Qena, Egypt. Geomatics, Natural Hazards and Risk, 7(1), 215–236. doi:10.1080/19475705.2014.885467
- Saber, M., Abdrabo, K. I., Habiba, O. M., Kantosh, S. A., & Sumi, T. (2020). Impacts of triple factors on flash flood vulnerability in Egypt: Urban growth, extreme climate, and mismanagement. Geosciences, 10(24), 1–22. doi:10.3390/geosciences10010024
- Shafik, E., 2014. Master thesis: Wastewater Treatment Plant (WWTP) of El Gouna: Performance Monitoring and Improvement of Treatment Efficiency, El Gouna: Technische Universität Berlin Campus El Gouna.
- Theilen-Willige, B. (2019). Weighted overrlay approach for the detection of areas susceptible to flashfloods. Technische Universität Berlin: s.l.: Institute of Applied Geosciences.
- Tröger, U., & Wannous, M. (2018). Lecture: Artificial recharge – possibilities and obstacles., Technical University of Berlin: s.l.: Water Engineering Department.
- Tügel, F., Abdelrahman, A.A.A., Özgen-Xian, I., Hadidi, A., Hinkelmann, R., et al. (2020). Rainfall-runoff modeling to investigate flash floods and mitigation measures in the Wadi Bili catchment, Egypt Gourbesville, P., Caignaert, G. Advances in Hydroinformatics. Springer, Singapore: Springer Water. doi:10.1007/978-981-15-5436-0_44.
- Tügel, F., Özgen-Xian, I., Marafini, E., Hadidi, A., & Hinkelmann, R. (2020). Flash flood simulations for an Egyptian city - mitigation measures and impact of infiltration. Urban Water Journal, 17(5), 396–406. doi:10.1080/1573062X.2020.1713171
- Tzoupanos, N. (2015). Water and wastewater management in El Gouna, Red sea, Egypt. El Gouna: IWaTec winter schoolSustainable Use of Resources: Water and Energy for Egypt.
- Wellmann, J., & Morosuk, T. (2016). Renewable energy supply and demand for the city of El Gouna, Egypt. Sustainability, 8(314), 1–27. doi:10.3390/su8040314
- Williams, J. R. (1995). Chapter 25: the EPIC model. In: Singh VP (ed) Computer models of watershed hydrology (909-1000). Water Resources Publications.