
 ?Mathematical formulae have been encoded as MathML and are displayed in this HTML version using MathJax in order to improve their display. Uncheck the box to turn MathJax off. This feature requires Javascript. Click on a formula to zoom.
ABSTRACT
Old masonry structures have a very special nature that require periodical inspection and evaluation programs. The problem becomes more sophisticated when dealing with vital buried hydraulic structures under continuous functional operation while bearing additional loads from running public services such as railways. This could add extra challenges for determining their structural performance and engineering characteristics if conventional methods are used. Moreover, traditional methods are sometimes costly, time consuming, and can lead to some damage to the structure. The importance of the current research is therefore providing a rapid methodology for evaluating these structures to confirm their current ability to resist operating loads safely, especially when subjected to aging. In this study, the evaluation depends mainly on analyzing the vibration acceleration response of a structure under dynamic loads. Insight into system identification using formal modal analysis was also conducted. Simultaneously, calibrated numerical model was then adopted to predict the expected level of internal stresses. An old masonry irrigation intake buried culvert underneath the main railway lines was selected for examination. The structure was firstly plugged from both sides and emptied, site inspection as well as core sampling of construction materials were conducted. Vibration time history was recorded due to train passage with different speeds. The filed measurements along with mathematical model were used to estimate the level of stresses among the structure. The results showed the ability of the proposed method to evaluate structures in an easy and rapid fashion compared to traditional methods without stopping serviceability of the structure.
Introduction
Egypt has many old irrigation masonry structures crossing under the railway lines. The underlaid buried masonry arched structures are facing deterioration and aging problems. Continuous health monitoring and evaluation programs are often required to prevent catastrophic railway accidents. Recently, Egypt government started modernization of its railway transportation system by using modern and faster locomotives, which make it a mandatory to examine initially and periodically the effect of these types of trains on the structural performance of underneath masonry culverts. Vulnerability assessment of these structures – with their complex nature – is mandatory to identify their structural integrity (A. Anwar & Abd Elwaly, Citation2023; Anwar, Elattar, & Abd-Elwaly, Citation2022; Hadzima-Nyarko, Mišetić, & Morić, Citation2017; Orlando, Becattini, & Betti, Citation2023). (Verstrynge, Lacidogna, Accornero, & Tomor, Citation2021) explored problems in masonry arch bridges that represent around 40% of the European bridges with almost 100 years of age as well as ways to identify damages in these structures. Assessment of masonry structures with the aid of dynamic measurements was found crucial by many researchers (Hadzima-Nyarko, Mišetić, & Morić, Citation2017; Hu & Bian, Citation2022; Silva, Costa, & Arêde, Citation2022). Dynamic forces caused by trains are considered one of the main factors that affect the structure integrity of these structures. Train forces can be a source of crack generation and deterioration of masonry structures. Simplified simulation of train moving load on stone arched bridge containing cracks was given by Silva et al (Silva, Costa, & Arêde, Citation2022). Assessment for train running safety was explicitly shown in (Montenegro et al., Citation2021). (Zhang, Zhang, & Zhou, Citation2023) studied the effect of increasing the train speed on the differential settlement of subgrade. Some codes (BS EN 1991–2,Citation2003. Eurocode 1: Actions on Structures – Part 2: Traffic Loads on Bridges; Hwang & Nowak, Citation1991) set design limits for deflections, and vertical alignment irregularities with respect to train speed. Train modeling was also expressed by means of a system of point masses and group of dampers and springs (Wang, Wang, Wei, Dollevoet, & Li, Citation2022).
Mutke (Citation2016) studied the relationship between the level of stresses, degree of damage and the vibrations velocity for mining structures. The study confirmed that damage occurred at values of vibrational velocities in the range of 0.05 and 1.00 m/s, while they occurred in areas of concentrated stress at lower values that were in the range of 0.05 and 0.2 m/s. The rock mass vibrations directly affect the roof support and the vertical load under the arch support. The result of the study shows that even relatively low values of Peak Particle Velocity (PPV) of 0.11 m/s may lead to an additional increase in the vertical load under the arch support. Also, the study indicated that the dynamic forces with lower frequencies have a much higher effect than the dynamic forces with higher frequencies. The vibrations caused a specific increase in stresses – at PPV = 1.0 m/s – by approximately 25% compared to the static phase.
Marföldi, Ballinas-González, Venglár, Sokol, and Rodríguez-Paz (Citation2018) in this research deals with the use of dynamic tests and structural analysis of FEM to determine the cause of cracks in the walls of a building. The research determined the cause and suggested treatment methods (Piyush, Devang, & Mehul, Citation2015). This study was carried out on several historical buildings to study the impact of vibrations resulting from traffic loads on those facilities. Vibration limit as a maximum value of PPV with 3 mm/sec was set and tested as a safe limit for historical and fragile buildings for continuous vibration of traffic. The results showed that the historical structures in which the test was conducted are safe from structural and architectural damages due to traffic vibrations.
In this research, the proposed method was tested by conducting a complete study on single vent old hydraulic masonry culvert that passes under the railway lines. With the aim of measuring its validity in estimating the level of internal stresses using simple, easy, and cheap method relying on measuring the acceleration response at a certain point fixed on structure main element. By using the structure dynamic analysis, a relationship between the level of stresses at a specific point, and its level of the vibrational acceleration response is correlated.
In the coming sections, all the studies and tests that have been carried out will be reviewed to clarify the general framework of the proposed method and its capabilities.
Proposed method concept
The mathematical model of a structure under the influence of dynamic forces can be expressed in the well-known form. Through the following equation, the state of equilibrium of the forces affecting that structure can be expressed.
Where,
u is the displacement with reference to equilibrium position, while u' and u'' are its first- and second-time derivatives (velocity and acceleration), respectively.
m is the total structure mass
k is the total structure stiffness
c is the total structure damping
F(t) is the external applied dynamic force
The above equation can be written as
Finertia = mu'' Consider the internal force part that use inertia force to dissipate the external force
Fdamping = cu' Consider the internal force part that use damping force to dissipate the external force.
Fstiffness = ku Consider the internal force part that use stiffness force to dissipate the external force.
It is worth noting that the value of mass and stiffness is much higher than the value of damping Also, the value of the acceleration or velocity is much higher than the value of the relative displacement likely to occur under the influence of the applied dynamic load. Hence, it can be concluded that the force that is effectively responsible for resisting the external load is the inertia force, especially in cases where the building is massive.
It is known that the vibrational acceleration is one of the quantities that can be easily measured with a high degree of accuracy, other than velocity and displacement. This explains the reason for choosing the proposed method for estimating the internal stresses, as depending on the measurement of the vibrational acceleration. This is because it expresses one of the main internal forces to resist external loads and, accordingly, is proportional to the generated internal stresses.
Case study
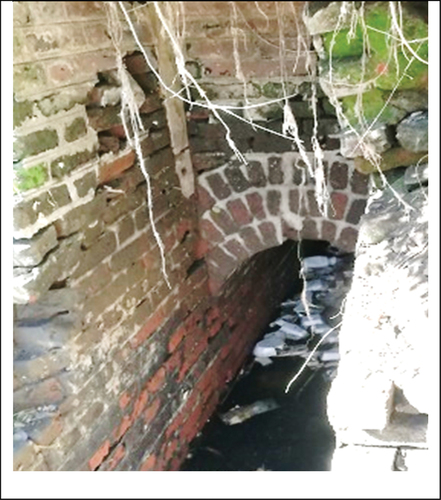
To verify the proposed method, representative buried hydraulic culvert was chosen as representative of many similar structures that are subjected to the same operating conditions. These structures would be qualified to follow the proposed technique for the sake of fast and promising evaluation process. The selected structure was masonry culvert located at El-minia – Egypt. It was built more than 75 years ago. The culvert is buried and passing under the main Upper Egypt railway lines. The culvert is composed of only single vent with circular shaped masonry arch rested on two masonry abutments. Red clayey bricks have been used for construction - . The initial visual inspection showed the presence of few material deteriorations in some portions with signs of some cracks, but in general, the structure is still performing its function. It can keep its operational continuity with appropriate efficiency after carrying out some strengthening works.
Figure 1. General culvert condition – inlet side.
Culvert geometry
The culvert has the following dimensions: total length 12.00 m and 0.80 m clear opening width. The arched roof type is semi-circular shape with radius 0.40 m. The thickness of the arch ring was 0.40 m. The walls were of variable thickness from 1.08 m at base till 0.55 m at the top of the walls. Longitudinal section along with culvert cross-section are shown in . The culvert was subjected to railway loads with two lanes. Standard gauge length of 1.435 m was found. Typical spacings and dimensions of the railway system are shown .
Figure 2. Culvert structural system general layout.
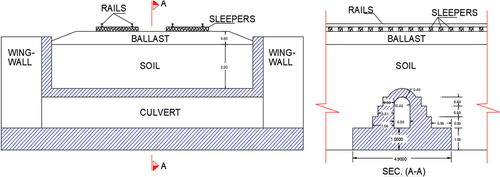
Figure 3. Typical spacing for the railway system.
Material condition
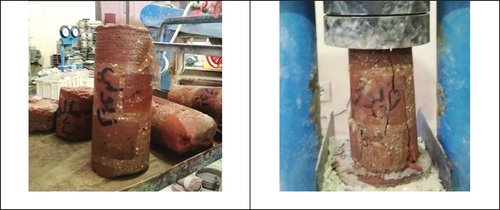
Four core samples were taken from the walls of the culvert. The current mechanical characteristics can then be noted. The cores were of 300–550 mm length with an average diameter of 96 mm. The cores were clearly inspected before destructive testing so that any existing cracks or debonding between mortar and brick units can be detected. The crack pattern was then checked after the test. It was observed that all cracks were in the form of splitting cracks through bricks and binding mortar with crushing of the composite material at the base. The compressive strength for all samples were so close regardless to their location. The average compressive strength was found 5.48 N/mm2, whereas the average unit weight for all cores was of an average value of 1.7 t/m3. shows the core samples before and after testing.
Figure 4. Examined cores before and after testing.
Dynamic loads measurements
The dynamic force affecting the structure under study was monitored using eight uni-axial accelerometers distributed in several places among the structure. shows the distribution of the sensors on sleepers, ground, and culvert body. The accelerometers were arranged to assess three directional movements. Sensor (1) was placed vertically just on one sleeper over culvert axis. This could allow estimating the actual affecting train dynamic loads. Different records for trains with different speeds and number of passenger cars were monitored. In this research, the monitored dynamic effects of the locomotives were mainly considered. Two similar locomotives with speeds, 16 Km/hr and 31 Km/hr, with total number of 11 and 12 trailers, respectively, were investigated. Velocity functions was obtained by direct integration of acceleration records. shows sample of the dynamic characteristics of the monitored vibrations as a result of the considered train’s movement.
Figure 5. Accelerometers distribution among railway and the culvert.
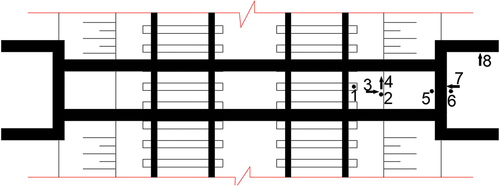
Figure 6. Samples for a) whole acceleration history, b) FFT, c) FRF, d) processed velocity response, and e) locomotives acceleration time histories, for trains of speed 16 and 31 Km/hr, respectively.
Structural modeling
Composite materials like the case of masonry structures are commonly simulated as orthotropic material that are mainly composed of heterogeneous materials, bricks, and mortar. In fact, simulation of thin walls with expected in-plane and out of plane deformation might be completely different than dealing with massive thick walls. Therefore, intensive analysis should be performed in micro-modeling scale to represent blocks, mortar, and block/mortar interface, nevertheless the expected crack propagation (Brando, Rapone, Spacone, & Giovanna Masciotta, Citation2022; Pietruszczak & Niu, Citation1992). Moreover, complicated models are required when dealing with large deformation problems or studying mechanical behavior of masonry till failure (Rafiee & Vinches, Citation2013). This can be helpful for small structural elements with particular interest in the heterogeneous states of stress and strain among their constituents and the interface. On the other hand, Lourance (Lourenco, Citation1996) stated that macro-scale models can be good representative for simulating large scale systems where knowledge about interaction between units and mortar can be negligible for the sake of global structural behavior. He also added that in simplified modeling, brick and mortar were modeled as a single smeared material, and the mortar joints were modeled as zero-thickness interfaces. Alternatively, composite behavior in terms of macro or average stresses and strains can be used to model masonry as a homogeneous material.
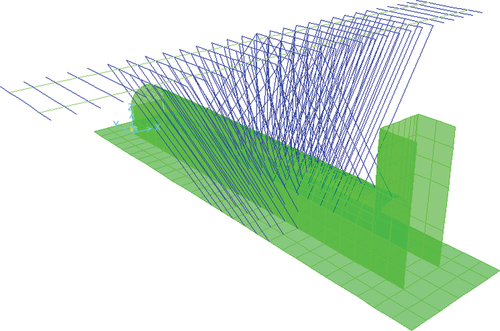
In this study, cost effective Finite Element (F.E.) modeling was utilized to represent all culvert components. The model was created using SAP2000 (SAP2000, CSI: Computers and Structures Inc, Version 14.1.0. Computer Software, Citation2009.). Constitutive linear modeling was used to represent the structure. Homogeneous isotropic behavior of masonry was simulated using shell elements. This can be a good assumption only for the case of small deformations with relatively small levels of stress. It was thought that this kind of numerical modeling can be suitable for elements of thick sections where multi-wythe were used to form the final element thickness where low level of stresses is expected. Additionally, the site observation showed the absence of extended cracks inside the culvert. Single direction railway along with the underneath sleepers were represented in the study using frame elements. The sleepers were rested on springs. The spring stiffness was chosen by the aid of the approximate values stated by (Bowles, Citation1997) and as per the carried soil investigations (CRI, Citation2011). The spring value (Ks = 4000t/m2/m’) was found appropriate. Generally, it is very necessary to consider the interrelation of rail-soil-structure interaction. Although there are theoretical treatments of this subject, they are difficult to apply to many practical problems, and experience and judgment form the best guide at present (BS 8004, Citation1986). The locomotive dynamic loads were directly transferred to the culvert through connecting links. In fact, several trials were done to adjust the characteristics of these links. The characteristics of the links were finally chosen as follows: Poisson’s ratio, Modulus of elasticity, and unit mass of 0.4, 1200 MPa, and 1.7 t/m3, respectively. This agreed to values given by (Bowles, Citation1997). The cross-sectional area of the link was chosen to be non-prismatic of starting top width of 0.5 m and decreased linearly to 0.25 m at culvert surface. All links were having common thickness of 0.5 m. It was thought that this area would be equivalent in mass of the horizontal projection of soil under consideration. The effective length of the rails that transfer the train loads directly to the culvert was equivalent to having 1:1 slope from the foundation edges up to rails level. shows schematic for the culvert and supporting system. shows the F.E. model used to simulate the culvert.
Figure 7. Schematic showing culvert and supporting system.
Figure 8. Numerical model for culvert.
Locomotive dynamic load
For single locomotive, two bogies of type “Co-Co” each have six wheels (Three Axles), and for each bogie, a separate motor was used to power the axles. Co-Cos is most suited to freight work as the extra wheels give them good traction (Silva, Costa, & Arêde, Citation2022). They are also popular because the greater number of axles results in a lower axle load to the track.
The recorded acceleration at a sleeper directly above the apex of the culvert (Ch1) was used to estimate the train impulse force. In this study, the locomotive force was considered the most effected car of the train. This could be attributed to its huge mass (122 ton) compared to passenger trailers. Moreover, the presence of the vibrating high frequency gearing mechanism worked in the amplification of the locomotive loads. shows a typical locomotive that has been used in the study. For each bogie, three successive impulses were assumed. The acceleration of each wheel was assumed equal to the measured acceleration at rail level. The dynamic force of the wheel can then be assumed as the measured acceleration multiplied by the wheel mass. The dynamic forces of the moving train were then transferred to the culvert by the aid of the calibrated links. shows the input forces of locomotive at speeds 16 and 31 Km/hr.
Figure 9. Captured train model 122 ton.

Figure 10. Locomotive forces for monitored trains.
With the aid of the FE model, the resulting stresses obtained from the measured dynamic loads were compared to their corresponding static values obtained using the typical train configuration model «Load Model 71» given by Egyptian code for calculating loads and forces on structural and masonry works (Mistrial decree 431, Citation2011) and the British standards (BS EN 1991–2,Citation2003. Eurocode 1: Actions on Structures – Part 2: Traffic Loads on Bridges.). shows the train equivalent loads as per Egyptian code. This configuration is recommended for the calculations in the case of the railway traffic on the mainline railways.
Figure 11. Train equivalent loads - load model 71.
Model calibration
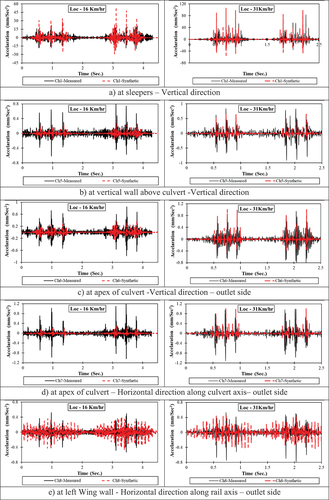
In this section, correlation between rails-soil-structure were examined. Several combinations- as stated earlier in this article – have been made including subgrade reaction of soil above and under culvert foundation, link properties, and moving load simulation. It was noted that changing the values of subgrade reactions from 2000 to 5000 t/m3 was not of great significant; however, the value of 4000 t/m3 gave the most satisfactory results. Fine tuning was also made for adjusting the characteristics of links – as shown in section 5. On the other hand, the final step of the calibration was to compare the measured and synthetic acceleration time histories in different parts of the buried culvert. Two experimental time histories – representing different locomotive speeds – were used for validation. Convergency of the readings resulting from the F.E. Model and field records were observed. Contrast of both records are shown in for selected locations at different train speeds. The graphs proved that the model was highly calibrated as the records showed good agreement between measured and produced records at both examined speeds.
Figure 12. Contrast between measured and synthetic response acceleration time history.
Based on the calibrated model, the resulting induced stresses at the critical sections of the structure can be obtained. The challenge was, therefore, to estimate the exact level of stresses at different parts of the structure using only the measured acceleration time histories which were corresponding to different train speeds. Thus, the model would be ready to be used further to predict the stress levels among different portions of the culvert due to different train speeds. In such methodology, many advantages will be obtained. Faster promising evaluation technique can be followed instead of performing an intensive investigation program. In addition, limiting the maximum train speed that might harm the structure.To validate this concept, normal stresses should be plotted against several train speeds obtained experimentally and numerically as will be seen later.
Dynamic analysis
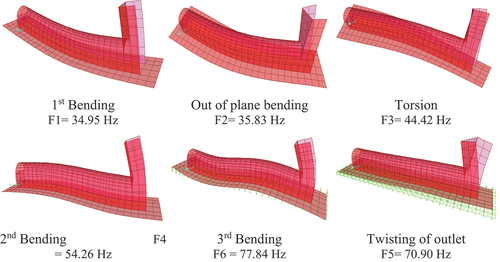
The purpose of the dynamic investigation was to determine the expected performance of the culvert under dynamic forces as well as the basic characteristics of the structure. Thus, determining the effect of dynamic impact of locomotive on the culvert. Formal modal analysis was conducted on the calibrated FE model. The fundamental mode shapes were obtained and shown in .
Figure 13. Fundamental modes of culvert.
Method statment
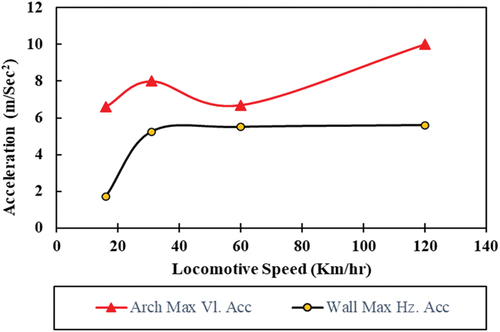
The aim of this section is, therefore, to anticipate the normal stress values by means of acceleration records corresponding to different locomotive speeds. This criterion can be used for this structure or similar as a kind of health monitoring technique. Moreover, it can be used to set train limit speed over such structure. The stresses resulting from the dynamic effect of the recorded locomotives were obtained from the numerical model. In addition, two artificial locomotives of the same geometry and mass were simulated numerically. The artificial locomotives were having higher speeds of 60 and 120 Km/hr., respectively. Firstly, correlation between peak acceleration and locomotive speed was plotted. shows relation between train speed and maximum obtained acceleration for both arch and walls. The graph depicts that maximum value of vertical acceleration measured at the arch increased with train speed. Whereas, for walls, the maximum value of horizontal acceleration records increased significantly till speed 31 Km/hr and was not affected further by train speed. For this, the relations will be established later between locomotive speeds and induced stresses.
Figure 14. Relation between train speed and maximum obtained acceleration for both arch and walls.
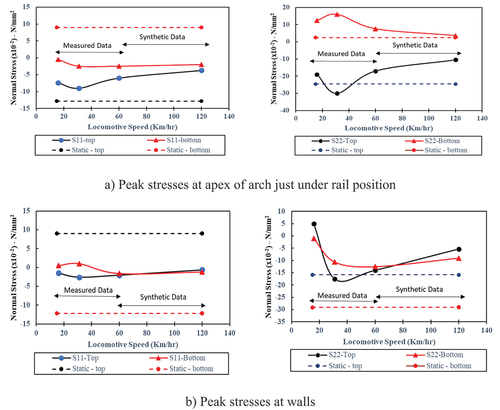
The relationship between the normal stresses in orthogonal directions along with train speeds was established at speeds 16, 31, 60, and 120 Km/hr. The plotted values were of the maximum stress values obtained on both faces of each element. Critical sections were considered at the apex of the arch and the base of the walls. displays the orthogonal normal stresses history at specific locations due to different locomotive speeds. The static stresses were also plotted on the graphs for comparison. Where as, S11 represents the normal stresses at x-direction, while S22 represents the normal stresses at y-direction.
Figure 15. Normal stresses at arch apex due to measured & artificial locomotives.
shows the relationship between static and peak normal stresses for both arch and walls at different train speeds. It was noted that for in plane deformation and stresses for both walls and arches, the loads exerted by the code was secured and overestimating the stresses resulting from low and high-speed trains. On the contrary, the out of plane deformation and stresses were very significant for stresses obtained in longitudinal direction for both walls and arch. It was noted that the arch was vulnerable of high stress levels at low speeds. On the other hand, the walls were subjected to tensile stresses when dealing with longitudinal section. This would emphasize the importance need to study structures in both directions especially for structures of higher aspect ratio.
Figure 16. Peak normal stresses at different locomotive speeds compared to code limits.
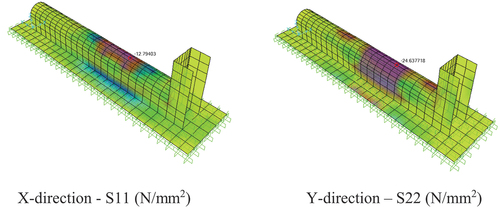
To check the affected zone of the culvert due to train passage, the envelope of stresses in orthogonal directions was plotted. shows the stress distribution due to passage of selected locomotive at speed 31 Km/hr. shows the stress distribution due to static train configuration – LM71. For x-direction, it was noted that maximum compression stress was (−0.13 N/mm2) at arch while the maximum tension was (+0.09 N/mm2) at base of walls. For y-direction, maximum compression stress was (−0.25 N/mm2) at arch while the maximum tension was (+0.02 N/mm2) at base of walls.
Figure 17. Envelope of normal stresses in orthogonal directions at speed 31 Km/hr.
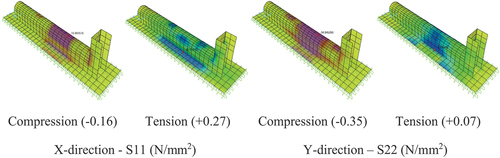
Figure 18. Stress distribution due to static train configuration – LM71.
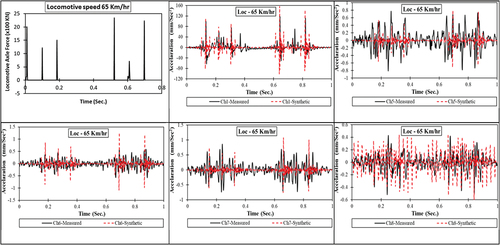
Validation
The proposed method depends on evaluating the state of stresses resulting from the passage of any train at any speed by measuring the vibrational acceleration response at any point in the structure. The dynamic effects of a conventional train were monitored while it was passing the structure under study at a speed of 65 km/hr, and the acceleration responses were recorded at the same previous locations. For accuracy, the monitored records of this train were also calibrated with the mathematical model, as shown in . At the monitored location, the deduced stress curves shows its compatibility with the expected results. This can be distinguished from the convergence of the observed train values with the artificial train with 60 km/hr. speed.
Figure 19. Contrast between measured and synthetic response acceleration time history.
Conclusions
The aim of the current research was to find the level of stresses in buried hydraulic structures while being in normal operation condition. The methodology depends on measuring vibrational response on available points among structure. With the aid of numerical modeling, one can expect normal stress levels among the given structure. The effect of train speed was studied. It was concluded that speeds between 30–60 Km/hr were in average the least causing stresses to the structure. It was, however, at low speeds (16 Km/hr), the contribution of engine vibration has significant affect in amplification of the transmitted forces to the structure. At high speeds (120 Km/hr), the structure exerted the maximum stresses. Moreover, the study showed that for uncracked design of hydraulic structures, the stress analysis should also be studied in the two orthogonal directions as the longitudinal section might bear more stresses compared to in-plane stress. In addition, although very low stress levels were obtained, one cannot ignore the effect of repetition of cyclic loads on non-reinforced masonry structures. It was also concluded that, as per the given configuration of the study case, the used method gives a quick estimation, with an acceptable degree of accuracy, for the effect of dynamic impact of the train’s motion on buried structures. The also study showed that the method can be used as nondestructive way of investigation and health monitoring of structure without the need for evacuation or malfunction the structure. Finally, it can be concluded that the study can further be used to set limiting speeds as well as the need of strengthening works on buried structures.
Disclosure statement
No potential conflict of interest was reported by the author(s).
References
- Anwar, A. M., & Abd Elwaly, A. M. A. (2023). Modal displacement vs curvature functions as damage identifier for masonry structures. Alexandria Engineering Journal, 68, 527–538. doi:10.1016/j.aej.2023.01.042
- Anwar, A. M., Elattar, A., & Abd-Elwaly, A. (2022). DIM for detecting cracks in masonry piers with different crack patterns. Journal of Engineering Sciences, 50(6), 335–349. doi:10.21608/jesaun.2022.147021.1149
- Bowles, J. E. (1997). Foundation analysis and design. In Text book (5th ed., pp. 125–505). Singapore: McGraw-Hill.
- Brando, G., Rapone, D., Spacone, E., & Giovanna Masciotta, M. (2022). MUD: A low computational effort multi-unit discretization procedure for modelling masonry walls with periodic arrangement. Structures, 43, 1380–1406. doi:10.1016/j.istruc.2022.07.038
- BS 8004:1986, The British Standard Code of practice for Foundations, BSI 10-1998, ISBN 0580 151662.
- BS EN 1991-2, 2003. Eurocode 1: Actions on structures – part 2: Traffic loads on bridges.
- Egyptian Code for Calculating Loads and Forces on Structural and Masonry Works, 2011, Minestrial decree (431) – 2012th edition.
- Hadzima-Nyarko, M., Mišetić, V., & Morić, D. (2017). Seismic vulnerability assessment of an old historical masonry building in Osijek, Croatia, using damage index. Journal of Cultural Heritage, 28, 140–150. doi:10.1016/j.culher.2017.05.012
- Hu, J., & Bian, X. (2022). Experimental and numerical studies on dynamic responses of tunnel and soils due to train traffic loads. Tunnelling and Underground Space Technology, 128, 104628. doi:10.1016/j.tust.2022.104628
- Hwang, E., & Nowak, A. S. (1991). Simulation of dynamic load for bridges. Journal of Structural Engineering, 117(5), 1413–1434. doi:10.1061/(ASCE)0733-9445(1991)117:5(1413)
- Lourenco, P. B. (1996). Computational strategies for masonry structures, Stevinweg: Delft University Press 1, 2628 CN Delft.
- Marföldi, M., Ballinas-González, R., Venglár, M., Sokol, M., & Rodríguez-Paz, M. X. (2018). Beginning of cracking of masonry walls due to vibrating and noise effects of machines. Vibroengineering Procedia, 21, 184–189. doi:10.21595/vp.2018.20347
- Montenegro, P. A., Carvalho, H., Ribeiro, D., Calçada, R., Tokunaga, M., Tanabe, M., & Zhai, W. M. (2021). Assessment of train running safety on bridges: A literature review. Engineering Structures, 241, 112425. doi:10.1016/j.engstruct.2021.112425
- Mutke, G. (2016). Peak particle velocity as an indicator of dynamic load exerted on the support of underground workings. Acta Geodynamica Et Geomaterialia, 367–378. doi:10.13168/AGG.2016.0019
- Orlando, M., Becattini, G., & Betti, M. (2023). Multilevel structural evaluation and rehabilitation design of an historic masonry fortress. Journal of Building Engineering, 63, 105379. doi:10.1016/j.jobe.2022.105379
- Pietruszczak, S., & Niu, X. (1992). A mathematical description of macroscopic behaviour of brick masonry. International Journal of Solids and Structures, 29(5), 531–546. doi:10.1016/0020-7683(92)90052-U
- Piyush, B., Devang, V., & Mehul, K. (2015). Impact of traffic vibration on heritage structures, www.ijates.com. International Journal of Advanced Technology in Engineering and Science, 03(3), 06–15.
- Rafiee, A., & Vinches, M. (2013). Mechanical behaviour of a stone masonry bridge assessed using an implicit discrete element method. Engineering Structures, 48, 739–749. doi:10.1016/j.engstruct.2012.11.035
- SAP2000, CSI: Computers and Structures Inc, Version 14.1.0. Computer software, 2009.
- Silva, R., Costa, C., & Arêde, A. (2022). Numerical methodologies for the analysis of stone arch bridges with damage under railway loading. Structures, 39, 573–592. doi:10.1016/j.istruc.2022.03.063
- Technical report for Geotechnical investigations for side slopes failure right bank of Ibrahimia Canal – (Aswan – Cairo) railway at KM 201.00, Construction Research Institute, CRI, May, 2011.
- Verstrynge, E., Lacidogna, G., Accornero, F., & Tomor, A. (2021). A review on acoustic emission monitoring for damage detection in masonry structures _ elsevier enhanced reader. Construction and Building Materials, 268, 121089. doi:10.1016/j.conbuildmat.2020.121089
- Wang, L., Wang, P., Wei, K., Dollevoet, R., & Li, Z. (2022). Ground vibration induced by high speed trains on an embankment with pile-board foundation: Modelling and validation with in situ tests. Transportation Geotechnics, 34, 100734. doi:10.1016/j.trgeo.2022.100734
- Zhang, K., Zhang, X., & Zhou, S. (2023). Analysis on dynamic behavior of 400 km/h high-speed train system under differential settlement of subgrade. Engineering Structures, 278, 278. doi:10.1016/j.engstruct.2022.115521