
 ?Mathematical formulae have been encoded as MathML and are displayed in this HTML version using MathJax in order to improve their display. Uncheck the box to turn MathJax off. This feature requires Javascript. Click on a formula to zoom.
ABSTRACT
Water scarcity is growing quickly, especially in the arid and semi-arid regions along with the growing population. So, using treated wastewater in agricultural irrigation presents a sustainable approach, enhancing soil quality, increasing organic carbon levels, and improving crop productivity are achieved through this approach, concurrently reducing the need for chemical fertilizers. Yet, escalating industrial effluent discharge raises concerns regarding trace metals in wastewater and associated health risks. Our study in the Tenth of Ramadan City focused on employing secondary treated mixed industrial and municipal wastewater for olives, mandarins, and guavas. Sampling wastewater, soil, and plant parts, we analyzed their properties and trace element concentrations, employing Visual MINTEQ for geochemical speciation. Adhering to the international guidelines, the wastewater exhibited acceptable pH and alkalinity but showed concerning trace element levels for irrigation. Differences in soil composition and trace element concentrations suggest potential contamination in soils irrigated with wastewater, raising concerns about health risks associated with elevated metal levels in plants. Variations in trace element concentrations in guavas, olives, and mandarins’ leaves and fruits were observed, with efficient translocation in olives, while mandarin and guava displayed reduced efficiency. Bioaccumulation Factor trends indicated species-specific metal uptake differences. Waste “Minimization Prioritization Tool categorized” trace element levels as of low concern. Daily Intake of Trace Metals and Health Risk Index highlighted the need for health risk assessment, especially for elevated Ni in mandarins and guavas. Regression findings emphasized soil factors influencing metal uptake in plants, highlighting the need for vigilant soil management to curb trace element contamination in agriculture, ensuring both food safety and environmental health. Therefore, water reuse adds contributes to sustainable development, which is three dimensions; Economic, Social and Environmental. It improves economics to utilize water that would be otherwise wasted, and by making water more productive. It improves the social dimension by addressing water scarcity and satisfying the increasing water demand for sustainable livelihoods. It also improves the environment by increasing wastewater treatment levels and reducing pollution.
Introduction
The Mediterranean region faces water scarcity due to factors such as inefficient water distribution, climate change, infrastructure limitations, and inadequate wastewater treatment (Ibrahim et al., Citation2023, Citation2023b; Soda et al., Citation2017). Addressing this issue requires a comprehensive strategy to reduce potable water use, particularly in agriculture, a significant water consumer (Sdiri et al., Citation2020). Using of reclaimed wastewater, enriched with nutrients, in agriculture proves to be an environmentally friendly solution, serves as a valuable agricultural resource, reducing the reliance on chemical fertilizers and mitigating pollution, fostering soil enrichment, increasing organic carbon levels, and enhancing crop yields while decreasing reliance on synthetic fertilizers (“Environmental Protection Agency” [EPA], Citation2016; Ibrahim & ElBastamy, Citation2023; Marinho, Tonetti, Stefanutti, & Coraucci Filho, Citation2013; Pereira et al., Citation2011; “World Health Organization” [WHO], Citation2006). Adopting this approach addresses water scarcity and advances environmentally conscious farming, providing a promising solution to alleviate the water issues in the coastal region.
The release of untreated or inadequately reclaimed wastewater in response to increased agricultural demands raises environmental concerns, including trace element contamination (Abegunrin, Awe, Idowu, & Adejumobi, Citation2016; Bichai, Polo-López, & Ibanez, Citation2012). Concerns have also emerged due to the rising discharge of industrial effluents, prompting considerations about the presence of trace metals in wastewater and potential health risks. Challenges persist, such as the potential leaching of trace elements like Cadmium (Cd), Zinc (Zn), Lead (Pb), and Copper (Cu) from municipal solid waste into the soil, posing risks to crops and human health (Ibrahim & ElBastamy, Citation2023; Sdiri, AlSalem, Al-Goul, Binkadem, & Ben Mansour, Citation2023; Singh, Sharma, Agrawal, & Marshall, Citation2009; Urbano, Mendonça, Bastos, & Souza, Citation2017; Wang, Chang, Wu, & Crowley, Citation2003). The accumulation of “Potentially Toxic Elements” (PTEs) in soils contaminated by industrial effluents raises environmental and health concerns. Properly managing trace elements is crucial for human and animal health, aligning with WHO a guideline (WHO, Citation1996). This involves complex mechanisms outlined by Clemens, Palmgren, and Krämer (Citation2002), emphasizing the need for thorough investigations into geochemical conditions and climate influences (Gerhardssor, Citation1995).
In agricultural soils, heavy metals, even in low concentrations, can accumulate, posing risks throughout the food chain (Baltrenaite, Sereviciene, & Paliulis, Citation2009; Han, Kingery, Selim, & Gerard, Citation2000; Melamed, Cao, Chen, & Ma, Citation2003). Numerous studies have explored the utilization of reclaimed wastewater in agriculture across various crops, including Olive, lettuce, radish, lemon, eggplant, and tomato. While it offers advantages such as increased crop production and reduced fertilizer requirements, challenges like soil salinization and contamination concerns persist (Cirelli et al., Citation2012; Nogueira et al., Citation2013; Pedrero, Allende, Gil, & Alarcón, Citation2012; Soda et al., Citation2017; Urbano, Mendonça, Bastos, & Souza, Citation2017). This study explores the use of secondary treated mixed industrial and municipal wastewater for agriculture, focusing on olives, mandarins, and guavas in the border of Tenth of Ramadan city. Precise sampling of wastewater, soil, and plant parts is conducted to analyze their physicochemical properties and trace element levels. Advanced tools, including the Visual MINTEQ program, are used to scrutinize the geochemical speciation of trace elements in wastewater and soil solutions. The research compares soils irrigated with wastewater to pristine soils, examining the relationship between extractable element content (using Diethylenetriaminepentaacetic acid – DTPA) and overall soil element concentration. Additionally, a novel method is introduced to assess metal activity in soil and its correlation with plant metal concentrations. The study evaluates bioaccumulation factors to understand plant capacity for metal accumulation.
Materials and methods
Materials
“High-purity chemicals” or “Laboratory-grade chemicals” were used in this examination. “De-ionized” water served as the base for preparing all reagent solutions. Merck provided standard solutions of Ni and Fe, while Fisher Scientific supplied standard solutions of Cd, Pb, and Cr. “Diethylenetriamine-N,N,N,’N”-pentaacetic acid (DTPA),” with a purity of 99%, was obtained from Starchemic. Hydroxyl ammonium chloride (NH2OH.HCl) and triethanolamine (C6H15NO3) were sourced from Oxford Laboratory. Panreac Quimica supplied nitric acid (65% w/v) and hydrogen peroxide (30% w/v). Technolab provided potassium nitrate, potassium dichromate, mercuric sulfate, and silver sulfate.
Sampling
Water sampling adhered to standard methods for water and wastewater analysis (Clesceri, Rice, Baird, & Eaton, Citation2017). Sixty water samples were collected from the outlet of maturation ponds and the artificial canal used for irrigation. Each sample required four bottles for analysis. One bottle was acidified with nitric acid to around 2% concentration to prevent changes in sample chemical composition, block oxidation reactions, and inhibit bacterial growth. Two bottles were left without additives for measuring physical properties and anions.
Forty five representative soil samples (0–60 cm depth) were collected, with each set of three representing one type of plant. In the lab, soil samples were air-dried, pulverized in an agate mortar, and sifted through a 2-mm sieve screen. Subsequently, these samples were analyzed for both chemical and physical properties.
A total of forty-five plant samples were gathered, with fifteen each for the leaves and fruits of olives, mandarins, and guavas. These samples underwent a washing process using distilled and deionized water, followed by drying at 70°C until a constant weight was achieved (“Association of Official Analytical Chemistsi“ [AOAC], Citation1984). The desiccated samples were pulverized utilizing a “mortar” and “pestle.”
Water analyses
The pH, and electric conductivity (EC) were estimated at 25 °C utilizing a pH meter “InoLabWTW,” and conductivity meter InoLab, respectively. Redox potential (Eh) was determined with an Ion analyzer (Orion model 960) calibrated with a redox buffer solution. Anions were measured using ion chromatography (“Dionex ion chromatography, model DX-500”). Trace elements and cations were analyzed and assessed utilizing “inductively coupled plasma-mass spectrometry (ICP-MS),” “PerkinElmer product model SCIEX Elan 9000.” Recovery investigations for the examined metal ions revealed recovery rates ranging from 96.2% to 103.6% in the recovery studies. The final bottle was acidified with phosphoric acid and used for dissolved organic carbon (DOC) measurement, conducted using a “DC-190 TOC analyzer (Tekmar Dohrmann) equipped with a non-dispersive infrared detector (NDIR).”
Soil analyses, extraction, and speciation methods
Mechanical analysis involved two stages: sieve analysis for coarse fractions (gravel and sand) and pipette methods for fine fractions (silt and clay). Soil pH and electrical conductivity (EC) were determined for both water and 0.01 M CaCl2 soil extracts, using a 1:2 soil-to-solution ratio. Soil organic matter (OM) was digested with H2SO4+K2Cr2O7 and determined via phenanthroline titration. For trace element analysis, soil samples were digested in aqua regia (1 HNO3: 3 HCl) and heated under reflux. Available trace elements in the soil were determined using the DTPA method with 0.005 M DTPA +0.01 M CaCl2 +0.1 M triethanolamine (pH 7.3) (Lindsay & Norvell, Citation1978).
For speciation analysis of trace elements (Cd, Cr, Fe, Ni, and Pb) in wastewater and soil solution (extracted after 15 days with a soil-to-water ratio of 1:2), the “Visual MINTEQ program” was applied. The data, including temperature, pH, Eh (with Cr and Fe redox speciation derived from measured Eh), DOC, trace elements, cations, and anions, were incorporated into the “Visual MINTEQ version 3.0 beta database, including the Stockholm Humic Model (SHM).”
Plant samples analyses
One-gram portions of each plant sample (olives, mandarins, and guavas) were subjected to digestion with a mixture of HNO3, HClO4, and HCl, and the resulting solutions were then filtered through a Millipore filter paper with a pore size of 0.45 µm. Subsequently, the samples were adjusted to a 50 mL volume with “de-ionized water,” and the metal contents were analyzed.
Results and discussion
Characteristics of treated wastewater
In this research, we followed the guidelines outlined by FAO (“Food and Agriculture Organization”) and WHO (“World Health Organization”) to evaluate the potential hazards associated with the unauthorized application of treated drainage wastewater in agricultural irrigation (“Food and Agriculture Organization” [FAO], Citation1985; “World Health Organization” [WHO], Citation2006). The study concentrated on analyzing diverse physicochemical parameters in wastewater obtained from an oxidation pond, treated on the farm, and later utilized by farmers for irrigation. The results, depicted in , showcase the descriptive statistical values of these specific parameters, summarizing our significant research outcomes. It’s noteworthy that all analyses were performed in triplicate, and the measurements consistently exhibited a relative standard deviation of less than ± 5%.
Table 1. Properties of treated wastewater samples in the present study (n = 45).
pH falls between 6.56 and 6.99, with an average of 6.72 ± 0.30. Falls within the acceptable range of 6.5 to 8.5 set by FAO/WHO, indicating the sample’s neutral to slightly acidic nature. Alkalinity ranges from 93.53 to 335.54 mg/L, averaging 168.34 ± 71.13. Alkalinity is within the study’s range but lacks a direct comparison to FAO/WHO standards. In accordance with the guidelines provided by the Food and Agriculture Organization (FAO, Citation1985), the pH, alkalinity, Cd, Cr, Fe, Ni, and Pb values of the treated wastewater fall within the acceptable range for irrigation, as shown in . The iron concentration marginally surpasses the prescribed threshold of 0.01 mg/L, necessitating consideration and potential measures for mitigation. The pH and alkalinity values within the acceptable range indicate that the wastewater treatment process has effectively neutralized acidity, ensuring the water is suitable for irrigation. The presence of trace elements within permissible limits suggests that the treatment methods employed were successful in reducing these contaminants to safe levels.
Table 2. The comprehensive pollution index (CPI), water quality classification, and designated uses.
“Electrical conductivity (EC)” and “total dissolved solids (TDS)” indicate salinity risk, hindering plant water absorption and nutrient intake. Elevated EC implies reduced water availability (de León, Leal, Ramírez, Álvarez, & Santacruz de León, Citation2017). EC ranges from 902.9 to 1389 mS/cm, with an average of 1197.4 ± 43.72, falling within the 700–3000 range suggested by FAO/WHO, denoting moderate conductivity. TDS span from 425.7 to 1013.9 mg/L, with an average of 741.1 ± 45.92, falling within the 450–2000 range suggested by FAO/WHO, and thus remaining within acceptable limits. FAO (Citation1985) categorize irrigation suitability based on TDS: suitable (less than 500 mg/L), marginal (500–2000 mg/L), and unsuitable (exceeding 2000 mg/L). Examined samples are classified within the marginal category for irrigation according to their Total Dissolved Solids (TDS) values.
Furthermore, applying the classification diagram by Wilcox (Citation1948), the water samples span from the “good” to “permissible” to “doubtful” categories. In this study, the “infiltration rate of water,” a vital indicator of irrigation efficiency and crop yield, was evaluated using Electrical Conductivity (EC) and Sodium Adsorption Ratio (SAR) values, ranging from 2.54 to 7.52 (averaging 4.17 ± 0.35), indicate potential soil quality implications. While not directly compared to FAO/WHO standards, these values imply slight to moderate soil restrictions, affecting efficient irrigation (Patle, Sikar, Rawat, & Singh, Citation2018). According to Richards (Citation1954), these water samples seem suitable for irrigation across diverse soil types, supported by the residual sodium carbonate (RSC), suggesting their safety for irrigation purposes.
The Comprehensive Pollution Index (CPI), as depicted in and , spans a range from 0.0005 to 1.93, averaging at 0.57. This average signifies that the treated wastewater collected is classified as qualified (0.04–0.8). The graphical representation in , utilizing 50% stacked columns, highlight TDS, chloride, sodium, and sulfate, with cadmium and chromium exerting the least influence amoh
Figure 1. The comprehensive pollution index (CPI) values.
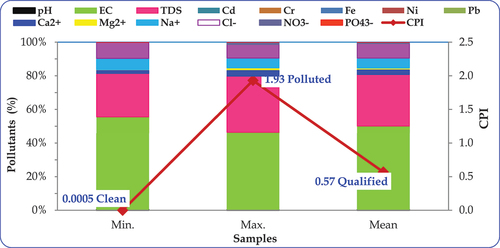
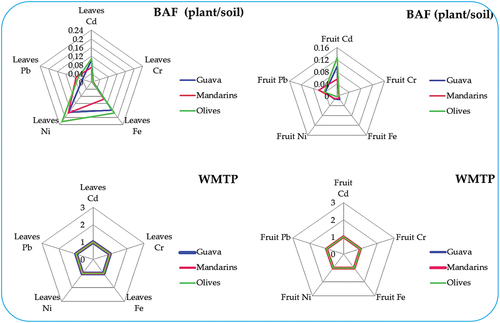
Figure 2. The bioaccumulation factor (BCF) values related to heavy metals found in the leaves and fruits of plants cultivated in varied farms, including guava, mandarin, and olive farms. Additionally, the figure presents their classification using the waste minimization prioritization tool (WMPT). Under this framework, a WMPT score of 1 denotes low concern for BCF values below 250, a score of 2 indicates medium concern within the range of 250 to 1000, and a score of 3 signifies high concern when the BCF surpasses 1000.
Characteristics of soil samples and trace element concentrations
The soil analysis reveals a predominantly sandy composition, with sand particles comprising an average of 99.51%, . Silt, present in smaller quantities, ranges from 0.04% to 1.20%, averaging 0.44%. The mineral composition showcases varying degrees of sand granularity, with Very Coarse Sand accounting for 11.79%, Coarse Sand at 21.46%, Medium Sand at 30.21%, Fine Sand at 25.13%, and Very Fine Sand at 7.6%. Clay content remains relatively low at an average of 0.05%. Additionally, the soil contains an average organic carbon content of 0.83% and exhibits a broad range of calcium carbonate presence, spanning from 0.48% to 15.2% and averaging 9.23%. The difference between pH(CaCl2) and pH(H2O), denoted as Δ pH, can serve as an indicator of the soil’s charge characteristics. The positive Δ pH values indicative of variable charge minerals dominating the soil. These minerals, such as aluminum and iron oxides, alter their charges with changing pH, causing a decrease in pH when measured in CaCl2 compared to water. While the negative Δ pH values suggest soils with a substantial permanent negative charge (Uehara & Gillman, Citation1981). This can be due to the presence of clay minerals like kaolinite or organic matter that consistently bear negative charges regardless of the pH of the solution. In this study, all the studied samples exhibit ΔpH values less than −0.5, as defined by Uehara and Gillman (Citation1981). This suggests that these soils are primarily composed of variable charge minerals.
Table 3. Range, mean values, and standard deviation (n = 45) for soil sample characteristics: particle size, organic carbon (OC), calcium carbonate (CaCO3), pH, and electrical conductivity (EC).
The furnishes a comprehensive analysis of the concentrations of five trace elements – cadmium (Cd), chromium (Cr), iron (Fe), nickel (Ni), and lead (Pb) – in soil samples gathered from three distinct farms: Guava soil, Olive soil, and Mandarin soil. The standard deviation serves as a measure of the variability in trace element concentrations within each set of samples, with higher standard deviations signifying greater variability. In this context, Cd, Cr, Fe, and Ni have relatively high standard deviations, indicating substantial variability among different farms. Conversely, Pb exhibits a lower standard deviation, suggesting more consistent concentrations across the soil samples.
Table 4. Range, average, and variation (n = 45) of examined soil trace elements, along with mean available index ratios*.
The shows that the minimum Cd concentration observed in these soils is 1.19 mg/kg (mandarin farm), while the maximum concentration is 8.52 mg/kg. The mean Cd concentration across all samples is 5.05 mg/kg. This indicates a significant variation in Cd levels between different farm soils, with the highest levels found in Guava farm. Chromium concentrations also vary widely. The minimum Cr concentration is 315.4 mg/kg (olive farm), the maximum is 750.33 mg/kg (Guava farm), and the mean concentration is 505.6 mg/kg. These results suggest that Cr concentrations are substantially elevated in some of the farm soils, especially in Guava farm. Iron concentrations exhibit a broad range as well. The minimum Fe concentration is 8333.5 mg/kg (olive farm), the maximum is 13,775.62 mg/kg (Guava farm), and the mean concentration is 10,537.98 mg/kg. This highlights significant differences in Fe levels, with GS3 having the highest Fe content among all samples. Nickel concentrations vary from a minimum of 164.85 mg/kg (olive farm) to a maximum of 802.41 mg/kg (Guava farm). The mean Ni concentration is 451.37 mg/kg. This Ni concentration was substantially higher than that in the virgin soil, which had an average Ni concentration of 10.10 mg/kg. Lead concentrations in these soils range from a minimum of 54.27 mg/kg (olive farm) to a maximum of 80.43 mg/kg (mandarin farm). The mean Pb concentration is 66.61 mg/kg. The overall Pb concentrations remain within a relatively narrow range compared to the other trace elements. These findings highlight the considerable differences in trace element concentrations between soils irrigated with treated wastewater and virgin soils, indicating the potential impact of wastewater irrigation on soil quality and the need for careful management to mitigate potential environmental and health risks.
The data reveals that Cd, Cr, Fe, and Ni concentrations in farm soils vary significantly among the samples and are generally higher than those in the virgin soil. This suggests potential contamination or enrichment of these elements in the farm soils. Pb concentrations show less variation and remain relatively close to the values in virgin soil. The results emphasize the need for further investigation into the sources and potential environmental and health impacts of elevated trace element concentrations in these soils, especially in locations with markedly higher levels like Guava farm for Cd, Cr, and Fe.
DTPA was employed to assess the available forms of trace elements, yielding extractable levels of Cd, Cr, Fe, Ni, and Pb at 0.36, 20.27, 335.88, 35, and 1.87 mg/kg, respectively. Comparing these values to established toxicity thresholds of 3 mg/kg for Cd, 50 mg/kg for Cr, Ni, and 100 mg/kg for Pb, it is evident that the extractable levels of Cd, Ni, and Pb fall within permissible limits. The mean values of the available index ratio for Cd, Cr, Fe, Ni, and Pb are 6.4, 3.7, 3.2, 6.9, and 2.7, respectively. In terms of the mean extracted trace element concentrations from soils, they can be ranked in descending order as Pb > Fe > Cr > Cd > Ni.
In summary, the table highlights the heterogeneity of trace element concentrations in different soil samples, providing valuable insights into potential soil contamination or enrichment, which can have ecological and health implications.
Assessment of trace element concentrations in plants: Implications for environmental and health impact
Trace elements in plants and the factors influencing their uptake by plants are significant considerations in understanding environmental and health impacts. provides insight into the concentrations of Cd, Cr, Fe, Ni, and Pb in different parts of edible plants, namely guavas, olives, and mandarins.
Table 5. Mean values of trace element concentrations in plant parts [leaves and fruits].
reveals that the leafy parts of these edible plants tend to have higher concentrations of Cd, Cr, Fe, Ni, and Pb compared to their fruits. This phenomenon is attributed to the physiology of leafy vegetables, which have higher translocation and transpiration rates. In contrast, other vegetables have a longer path for metal transfer from roots to stems and then to fruits, resulting in lower metal accumulation in fruits compared to leafy vegetables (Itanna, Citation2002). Furthermore, the analysis highlights variations in metal levels among different plant species. Guava fruits, for instance, exhibit the highest levels of Cd, Cr, Fe, and Ni, while olive fruits contain lower concentrations of Cr, Fe, Ni, and Pb. On the other hand, mandarin fruits show a higher level of Pb but a lower level of Cd. The concentration of trace elements in plant leaves ranged from 0.32 to 0.92 mg/kg for Cd, 1.34 to 6.66 mg/kg for Cr, 958.82 to 2264.17 mg/kg for Fe, 37.97 to 142.68 mg/kg for Ni, and 2.40 to 6.31 mg/kg for Pb. In edible fruits, these concentrations ranged from 0.23 to 0.84 mg/kg for Cd, 2.14 to 5.16 mg/kg for Cr, 12.46 to 205.84 mg/kg for Fe, 0.15 to 13.60 mg/kg for Ni, and 1.92 to 5.11 mg/kg for Pb.
To assess the potential health risks, it is important to compare these concentrations with dietary intake limits. Cd concentrations generally do not exceed 0.5 mg/kg in dietary intake limits, but levels exceeding 1 mg/kg have been found in the leaves and fruits of guavas and olives grown in contaminated soils. Similarly, Cr concentrations rarely exceed 0.2 mg/kg in dietary intake limits, yet concentrations above 1 mg/kg have been detected in all studied plant leaves and fruits. For Fe, concentrations in dietary intake limits generally remain below 200 mg/kg, but concentrations above 1 mg/kg have been observed in the leaves of guava and olives. Ni concentrations usually do not exceed 2 mg/kg in dietary intake limits, but levels above 1 mg/kg have been identified in the leaves of guavas, olives, mandarins, and the fruits of guavas and mandarins. Pb concentrations typically do not exceed 3 mg/kg in dietary intake limits, but concentrations above 1 mg/kg have been recorded in the leaves of guavas, olives, mandarins, and the fruits of mandarins.
The Bioaccumulation Factor (BCF) is a critical metric that measures the ability of plants, specifically leaves and fruits, to accumulate certain substances, typically trace elements or pollutants, from the surrounding environment. BCF is a ratio that compares the concentration of a substance in the plant (Illustrate the elemental composition (in dry matter) of plants) or grain (demonstrate the accumulation of trace elements in the edible parts of vegetables) to the concentration of that same substance in the surrounding environment, such as soil (Hussain et al. Citation2022), Eq. (1). In leaves and fruits, the BCF serves as an indicator of how effectively these plant parts uptake and retain substances from their surroundings. Higher BCF values suggest a greater propensity for the plant to accumulate and retain these substances, potentially leading to higher concentrations in edible parts of the plant.
Applying EquationEquation (4)(4)
(4) calculated the BCF for trace elements in fruit and leaf tissues. The data described in illustrates distinct trends in BAF (from soil to plant) for different trace elements. In leaves, the BAF trend follows Ni > Cd > Fe > Pb > Cr, while in fruits, it’s Cd > Pb > Fe > Ni > Cr. Interestingly, while soil generally contains higher trace element concentrations than plant leaves or fruits, only a fraction of these elements transfer to the plants. Notably, more elements translocate to leaves than fruits, suggesting differential accumulation patterns between plant parts. Mandarins, for instance, exhibit higher accumulation of several metals in both leaves and fruits compared to Guavas and Olives, showcasing unique uptake capabilities. These variations highlight species-specific differences in metal uptake and accumulation capacities, offering insights into their potential use in phytoremediation strategies or as indicators for metal contamination in agricultural produce. Understanding these diverse accumulation patterns aids in assessing environmental impacts and devising targeted approaches for managing metal contamination in ecosystems. Further exploration into factors influencing bioaccumulation would enhance our understanding of metal uptake mechanisms in plants and their potential roles in remediation.
The comparison with the Waste Minimization Prioritization Tool (WMPT) scoring system, as presented by Ibrahim and ElBastamy (Citation2023); Ibrahim and Ramzy (Citation2013) and illustrated in , provides valuable insights into the potential environmental impact of trace elements in guava, olives, and mandarins. The observed categorization of Cd2+, Fe2+, Ni2+, and Pb2+ levels in the leaves and fruits of these plants as being of low concern implies that, according to the WMPT scoring system, the concentrations of these trace elements fall within permissible thresholds, minimizing potential adverse effects on the ecosystem and human health. It also indicates that, according to the WMPT criteria, these plants may not pose significant environmental risks related to trace element accumulation in their leaves.
Figure 3. Translocation factors (TF) of heavy metals in a guava, mandarin, and olive farms.
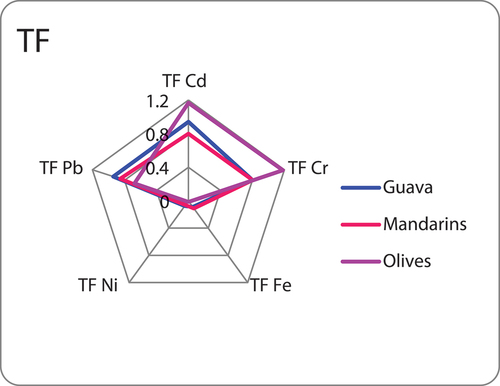
Translocation factor (TF) assessments were conducted to determine the categorization of plants as accumulators, employing the following Eq. (2). For plants to be categorized as bioaccumulators, they need to demonstrate translocation factors for trace elements surpassing one (Siahaan, Ambariyanto, & Yulianto, Citation2013). Hyperaccumulator plants, found in their natural habitat, possess the capacity to accumulate heightened concentrations of trace elements, especially in the above-ground tissue surfaces (Baker & Brooks, Citation1989).
In , which illustrates the translocation factors of trace elements in olives, we observe that the leaves-fruit translocation exhibits notable efficiency, particularly for Cd (cadmium) and Cr (chromium), with translocation factors of 1.77 and 1.88, respectively. These values suggest a significant transfer of these trace elements from the leaves to the fruit in the olive plant. In contrast, when considering mandarin and guava leaves and fruit, the translocation factors (TF) for Cd, Cr, Fe (iron), Ni (nickel), and Pb (lead) are consistently lower than 1. This implies that, in these species, the movement and accumulation of these trace elements from the leaves to the fruit are less efficient compared to olives. The TF values below 1 indicate a reduced translocation of these elements to the edible parts of mandarin and guava plants. The diminished translocation factors observed for Cd, Cr, Fe, Ni, and Pb metals in guava, mandarin, and olives (Fe, Ni, and Pb) may suggest that these plants utilize these metals predominantly for metabolic processes and growth within their leaves.
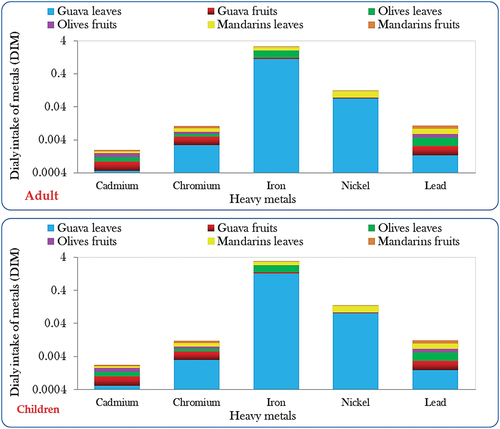
“Daily intake of trace metals (DITM)” refers to the amount of trace metals, such as cadmium, chromium, iron, nickel, and lead that an individual typically ingests daily through their diet or other sources like water. DITM is an important metric in assessing human exposure to these elements and evaluating potential health risks associated with excessive or inadequate intake. Regulatory bodies often establish recommended daily intake levels to guide individuals in maintaining a balanced and healthy diet without risking toxicity or deficiency of essential trace metals. The Daily Intake of Trace Metals (DITM), calculated as per Eq. (3) following methods outlined by Arora et al. (Citation2008) and Khan, Cao, Zheng, Huang, and Zhu (Citation2008) is determined through the formula:
Where Cmetal signifies the concentrations of trace elements in plants (mg kg−1), Cfactor represents the conversion factor (0.085), Dfood intake denotes the daily intake of vegetables (0.345 and 0.232 kg person−1 day−1 for adults and children, respectively), and Baverage weight refers to the average body weight (55.9 and 32.7 kg for adults and children, respectively), based on data from Rattan, Datta, Chhonkar, Suribabu, and Singh (Citation2005) and Wang, Sato, Xing, and Tao (Citation2005).
The Health Risk Index (HRI) or the target hazard quotient (THQ) for trace metals in plant tissues, especially leaves and fruits, evaluates potential health hazards. Calculating HRI involves comparing metal intake to safe levels. An HRI below 1 suggests lower risks, while exceeding 1 indicates potential health concerns. Monitoring HRI guides safety measures for food and public health. HRI was computed using Eq. (4) based on the methodology by Khan, Cao, Zheng, Huang, and Zhu (Citation2008):
Where: RfOD stands for the Reference oral dose allocated for each metal. The considered values are: 0.001, 0.003, 0.04, 0.02, 0.03, 200, and 0.0035 ppm for Cd, Cr, Cu, Ni, Zn, Fe, and Pb, respectively, as per Cui et al. (Citation2004) and WHO (Citation1993). Humans are considered safe when the HRI value remains below 1, indicating a lower risk level according to established safety guidelines (Cui et al., Citation2004; WHO, Citation1993). In this research, the values of DITM were computed independently as depicted in for both children and adults. Subsequently, the HRI values were derived from the calculated DIM values.
Figure 4. Daily intake for metal ions (DITM) found in analyzed crops.
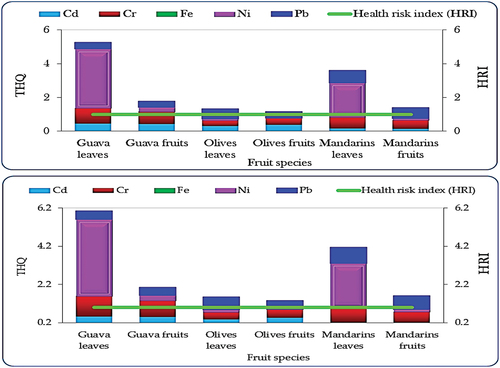
The results of HRI values of the studied crops (mandarins, guava, and olives) irrigated with treated wastewater in indicated that for both olives and mandarins, HRI values were lower than 1 for all measured trace metals showing no health risk while for Ni in leaves of mandarins (3.50 and 4.02 for adult and children, respectively) and guava (2.06 and 2.37 for adult and children, respectively), exceeded the limits which indicating a potential future risk, . The TTHQ values above 1 suggest a compounded health risk from combined metal intake across the various plant sources, indicating a need for monitoring and potential mitigation strategies to ensure food safety and reduce health risks associated with these metals.
Figure 5. Target hazard quotient (THQ) for individual metals and the overall total health index (HI) across different farms, encompassing all examined heavy metals.
Factors influencing metal uptake in plants and relationships between soil and plant metal content
The uptake of trace elements by plants is a complex process influenced by various factors. Among these factors are the metal concentrations present in the soil, soil pH, cation exchange capacity (CEC), organic matter content, the specific plant types and varieties, and the age of the plants. It is widely acknowledged that the concentration of metals in the soil plays a pivotal role in this process, as it directly affects the availability of metals for plant uptake (Pedrero, Allende, Gil, & Alarcón, Citation2012; Soda et al., Citation2017; Urbano, Mendonça, Bastos, & Souza, Citation2017).
The relationships between the total metal content in different plant parts (leaves and fruits) and the corresponding soil samples are illustrated in . Notably, the metal levels detected in plants closely mirrored those found in the soil, with total metal concentrations in the soil emerging as the primary influencing factor for metal accumulation in the parts of plant. Additionally, soil pH exhibited a negative correlation with metal accumulation in plants, signifying its significant role in governing the uptake of metals by plants. Furthermore, the organic carbon content and the presence of calcium carbonate (% CaCO3) also contributed to the prediction of metal concentrations in plants under specific circumstances, as indicated in . The statistical analysis revealed the substantial impact of total metal concentration in soil on metal uptake by plants. For several trace elements, including Cd, Cr, and Ni in both plant parts, as well as Fe (in leaves) and Pb (in fruits), the coefficient of total soil metal content demonstrated high significance levels (p < 0.01). Furthermore, Fe in fruits and Pb in leaves displayed significant coefficients (p < 0.05) in relation to total soil metal content.
Table 6. Linear regression analysis of soil composition’s impact on metal uptake in plant leaves and fruits.
These findings emphasize the intricate interplay between soil properties, metal concentrations, and plant metal uptake mechanisms. Understanding these relationships is crucial for managing and mitigating the potential risks associated with trace element accumulation in edible plants and the subsequent impact on human health and the environment.
Regression analysis: Correlating soil metal activity with plant metal uptake
The illustrates regression analyses exploring the connections between soil metal ion activity (Cd2+, Cr3+, Cr2O72-, Fe2+, Fe3+, Ni2+, and Pb2+), plant metal accumulation in leaves and fruits, and key soil parameters (pH, CaCO3%, and OC%). These analyses were conducted using SPSS regression software, and aimed to unravel the complex relationships governing metal uptake by plants. They also extended to predict soil metal ion activity based on total metal concentrations in plant parts. Logarithmic transformations were applied to the data for analysis within the Visual MINTEQ speciation program, enhancing the understanding of these intricate relationships. Examining metal activity in leaves and fruits unravels intricate associations between specific metal ions and plant parts:
Table 7. Regression analysis of soil activity for Cd2+, Cr3+, Cr2O72–, Fe2+, Fe3+, Ni2+, and Pb2+ with plant total Cd, Cr, Fe, Ni, and Pb, along with selected soil physical parameters including pH, calcium carbonate (CaCO3%) and organic carbon (OC%) levels. The analysis utilizes logarithmically transformed data.
In leaves, Cd2+ demonstrates a positive relationship with CdT leaves while inversely correlating with pH and CaCO3 content. Cr3+ exhibits a positive correlation with CrT leaves and OC content but shows negative associations with pH and CaCO3. In contrast, Cr2O72– solely relates positively to CrT leaves and OC content. Both Fe2+ and Fe3+ activities positively associate with FeT leaves but exhibit negative relationships with pH and CaCO3. Ni2+ showcases a positive correlation with NiT leaves but inversely correlates with pH while positively associating with CaCO3. Meanwhile, Pb2+ primarily correlates positively with PbT leaves.
In fruits, Cd2+ activity positively aligns with CdT fruits but negatively correlates with pH and CaCO3. Cr3+ in fruits links positively with CrT fruits and OC content while displaying negative relationships with pH and CaCO3. Ni2+ shows a positive correlation with NiT fruits but negatively relates to both pH and OC. In contrast, Pb2+ activity in fruits primarily correlates positively with Pb levels (PbT fruits).
Accompanying R2 values (ranging from 0.361 to 0.998) denote the model’s fit to observed data, elucidating complex interplays among soil metal ion activity, plant uptake, and pertinent soil parameters. Notably, total metal concentrations in plant parts notably influence metal activity in the soil, while soil pH exhibits a consistent negative correlation with metals in plants and soil. Furthermore, CaCO3 (%) and OC (%) contribute to predicting metal concentrations in plants under specific conditions, highlighting their roles within the soil-plant continuum. These findings hold crucial implications for understanding environmental impacts and interactions within this ecosystem.
Conclusion and recommendations
The study evaluated risks associated with using treated drainage wastewater in agricultural irrigation, adhering to FAO and WHO guidelines. Pre-treatment analysis revealed acceptable pH and trace element levels but indicated marginal suitability due to elevated electrical conductivity and total dissolved solids. Soil examination suggested higher trace element concentrations compared to virgin soil, potentially from wastewater irrigation, warranting further environmental impact investigation. Analysis of trace elements in edible plants showed variations, with efficient translocation observed in olives and species-specific accumulation patterns. Levels of Cd2+, Fe2+, Ni2+, and Pb2+ in plant tissues were categorized as of low concern based on WMPT scoring. However, DITM and HRI calculations highlighted health risks, particularly for Ni in mandarins and guavas, emphasizing the need for monitoring and mitigation strategies. Soil factors significantly influenced metal uptake by plants, with soil pH playing a crucial role. Strong correlations between soil metal concentrations and those in plant parts were identified, underscoring the importance of soil quality management in mitigating contamination risks in agricultural systems utilizing treated wastewater.
Hence, adopting a safe and appropriate water reuse concept is crucial as it contributes to sustainable development across three dimensions: Economic, Social, and Environmental. It enhances economics by utilizing water that would otherwise go to waste, thereby increasing productivity. It addresses social concerns by mitigating water scarcity and meeting the rising demand for sustainable livelihoods. Additionally, it benefits the environment by elevating wastewater treatment levels and decreasing pollution levels.
Based on the study’s evaluation following FAO and WHO guidelines, despite concerns about elevated element concentrations, the final recommendation regarding the use of these crops in the region is to proceed with caution. Ongoing monitoring of soil and water quality is advised to ensure safety standards are met. Further research is recommended to understand long-term effects on crop quality and consumer health. Meanwhile, implementing mitigation measures like soil management and targeted monitoring can minimize risks and ensure produce safety. Recommendations include managing salts, nutrients, and harmful trace elements, assessing soil conditions, and exploring phytoremediation. For wastewater, strict monitoring, regular assessments, and suitable treatment methods are advised to safeguard fruit quality and consumer health, and maintain market trust in produce irrigated with treated wastewater and industrial water.
Acknowledgment
The authors express their sincere gratitude to the directors of WMRI and CLEQM for their invaluable assistance.
Disclosure statement
No potential conflict of interest was reported by the author(s).
References
- Abegunrin, T. P., Awe, G. O., Idowu, D. O., & Adejumobi, M. A. (2016). Impact of wastewater irrigation on soil physico-chemical properties, growth and water use pattern of two indigenous vegetables in Southwest Nigeria. Catena, 139, 167–178. doi:10.1016/j.catena.2015.12.014
- AOAC (Association of Official Analytical Chemists). (1984). Official methodology for analysis (14th ed.). Arlington, Virginia, USA: Association of Official Analytical Chemists.
- Arora, M., Kiran, B., Rani, S., Rani, A., Kaur, B., & Mittal, N. (2008). Heavy metal accumulation in vegetables irrigated with water from different sources. Food Chemistry, 111(4), 811–815. doi:10.1016/j.foodchem.2008.04.049
- Baker, A. J. M., & Brooks, R. R. (1989). Terrestrial higher plants which hyperaccumulate metallic elements. A review of their distribution, ecology, and phytochemistry. Biorecovery, 1(2), 81–126.
- Baltrenaite, E., Sereviciene, V., & Paliulis, D. (2009). Variation of carbon and metal concentration in soil amended with sewage sludge. Ekologija, 55(1), doi:10.2478/v10055-009-0001-0
- Bichai, F., Polo-López, M. I., & Ibanez, P. F. (2012). Solar disinfection of wastewater to reduce contamination of lettuce crops by Escherichia coli in reclaimed water irrigation. Water Research, 46(18), 6040–6050. doi:10.1016/j.watres.2012.08.024
- Cirelli, G. L., Consoli, S., Licciardello, F., Aiello, R., Giuffrida, F., & Leonardi, C. (2012). Treated municipal wastewater reuse in vegetable production. Agricultural Water Management, 104, 163–170. doi:10.1016/j.agwat.2011.12.011
- Clemens, S., Palmgren, M. G., & Krämer, U. (2002). Advances in understanding and engineering plant metal accumulation. Trends in Plant Sciences, 7(7), 309–315. doi:10.1016/S1360-1385(02)02295-1
- Clesceri, L. S., Rice, E. W., Baird, R. B., & Eaton, A. D. (Eds.). (2017). Standard methods for the examination of water and wastewater (23rd ed.). Washington DC, USA: American Public Health Association (APHA), American Water Works Association (AWWA), and Water Environment Federation (WEF).
- Cui, Y.-J., Zhu, Y.-G., Zhai, R.-H., Chen, D.-Y., Huang, Y.-Z., Qiu, Y., & Liang, J.-Z. (2004). Transfer of metals from soil to vegetables in an area near a smelter in Nanning, China. Environmental International, 30(6), 785–791. doi:10.1016/j.envint.2004.01.003
- de León, G. S., Leal, J. A. R., Ramírez, M. J., Álvarez, B. L., & Santacruz de León, E. E. (2017). Quality indices of groundwater for agricultural use in the Soconusco, Chiapas, Mexico. Earth Science Research Journal, 21(3), 117–127. doi:10.15446/esrj.v21n3.63455
- EPA (Environmental Protection Agency). (2016). Water recycling and reuse: The environmental benefits. Retrieved from http://www.epa.gov/region9/water/recycling/
- FAO (Food and Agriculture Organization). (1985). Water quality for agriculture. In R. S. Ayers, & D. W. Westcot, (Eds.) Irrigation and Drainage Paper. 29, rev. 1 (pp. 1–174). Rome, Italy: FAO of the United Nations. https://www.waterboards.ca.gov/water_issues/programs/tmdl/records/state_board/1985/ref2648.pdf
- Gerhardsson, L. (1995). Health effects and biological monitoring: The toxicity of lead. In S. B. Abdullah & M. A. Vohora (Eds.), Trace and toxic elements in nutrition and health (pp. 149–162). New Delhi, India: Wiley Eastern Limited.
- Han, F. X., Kingery, W. L., Selim, H. M., & Gerard, P. D. (2000). Accumulation of heavy metals in a long-term poultry waste-amended soil. Soil Science, 165(3), 260–268. doi:10.1097/00010694-200003000-00008
- Hussain, B., Abbas, Y., Ur-Rahman, S., Ali, H., Zafar, M., & Valderrama, J. R. D. (2022). Chapter 2 - Metal and metalloids speciation, fractionation, bioavailability, and transfer toward plants. In T. Aftab & K. Hakeem (Eds.), Metals metalloids soil plant water systems (pp. 29–50). Academic Press. doi:10.1016/B978-0-323-91675-2.00026-3
- Ibrahim, L. A., Abu-Hashim, M., Shaghaleh, H., Elsadek, E., Hamad, A. A. A., & Alhaj Hamoud, Y. (2023). A comprehensive review of the multiple uses of water in aquaculture-integrated agriculture based on international and national experiences. Water, 15(2), 367. doi:10.3390/w15020367
- Ibrahim, L. A., & ElBastamy, E. E. (2023). The influence of water quality on fish tissues and blood profile in Arab Al-Ulayqat lakes, Egypt. The Egyptian Journal of Aquatic Research, 49(2), 235–243. doi:10.1016/j.ejar.2023.01.006
- Ibrahim, L. A., & Ramzy, E. (2013). Water quality and its impact on Tilapia Zilli (case study) Qarun Lake-Egypt. International Water Technology Journal, 3(4), 170–191.
- Ibrahim, L. A., Shaghaleh, H., Abu-Hashim, M., Elsadek, E. A., & Hamoud, Y. A. (2023). Exploring the integration of rice and aquatic species: Insights from global and national experiences. Water, 15(15), 2750. doi:10.3390/w15152750
- Itanna, F. (2002). Metals in leafy vegetables grown in addis ababa and their toxicological implications. Ethiopian Journal of Health Development, 16(3), 295–302. doi:10.4314/ejhd.v16i3.9797
- Khan, S., Cao, Q., Zheng, Y., Huang, Y., & Zhu, Y. (2008). Health risks of heavy metals in contaminated soils and food crops irrigated with wastewater in Beijing, China. Environmental Pollution, 152(3), 686–692. doi:10.1016/j.envpol.2007.06.056
- Lindsay, W. L., & Norvell, W. A. (1978). Development of DTPA soil test for zinc, iron, manganese, and copper. Soil Science Society of America Journal, 42(3), 421–428. doi:10.2136/sssaj1978.03615995004200030009x
- Marinho, L. E. O., Tonetti, A. L., Stefanutti, R., & Coraucci Filho, B. (2013). Application of reclaimed wastewater in the irrigation of rosebushes. Water, Air, and Soil Pollution, 224(9), 1669. doi:10.1007/s11270-013-1669-z
- Melamed, R., Cao, X., Chen, M., & Ma, L. Q. (2003). Field assessment of lead immobilization in a contaminated soil after phosphate application. Science of the Total Environment, 305(1–3), 117–127. doi:10.1016/S0048-9697(02)00469-2
- Nogueira, S. F., Pereira, B. F. F., Gomes, T. M., de Paula, A. M., dos Santos, J. A., & Montse, C. R. (2013). Treated sewage effluent: Agronomical and economical aspects on bermudagrass production. Agricultural Water Management, 116, 151–159. doi:10.1016/j.agwat.2012.07.005
- Patle, G. T., Sikar, T. T., Rawat, K. S., & Singh, S. K. (2018). Estimation of infiltration rate from soil properties using regression model for cultivated land. Geology, Ecology & Landscapes, 3(1), 1–13. doi:10.1080/24749508.2018.1481633
- Pedrero, F., Allende, A., Gil, M. I., & Alarcón, J. J. (2012). Soil chemical properties, leaf mineral status, and crop production in a lemon tree orchard irrigated with two types of wastewater. Agricultural Water Management, 109, 54–60. doi:10.1016/j.agwat.2012.02.006
- Pereira, B. F. F., He, Z. L., Silva, M. S., Herpin, U., Nogueira, S. F., Montes, C. R., & Melfi, A. J. (2011). Reclaimed wastewater: Impact on soil-plant system under tropical conditions. Journal of Hazardous Materials, 192(1), 54–61. doi:10.1016/j.jhazmat.2011.04.095
- Rattan, R., Datta, S., Chhonkar, P., Suribabu, K., & Singh, A. (2005). Long-term impact of irrigation with sewage effluents on heavy metal content in soils, crops, and groundwater – A case study. Agriculture, Ecosystems and Environment, 109(3–4), 310–322. doi:10.1016/j.agee.2005.02.025
- Richards, L. A. (Ed). (1954). Diagnosis and improvement of saline and alkaline soils. Washington, DC: USDA Handbook 60 US Govt. Print. Off.
- Sdiri, W., AlSalem, H. S., Al-Goul, S. T., Binkadem, M. S., & Ben Mansour, H. (2023). Assessing the effects of treated wastewater irrigation on soil physico-chemical properties. Sustainability, 15(7), 5793. doi:10.3390/su15075793
- Sdiri, W., Dabbou, S., Chehab, H., Selvaggini, R., Servili, M., Di Bella, G., & Ben Mansour, H. (2020). Quality characteristics and chemical evaluation of chemlali olive oil produced under dairy wastewater irrigation. Agricultural Water Management, 236, 106124. doi:10.1016/j.agwat.2020.106124
- Siahaan, M. T. A., Ambariyanto, A., & Yulianto, B. (2013). Pengaruh pemberian timbal (Pb) dengan konsentrasi berbeda terhadap klorofil, kandungan timbal pada akar dan daun, serta struktur histologi jaringan akar anakan mangrove Rhizophora sp. mucronata. Journal of Marine Research, 2(2), 111–119. [In Indonesian] https://media.neliti.com/media/publications/135183-ID-pengaruh-pemberian-timbal-pb-dengan-kons.pdf
- Singh, A., Sharma, R. K., Agrawal, M., & Marshall, F. (2009). Effects of wastewater irrigation on physicochemical properties of soils and availability of heavy metals in soil and vegetables. Communications in Soil Science & Plant Analysis, 40(21–22), 3469–3490. doi:10.1080/00103620903327543
- Soda, N., Ephrath, J. E., Dag, A., Beiersdorf, I., Presnov, E., Yermiyahu, U., & Ben-Gal, A. (2017). Root growth dynamics of olive (Olea europaea L.) affected by irrigation induced salinity. Plant and Soil, 411(1–2), 305–318. https://www.jstor.org/stable/44244698
- Uehara, G., & Gillman, G. (1981). The mineralogy, chemistry, and physics of tropical soils with variable charge clays. Boulder, Colorado: West Press.
- Urbano, V. R., Mendonça, T. G., Bastos, R. G., & Souza, C. F. (2017). Effects of treated wastewater irrigation on soil properties and lettuce yield. Agricultural Water Management, 181(2), 108–115. doi:10.1016/j.agwat.2016.12.001
- Wang, Z., Chang, C., Wu, L., & Crowley, D. (2003). Assessing the soil quality of long-term reclaimed wastewater-irrigated cropland. Geoderma, 114(3), 261–278. doi:10.1016/S0016-7061(03)00044-2
- Wang, X., Sato, T., Xing, B., & Tao, S. (2005). Health risks of heavy metals to the general public in Tianjin, China, via consumption of vegetables and fish. Science of the Total Environment, 350(1–3), 28–37. doi:10.1016/j.scitotenv.2004.09.044
- WHO (World Health Organization). (1993). Evaluation of certain food additives and contaminants: 41st WHO technical report series 837. Joint FAO/WHO Expert Committee on Food Additives (Food and Agriculture Organization, World Health Organization). Retrieved from https://iris.who.int/bitstream/handle/10665/36981/WHO_TRS_837.pdf
- WHO (World Health Organization). (1996). Trace elements in human nutrition and health. Geneva, Switzerland: World Health Organization.
- WHO (World Health Organization). (2006). Guidelines for the safe use of wastewater, excreta and greywater. In A. Prüss-Üstün, R. Bos, F. Gore, & J. Bartram (Eds.), Wastewater use in agriculture (Vol. II, pp. 101–187). Geneva, Switzerland: World Health Organization.
- Wilcox, L. V. (1948). The quality of water for irrigation use. Bulletin of the US Department of Agriculture, 962, 1–40.