
ABSTRACT
High-fat diet (HFD)-induced obesity is associated with increased cancer risk. Long-term feeding with HFD increases the concentration of the saturated fatty acid palmitic acid (PA) in the hypothalamus. We previously showed that, in hypothalamic neuronal cells, exposure to PA inhibits the autophagic flux, which is the whole autophagic process from the synthesis of the autophagosomes, up to their lysosomal fusion and degradation. However, the mechanism by which PA impairs autophagy in hypothalamic neurons remains unknown. Here, we show that PA-mediated reduction of the autophagic flux is not caused by lysosomal dysfunction, as PA treatment does not impair lysosomal pH or the activity of cathepsin B.Instead, PA dysregulates autophagy by reducing autophagosome-lysosome fusion, which correlates with the swelling of endolysosomal compartments that show areduction in their dynamics. Finally, because lysosomes undergo constant dynamic regulation by the small Rab7 GTPase, we investigated the effect of PA treatment on its activity. Interestingly, we found PA treatment altered the activity of Rab7. Altogether, these results unveil the cellular process by which PA exposure impairs the autophagic flux. As impaired autophagy in hypothalamic neurons promotes obesity, and balanced autophagy is required to inhibit malignant transformation, this could affect tumor initiation, progression, and/or response to therapy of obesity-related cancers.
Introduction
Obesity causes approximately 3.4 million annual deaths and ranks as the fifth cause of death worldwide.Citation1 Obesity has been associated with several comorbidities such as cancer, type 2 diabetes, cardiovascular disease, hypertension and osteoarthritis, among others.Citation1,Citation2 A major factor promoting the obesity epidemic is the consumption of the so-called western-style high-fat diet (HFD), which is rich in saturated fatty acids (SatFAs). Palmitic acid (PA), one of the most concentrated SatFA contained in HFD, is significantly increased in the plasma of obese peopleCitation3 and previous studies from our and other groups indicate PA accumulates in the brain of male mice following chronic HFD exposure, specifically in the hypothalamus, a brain region with a key role in the regulation of energy balance, food intake, insulin sensitivity and glucose homeostasis.Citation4–Citation7 Interestingly, previous research shows PA, and not other fatty acids, increases the risk of developing obesity-associated cancers (i.e. pancreatic, prostate, and breast cancer).Citation8–Citation10 Indeed, PA serves as energy sources for cancer growth, significantly promoting cancer cell invasiveness and metastatic potentialCitation11-Citation13 and, consistently, increased levels of PA have been observed in the plasma of cancer patients.Citation14
Autophagy is a lysosomal-dependent degradation process required for the maintenance of cellular and tissue homeostasis. Even if different types of autophagy exist (i.e. microautophagy, macroautophagy and chaperone-mediated autophagy), depending on the pathway of cargo delivery to lysosomes,Citation15 this study only focuses on macroautophagy, hereafter referred to as autophagy. Autophagy derangement leads to different diseases such as metabolic, neurodegenerative and cardiovascular diseases as well as to cancer development, with different outcomes depending on type and cancer stage.Citation16 During autophagy, portions of the cytoplasm (proteins, organelles and lipid droplets, among others) are enclosed in a double membrane structure called autophagosome. The formation of the autophagosome begins with the activation of the unc-51-like kinase 1 (ULK1) complex, which, once activated, will translocate to membranous sites where the autophagosome will generate thanks to the activity of different ATG (AuTophaGy-related) proteins.Citation17 Once autophagosomes are formed they undergo a maturation process consisting of multiple fusion events with different types of vesicles. Autophagosomes can fuse with endosomes, to form amphisomes (which then will fuse with lysosomes), or they can directly fuse with lysosomes to form functional autolysosomes.Citation18–Citation20 An efficient autolysosome formation requires highly dynamic lysosomes that move from a more immobile perinuclear pool, where most acidic lysosomes are mainly concentrated, to a highly dynamic pool in the cell periphery, where less acidic lysosomes are mainly concentrated.Citation21 To achieve this, lysosomes undergo constant dynamic regulation by the small late endosome-/lysosome-associated Rab7 GTPase, which cycles between an active GTP-bound state into an inactive GDP-bound state upon GTP hydrolysis. This GTPase recruits motor proteins and tethering factors to target membranes and regulates the movement, the fusion and the maturation of autophagosomes with endolysosomal membranes.Citation22–Citation24 Upon fusion of lysosomes with autophagosomes the process of autophagosomal cargo degradation begins, thanks to the activity of lysosomal enzymes,Citation7,Citation25 and the degraded autolysosome content is released back to the cytosol for being reused.Citation26 The whole process from the synthesis of the autophagosomes, up to their lysosomal degradation is defined as autophagic flux,Citation27 and its inhibition indicates a lack in autophagic cargo degradation.
We and others have shown chronic HFD consumption dysregulates autophagy in different tissues including liver, pancreas, adipose tissue and hypothalamus.Citation28–Citation32 Inhibition of autophagy in hypothalamic anorexigenic proopiomelanocortin (POMC) neurons increases food intake, promoting obesity, type II diabetes and reduced glucose tolerance.Citation32,Citation33 Importantly, we demonstrated exposure to a concentration of PA similar to the one identified in the brain of mice chronically fed with an HFD inhibits the autophagic flux in hypothalamic neuronal cells (N43/5 cells, a model of POMC neurons),Citation34 however, the mechanism by which this occurs is still largely unknown.
Here, we confirm that exposure to the SatFA PA inhibits the autophagic flux in hypothalamic neurons. Furthermore, we demonstrate that autophagy impairment is not the result of the reduction in lysosomal activity but it occurs by an alteration in endolysosomal dynamics that correlates with an increase in the activity of the Rab7 GTPase. Altogether, these results suggest that an increase in endolysosomal dynamics should be considered as a strategy to recover the impairment in autophagy caused by PA overload in hypothalamic neurons, thus reducing the risk of obesity and therefore the incidence of obesity-associated cancers.
Results
Palmitic acid inhibits the autophagic flux in hypothalamic neuronal cells
Considering that PA is significantly increased in the brain of mice chronically fed with an HFD,Citation4,Citation5,,Citation35 we determined the effect of this SatFA on autophagic flux in the N43/5 hypothalamic neuronal cell lineCitation34 and we showed that exposure to PA inhibits the autophagic flux. Here, we validated this result in primary hypothalamic neurons, where we confirmed PA treatment increases the number of autophagic structures (Figure S1A, B), as well as the amount of SQSTM1 positive dots (Figure S1A, C), an autophagy receptor whose increase indicates autophagy inhibition. Treatment with BafA1, which targets the vacuolar-type H+-ATPase preventing lysosomal acidification,Citation36 does not increase the amount of autophagic dots promoted by PA treatment, confirming that, also in primary hypothalamic neurons, PA inhibits the autophagic flux (Figure S1A-C). Importantly, as indicated in Figure S1D-G, the effect of PA on autophagy in hypothalamic neuronal cells is not specific for PA as treatment with the saturated fatty acid stearic acid (SA), similarly to PA, inhibits the autophagic flux following 1 and 6 hours of treatment, as indicated by LC3I →LC3II conversion and by the increase in SQSTM1 protein levels (Figure S1D-G).
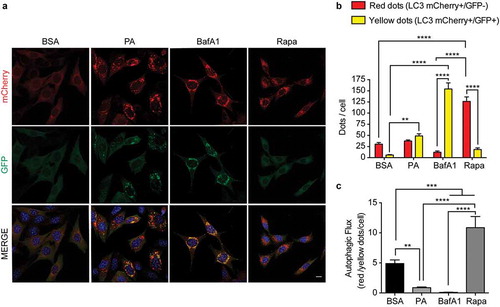
Thus, to start elucidating how PA impairs autophagy, specifically to evaluate autophagosome maturation, we generated N43/5 cells expressing the dynamic autophagic flux sensor consisting of a tandem fluorescence construct of mCherry coupled to GFP-LC3.Citation37,Citation38 The GFP fluorescence of this construct is inactivated in acidic compartments, such as lysosomes,Citation39 whereas mCherry maintains its fluorescence in the acidic environment of the autolysosome.Citation37 To ensure the correct interpretation of the results, we used BafA1 and the MTORC1 inhibitor rapamycin, to block and induce the autophagic flux, respectively.39Citation39 As expected, rapamycin increased the number of acidic autolysosomes (LC3 red dots; mCherry+/GFP-) compared to control treatment (, B), indicating the autophagic flux is enhanced (). Conversely, BafA1 treatment only increased the number of immature autophagic structures (LC3 yellow puncta; mCherry+/GFP+), indicating that acidic autolysosomes cannot form, confirming that BafA1 treatment blocks the autophagic flux (-C). Compared to control (BSA), cells exposed to PA show a significantly higher number of immature autophagic structures (LC3 yellow dots; mCherry+/GFP+), while the number of acidic autolysosomes (LC3 red dots; mCherry+/GFP-) is not affected. This data suggests that PA decreases the autophagic flux (-C). Based on this data we can suggest this could be the result of impaired autophagosome maturation into functional acidified autolysosomes. Interestingly, PA exposure also decreases the expression level of the anorexigenic propeptide Pomc (Figure S1H). Altogether, these data show PA impairs the autophagic flux and decreases Pomc levels in hypothalamic neurons.
Figure 1. Palmitic acid reduces the autophagic flux in N43/5 cells. (A) Representatives images of N43/5 cells expressing the tandem fluorescent-tagged LC3 (mCherry-GFP-LC3), treated with BSA, PA (100 μM) or BafA1 (100 nM) for 6 h, or with Rapamycin (Rapa) 1 µM for 3 h. Scale bar: 10 μm. Nuclei were stained with DAPI (blue). (B) Quantification of LC3 dots per cell. Red bars represent the number of mCherry positive dots (autolysosomes; mCherry+/GFP-) and yellow bars the number of mCherry and GFP dots that colocalize (immature autophagosomes; mCherry+/GFP+). (C) Autophagic flux was determined by quantifying the ratio between red and yellow-positive puncta per cell. Data are presented as mean ± SEM, **p < .01,***p < .001, ****p < .0001. n = 3.
Palmitic acid induces lysosomal swelling and reduces autophagosome-lysosome fusion in N43/5 cells
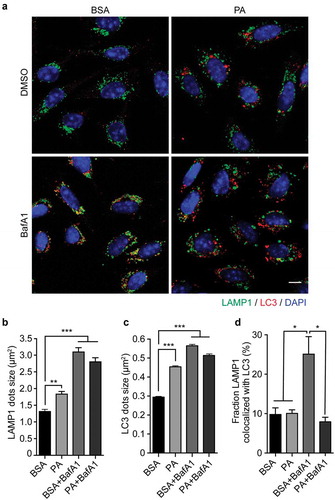
To elucidate the mechanism by which PA reduces the autophagic flux, we evaluated if the process of autophagosome-lysosome fusion was affected by examining the co-localization between autophagosomes (measured by staining for LC3) and lysosomes (measured by staining for LAMP1).Citation38 As seen in , B, in control cells (BSA) lysosomes show the classic punctate appearance, whereas following PA and BafA1 exposure, as well as following PA and BafA1 co-treatment, they appear circular and large, a morphology defined as “lysosome swelling”,Citation40 which is usually associated with altered lysosomal activity,Citation41,Citation42 and with autophagic flux inhibition.Citation29 Additionally, cells were stained against LC3, and we observe PA and BafA1 treatment increases LC3 dots size compared to control (, C). The increase in vesicle size has been confirmed also by the analysis of LC3 yellow and red dots in N43/5 cells expressing the mCherry-GFP-LC3 construct (Figure S2), where we can observe that red and yellow dot size (autolysosomes and autophagosomes, respectively) are the biggest in PA-treated cells. Conversely to PA and BafA1, rapamycin only increases LC3 red dots size (Figure S2), suggesting only autophagic flux inhibitors, at least the ones that we analyzed here, increase autolysosomes size in our model. Additionally, when we compare the effect of BafA1 and PA, which both induce lysosomal swelling () and inhibit the autophagic flux (), we observe that the percentage of colocalization between LAMP1 and LC3 is significantly higher following BafA1 exposure (Mander’s coefficient: 0.25) than following PA treatment (Mander’s coefficient: 0.1) (, D). Consistently, while the colocalization between LAMP1 and LC3 is observed in cells exposed to BafA1, co-incubating cells with PA and BafA1 reduces the co-localization between both markers (, D), suggesting PA affects the fusion between autophagic structures and lysosomes.
Figure 2. Palmitic acid induces lysosomal swelling and reduces autophagosome-lysosome fusion in N43/5 cells. (A) Representative images of N43/5 cells treated with BSA or PA (100 μM) for 6 h in presence or absence of BafA1 (100 nM) or its vehicle (DMSO) and stained against LAMP1 and LC3. LAMP1 (B) and LC3 (C) average dots size. (D) % of co-localization between LAMP1 and LC3 according to Manders’ Coefficient Analysis. Scale bar: 10 μm. Data are presented as mean ± SEM, *p < .05, **p < .01, ***p < .001. n = 3.
Palmitic acid does not reduce lysosomal acidity or lysosomal activity in N43/5 cells
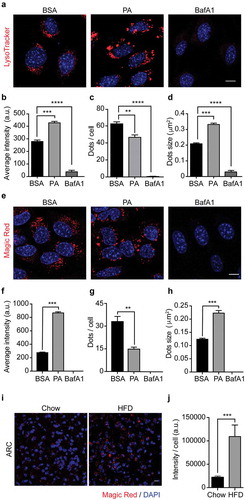
Our results show that PA induces lysosomal swelling after 6 hours of treatment in N43/5 cells (, B). Thus, we evaluated if PA treatment also affects lysosomal activity, as assessed by measuring lysosomal acidity and by evaluating the activity of lysosomal enzymes. We first assessed if PA affects the range of lysosomal pH, using the pH-sensitive lysosomal dye LysoTracker Red, which accumulates and emits red fluorescence in acidic compartments with pH <6.5.Citation43 Then, we measured cathepsin B activity using the Magic Red assay in vitro in N43/5 cells and in vivo in the arcuate nucleus of the hypothalamus of mice fed for 16 weeks with an HFD,Citation44 hypothalamic region where POMC neurons localize. As shown in , experiments performed in N43/5 cells indicate PA does not decrease LysoTracker (, B) or Magic Red fluorescence intensity (, F), and instead, it promotes the formation of larger puncta, compared to controls (, H). Additionally, in accordance with the data showing the increased size of LAMP1 positive vesicles (), PA treatment increases the size and reduces the number of endo-lysosomal acidic compartments (, D, G, H). This effect is not specific to PA as treatment with SA also increases Magic Red fluorescence intensity and promotes the formation of larger puncta, compared to controls (Figure S3A-D). Interestingly, the number of Magic Red positive dots/cell is reduced following PA and SA treatment compared to control ( and ). In contrast to the effects of PA, BafA1, as expected, increases endolysosomal pH and impairs cathepsin B activity, as shown by the reduced fluorescence of LysoTracker and Magic Red dye, respectively (, B, E, F). These data indicate that PA induces the accumulation of enlarged endolysosomal structures without reducing their acidity or hydrolytic activity. Importantly, we confirmed in vivo, in the arcuate nucleus of the hypothalamus, that consumption of HFD for 16 weeks, which increases body weight (Figure S3E) and promotes accumulation of PA in the hypothalamus,Citation4,Citation5 also increases the intensity of Magic Red staining, indicating HFD consumption does not impair cathepsin B activity in this brain region (, J).
Figure 3. Palmitic acid does not reduce lysosomes acidity or lysosomal cathepsin B activity. (A) Representative confocal images of N43/5 cells treated with BSA, PA (100 μM), or BafA1 (100 nM) for 6 h and stained with LysoTracker. Nuclei were stained with DAPI (blue). Quantification of LysoTracker average fluorescence intensity in arbitrary units (a.u.), LysoTracker positive dots per cell and dots size are shown in (B), (C), (D), respectively. Scale bar: 10 μm. (E) Representative confocal images of N43/5 cells treated with BSA, PA (100 μM), or BafA1 (100 nM) for 6 h and stained with Magic Red, with its respective quantification of average fluorescence intensity in arbitrary units (a.u.) (F), number of positive dots per cell (G), and dots size (H). Nuclei were stained with Hoechst (blue). Scale bar: 10 μm. (I) Representative confocal images of the hypothalamic arcuate nucleus (ARC) from chow and HFD mice stained with Magic Red, with its respective quantification, in arbitrary units (a.u.) (J). Nuclei were stained with DAPI (blue). Scale bar: 10 μm. Data are presented as mean ± SEM, **p < .01, ***p < .001, ****p < .0001. n = 3.
Palmitic acid induces the accumulation of large cellular degradative compartments in N43/5 cells
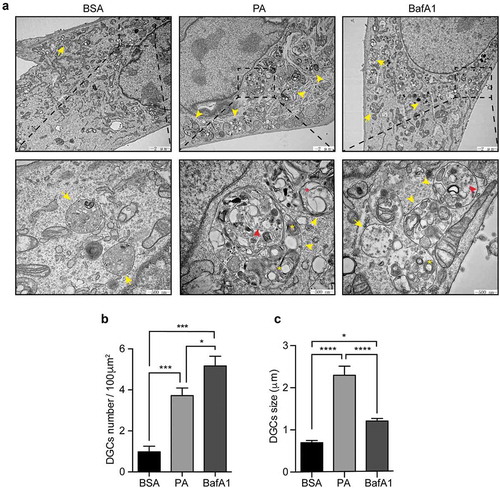
Our results show that PA treatment enhances the size of autophagic structures as well as of endolysosomal membranes (, C). To gain further insights on the nature of these structures, we performed an electron microscopy (EM) analysis, which is considered as a gold standard to recognize autophagic vesicles,Citation38 to evaluate the morphology of cytosolic structures of N43/5 cells treated with PA. EM images show that, in control cells, we found vesicular structures surrounded by a single membrane, filled with intraluminal vesicles, which are characteristic of multivesicular bodies. Both PA and BafA1 treatment increase the number of large single-membrane vesicles with an intra-luminal heterogeneous content (, B, C), which, in agreement with the nomenclature used by Mauthe M. et al., we defined as “cellular degradative compartments (DGCs)”.Citation45 As indicated by the arrowheads, in the cargo of DGCs we can identify multilamellar bodies, composed of concentric membrane layers, intraluminal vesicles and vesicular structures surrounded by multiple membranes (), which is indicative of partially degraded cargo and which correlates with the observed impairment in the autophagic flux (). To note, DGCs size of PA-treated cells is significantly higher than BafA1 treated cells (). These data show that the inhibition in the autophagic flux, caused by PA treatment increases the number and the size of single-membrane DGCs with an intra-luminal heterogeneous content.
Figure 4. Palmitic acid induces the accumulation of large cellular degradative compartments (DGCs) in N43/5 cells. (A) Representative electronic microscopy images of N43/5 cells treated with BSA, PA (100 μM) or BafA1 for 6 h. Cellular degradative compartments (DGCs) are indicated by yellow arrowheads, yellow asterisks denote multilamellar bodies, red arrowheads show intraluminal vesicles, red asterisk indicates intraluminal vesicles surrounded by multiple membranes, yellow arrows denote multivesicular bodies. Inserts show a magnification of structures within the dashed square. DGCs number and size are shown in (B) and (C), respectively. Data are presented as mean ± SEM, *p < .05, ***p < .001, ****p < .0001. n = 3.
PA reduces the dynamics of endolysosomal structures and induces Rab7 hyper-activation in N43/5 cells
Previous studies have shown that an altered endolysosomal dynamics contributes to autophagic defects.Citation46,Citation47 Thus, we evaluated by live-cell imaging if PA affects the dynamics of endolysosomal structures in N43/5 cells (Videos S1 and S2). Our data show that exposure to PA significantly decreases the velocity (, B) and the traveled distance () of large LysoTracker vesicles, indicating PA reduces the trafficking of endolysosomal vesicles.
Figure 5. Palmitic acid reduces endolysosomal motility and increases Rab7 activation in N43/5 cells. (A) Representative images and zoomed-in time-lapse confocal sequence images of N43/5 cells treated with BSA or PA (100 μM) for 6 h and stained with LysoTracker. Zoom-ed in inserts represent one cell magnification within the dashed square, showing the dynamic movement of LysoTracker positive vesicles. Arrowhead indicates one LysoTracker positive vesicle movement over time. Scale bar: 10 μm. Average velocity (µm/s) and average total displacement (µm) of positive LysoTracker vesicles are shown in (B) and (C), respectively. Scale bar: 10 μm. (D) Representative confocal images of N43/5 cells treated with BSA or PA (100 μM) for 6 h and then stained against Rab7. Inserts show a magnification of structures within the dashed square. Arrowheads indicate enlarged Rab7 positive vesicles. Quantification of Rab7 positive structures size is shown in (E). Scale bar: 10 μm in the original image and in the zoomed-in images. (F) Representative blot showing Rab7 protein bound to GTP and Rab7 total protein levels with its respective quantification (G) in N43/5 cells following 6 h of the aforementioned treatments. *p < .05, **p < .01, ***p < .001. Data are presented as mean ± SEM. n = 3.
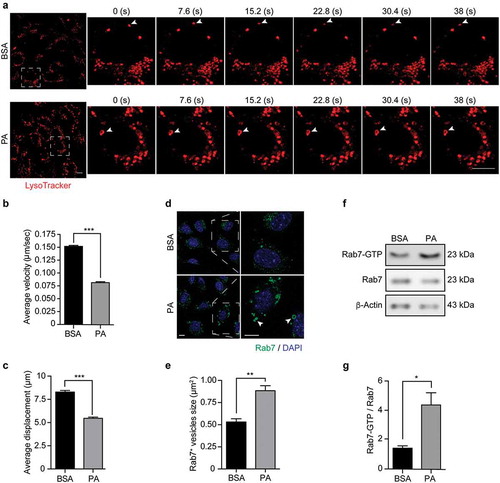
In agreement with this, and with the hypothesis that the formation of big DGCs caused by PA exposure could be due to impaired endolysosomal dynamics; we evaluated the activation state of the small GTPase Rab7 following PA exposure. First, we examined by immunofluorescence whether PA alters the morphology of Rab7, and, as shown in , we observe that after 6 hours of treatment, PA induces the formation of enlarged Rab7 positive structures (, E), which have been associated with Rab7 hyper-activation.Citation48 Next, using a pull-down assay, we evaluated the activation state of Rab7, and in agreement with the previous results, PA increases the protein levels of Rab7-GTP compared to control conditions (, G), indicating PA increases Rab7 activation state. Altogether, these results indicate PA reduces the dynamics of endolysosomal structures and induces Rab7 hyper-activation, which could impair the later phases of the autophagic process thus reducing the autophagic flux.
Discussion
Here, we demonstrate that exposure to the SatFA PA inhibits the autophagic flux in hypothalamic neurons (, S1) and reduces the maturation of autophagic structures (, D). Furthermore, we show that PA exposure induces lysosomal swelling (), without affecting the pH or impairing the activity of cathepsin B, a lysosomal enzyme, in N43/5 cells in vitro (-H). Consistently, we do not see a reduction in the activity of cathepsin B in the arcuate nucleus of the hypothalamus in mice chronically fed with an HFD (, J). Interestingly, we see PA promotes the formation and accumulation of large DGCs filled with partially degraded cargo in hypothalamic neuronal cells (). Lastly, our data indicate that PA reduces intracellular endolysosomal dynamics, which correlates with increased Rab7 activation in hypothalamic neuronal cells ().
Diet influences whole body and cell metabolism, finally affecting cancer cell survival and proliferation.Citation49 Among different dietary patterns, consumption of pro-obesogenic HFDs, diets composed of at least 30% of the calories derived from lipids,Citation50 is associated with increased cancer risk and with a higher risk of developing metastasis in different tumors.Citation51 Indeed, uptake of dietary fatty acids from HFD, mainly PA, the most abundant SatFA in our body and in HFD,Citation13 can be utilized by transformed cells to impede their eliminationCitation52,Citation53 and to facilitate cancer metastasis.Citation11,Citation54 Among the different effects of HFD, its chronic consumption increases the levels of the long-chain SatFA PA in the hypothalamus.Citation5 Here, in agreement with our previous study,Citation34 we show PA overload reduces the autophagic flux. A similar effect of PA on autophagy has been shown on astrocytes, hepatocytes and kidney proximal tubular cells,Citation55–Citation57 while PA has been reported to induce autophagy in cancer cell lines and cardiomyocytes,Citation58,Citation59 indicating its effects on autophagy are cell type-dependent. Interestingly, we also show PA exposure affects hypothalamic neuronal function, as indicated by the decrease in the production of Pomc (Figure S1 H), as well as the reduction in insulin sensitivity.Citation34 N43/5 cells are a model of POMC anorexigenic neurons, they produce the pro-peptide POMC, which, once processed, generates different peptides, such as ɑ-MSH, involved in the regulation of energy balance.Citation60 Our results showing PA reduces Pomc levels could suggest that, in an in vivo setting, PA might promote food intake and therefore obesity, predisposing to cancer development. Consistently, previous studies indicate autophagy modulates the levels of neuropeptides (i.e POMC, neuropeptide Y) and the secretion of proteins such as acyl-CoA-binding protein, that play a role in the regulation of food intake and in the onset of obesity-associated metabolic disorders.Citation61–Citation63 Indeed, inhibition of autophagy in POMC neurons promotes obesity, and obesity-associated diseases.Citation32,Citation33 Importantly, our previous research indicates that PA, in addition to inhibiting autophagy, induces inflammation in hypothalamic neurons, impairing their function.Citation35 Previous research shows neuronal inflammation could impair the hypothalamic-pituitary-adrenal axis, thus contributing to the development of some types of cancers, such as breast cancer,Citation64 as well as to the development and maintenance of anorexia and cachexia in cancer.Citation65 As inhibition of autophagy promotes the release of proteins through the secretory autophagy,Citation62 such as pro-inflammatory cytokines, it would be interesting, in future experiments, to evaluate if PA-mediated inhibition of conventional autophagy boosts secretory autophagy promoting the release of pro-inflammatory cytokines (i.e IL6) or other proteins leading to obesity and/or cancer development.
In a physiological setting, basal autophagy plays a key role in the maintenance of cellular homeostasis, by removing and recycling damaged, old and potentially toxic cytosolic components. Thus, autophagy functions as an intracellular quality control system and, as such, represents a barrier against malignant transformation.Citation66–Citation68 Consistently, autophagy impairment, such as following PA exposure, favors malignant transformation in different models and by multiple mechanisms.Citation67 Here, we further evaluated how PA impairs autophagy, to identify possible pharmacological targets that could revert the process. PA could inhibit autophagic flux by impairing the fusion of autophagic vacuoles with the lytic compartments, or by reducing the proteolytic activity of lysosomal hydrolases. Our results show that autophago-lysosomal fusion is reduced in PA-treated cells, as indicated by LAMP1 and LC3 colocalization, which could explain the inhibition of the autophagic flux (). Importantly, we also observed a significant increase in the size of LAMP1 positive structures in PA-treated cells, a phenotype that has been associated with decreased autophago-lysosomal fusion,Citation45 and which has previously been observed during oncogenic transformation.Citation69 Accordingly to the hypothesis that PA reduces the autophagic flux by impairing endolysosomal dynamics, our results show that PA, conversely to BafA1, does not compromise the acidity or the hydrolytic activity of endolysosomal structures (). Indeed, our data show an increase in the fluorescence intensity of both LysoTracker and Magic Red positive vesicles in PA-treated cells, compared to control (, B, E, F). In this context, Schulze et al. also observed the formation of large intracellular vacuoles with increased LysoTracker staining in podocytes when the PIKfyve complex is defective.Citation70 PIKfyve is involved in the production of the lipid phosphatidylinositol 3,5-bisphosphate (PI(3,5)P2), which levels are carefully controlled to maintain the turnover of vacuolar membranes to less mature endocytic compartments, hence, regulating organelle’s size.Citation71 PIKfyve complex deficiency or dysregulation of one of its components leads to the development or large intracellular vacuoles.Citation72 Thus, it is possible that PA is affecting the levels of one or more proteins involved in the formation of PIKfyve complex thus regulating vacuoles size, a hypothesis that deserves future investigation.
Furthermore, we determined that LC3 positive structure and endolysosomal membranes of PA-treated cells are enlarged (, C), and we observed by electron microscopy that PA promotes the accumulation of large DGCs (). Due to the result indicating that following PA treatment LAMP1 and LC3 do not colocalize (), we suggest these structures are not autolysosomes; however, future studies are required to characterize these vesicles.
Additionally, our data show that exposure to PA decreases endolysosomal movement, specifically of large endolysosomal structures (, B). The reduction in intracellular trafficking is accompanied by an increase in the activation state of the small GTPase Rab7 in PA-treated cells (, G). Rab7 on late endosomes/lysosomes recruits tethering factors, as pleckstrin homology and RUN domain containing M1 (PLEKHM1), and homotypic fusion and protein sorting complex (HOPS), to promote the assembly of trans-SNARE complexes for the fusion of autophagosomes and lysosomes.Citation73,Citation74 Rab7 controls the trafficking of cargos along microtubules, thus regulating the final step of autophagosome fusion with lysosomes and/or endosomes.Citation75,Citation73 Interestingly, it has been shown that Rab7 hyper-activation inhibits autophagic lysosomal reformation, leading to the accumulation of enlarged autolysosomesCitation76 and swelling of endolysosomal structures, containing aberrant intraluminal content, which correlates with our observed phenotype (). Thus, our data suggest PA inhibits the autophagic flux inducing the accumulation of large DGCs by affecting intracellular endolysosomal dynamics and Rab7 activity in N43/5 cells. Future research should confirm the causal role of Rab7 in PA-mediated autophagy inhibition and evaluate if PA, in addition to Rab7, affects other proteins involved in autophagosome-lysosome fusion, such as membrane-tethering complexes and soluble N-ethylmaleimide-sensitive factor attachment protein receptors (SNAREs).
In summary, our findings provide strong support for a model in which PA inhibits the autophagic flux by reducing autophagosome-lysosome fusion. Our results suggest this could be due to altered endolysosomal dynamics caused by the formation of large DGCs and is associated with an increase in the activity of the small Rab7 GTPase. PA-mediated autophagy impairment in hypothalamic neurons affects neuronal function and promotes inflammation, which alters the levels of neuropeptides that regulate food intake, increasing feeding and promoting obesity, thus contributing to tumor initiation, progression, and response to therapy. Despite the obstacles that have been encountered for the implementation of autophagy modulators in the clinic,Citation77 understanding the process by which PA impairs autophagy in hypothalamic neurons will help to obtain clinically relevant interventions for the treatment of obesity and obesity-related cancers.
Material and methods
Hypothalamic cell line N43/5 and treatments
N43/5 cells (Cellutions Biosystems) were cultured in Dulbecco’s modified eagle medium (DMEM) high glucose (11995–040, Gibco, USA) supplemented with 10% of fetal bovine serum (FBS) (10437028, Gibco), 100 U/ml penicillin streptomycin (15140122, Gibco) and maintained at 37°C with 5% CO2, as previously described.Citation78,Citation35 To evaluate the changes in the autophagic flux in response to PA, cells were incubated with DMEM high glucose supplemented with 2% of FBS 24 h before treatments and then exposed to 100 μM PA (P0500, Sigma-Aldrich, St. Louis, MO, USA) conjugated to fatty acid-free (FFA) bovine serum albumin (BSA) (A8806-5 G, Sigma-Aldrich). BSA treatment was used as control.
Preparation of palmitic acid-BSA complex
Palmitic acid was conjugated to FFA-BSA (BSA) as previously described.Citation36 A stock solution of 5 mM of PA-BSA was prepared. BSA (0.45 g) was dissolved in 0.9% NaCl (7.5 ml), adjusted to pH 7.4. PA (22.43 mg) was dissolved in 100% ethanol, and then titrated with 1 M NaOH to pH 10. Next, ethanol was evaporated in Speed-e-Vac, and the precipitate was dissolved in 0.9% NaCl (4.5 ml) in a thermoblock at 95°C for 15 min. Then, the BSA solution was added to the PA solution, and the final volume was adjusted to 15 ml with 0.9% NaCl. Finally, the PA-BSA solution was passed through a 0.45 µm syringe filter aliquoted and stored at −20°C. The PA-BSA complex was used at a final concentration of 100 µM.
Methods to evaluate autophagy and the autophagic flux
Autophagic flux was evaluated by immunofluorescence, by using the mCherry-GFP-LC3-N43/5 cell line (cell line which expresses the tandem fluorescent-tagged LC3 (mCherry-GFP-LC3)), which allows monitoring autophagosomes and autolysosomes formation based on the different pH stability of GFP and mCherry fluorescent proteins.Citation37,Citation38 As positive control for autophagy induction, we exposed cells for 3 h to 1 µM rapamycin (R0395, Sigma-Aldrich), an MTORC1 inhibitor.Citation39 Fusion between autophagosomes and lysosomes was quantified by co-immunolocalization of the microtubule-associated protein 1A/1B-light chain 3 (LC3) and the lysosomal marker lysosomal-associated membrane protein 1 (LAMP1).Citation38 Cells were incubated at the time points indicated in each experiment with the autophagic flux inhibitor Bafilomycin A1 (BafA1, 100 nM) (B1793, Sigma-Aldrich) or with its vehicle DMSO (BM-0660, Winkler).
Immunofluorescence and fluorescence microscopy
For fluorescence microscopy determinations in N43/5 cells, cells cultured on coverslips, were fixed with cold methanol (−20°C) for 10 min or with 4% (w:v) paraformaldehyde (PFA) for 20 min at room temperature. After PFA fixation, cells were permeabilized with triton 0.1% for 20 min at room temperature. Then, cells were blocked in 3% BSA in PBS for 1 h and incubated with the primary antibodies overnight at 4°C. The primary antibodies used were LAMP1 (1:500; 553792, BD Pharmingen, USA), LC3A/B (1:250; Cell Signaling Technology), p62/Sequestosome-1 (SQSTM1) (1:300; Abnova), and Rab7 (1:100; sc-376362, Santa Cruz Biotechnology, Inc.). Primary antibodies staining was followed by incubation with its respective secondary antibody (1:300; Alexa Fluor®, Life Technologies) for 1 h at room temperature. Nuclei were counterstained with DAPI (Vector Laboratories Inc., CA, USA). Confocal images were captured using an inverted fluorescence microscope Leica DMI600 or with an inverted confocal microscope LSM 880 Zeiss with Airyscan detection (Unidad de Microscopía Avanzada UC (UMA UC)). Images were quantified using ImageJ software (NIH, Bethesda, MD), and by using the Spot Detector plugin within the open-source software, ICY (Institut Pasteur and France BioImaging). Co-localization, fluorescence intensity analysis, and size measurement of LAMP1 and LC3 dots were made accordingly to Bustamante et al.Citation79
Methods to evaluate lysosomal activity
To determine lysosomal function the following experiments were performed:
Analysis of lysosomal acidity
We evaluated, by confocal microscopy, the alteration of the pH of lysosomes of cells treated with PA, using 100 nM LysoTracker Red DND-99 probe (L7528, Invitrogen). This dye accumulates and, when excited at 577 nm, emits fluorescence in acidic compartments with a pH <6.5.Citation80 Cells were incubated with this probe for the last 45 min of treatments, and then washed twice with PBS. Following, cells were fixed with 4% (w:v) PFA for 20 min at room temperature and nuclei were counterstained with DAPI. Images were taken using an inverted fluorescence microscope Leica DMI600, and quantified using ImageJ software.
Lysosomal enzyme activity
We measured using the Magic Red kit (Immunochemistry Technologies, LLC) the activity of cathepsin B, a lysosomal member of the papain-like family of cysteine proteases, as indicated by the manufacturer’s instructions. This kit uses a permeable cathepsin B substrate that, once hydrolyzed, liberates membrane-impermeable fluorescent cresyl violet within the organelles that contain a catalytically active cathepsin B.Citation40–Citation42 Briefly, for N43/5 cell line, cells were plated on glass bottom dishes, treated with PA for 6 h or BafA1 for 2 h and then loaded with Magic Red probe for 20 min in DMEM medium in humidified 5% CO2 atmosphere at 37°C. They were washed 3 times with PBS and then loaded with Hoechst, to stain the nuclei, for 10 min and finally washed 3 additional times with PBS. Cells were maintained in DMEM medium with HEPES. Experiments have been performed following manufacturer’s instructions. Images were taken in an inverted fluorescence microscope Leica DMI600 and cells analyzed using the open-source softwareICY (http://icy.bioimageanalysis.org/).
Lysosomal movement
To label and track lysosomes, N43/5 cells were incubated with 100 nM LysoTracker Red DND-99, during the latest 45 min of PA (6 h, 100 µM) or BSA treatment, and then washed twice with PBS. Then, live cells were maintained in DMEM (supplemented with 2% FBS) at 37°C and 5% CO2 and visualized in an inverted confocal microscope LSM 880 Zeiss with Airyscan detection (UMA UC). Time-lapse images were collected every 3.39 s for 90 frames. Analysis of the live-cell imaging studies including tracking, velocity and displacement was performed with the ICY software (http://icy.bioimageanalysis.org/). The pseudobinary threshold was determined with the plugin for batch analysis. Then, we configured size, detector type and dimensional parameters using the spot detector plugin. Further, we established the movement of the signals detected configuring the tracking parameters with the spot tracking plugin. Finally, we obtained the speed and displacement of each channel with the track manager using the Track Processor Instant Speed plugin.
Electron microscopy
Cells were fixed in 2.5% glutaraldehyde (16210, EMS, PA, USA) in 0.2 M phosphate buffer (PB) pH 7.4 at room temperature for 16 h. Then, cells were washed 3 times with PB and post-fixed in 1% osmium tetroxide/1% ferrocyanide for 1 h at 4°C. Subsequently, cells were double-stained with 2% uranyl acetate overnight at 4°C. After dehydration in graded series of ethanol, cells were embedded in epoxy resin 812 and sectioned using a Leica ultramicrotome (Leica Microsystems, Vienna, Austria). Images were taken using a transmission electron microscopy Hitachi H-7650 (Tokyo, Japan).
Animals and body weight
Animal care and procedures were approved by the Ethical Committee of the Pontificia Universidad Católica de Chile. Male C57BL/6 mice were housed in a temperature-controlled environment in groups of two to four at 22–24°C using a 12 h light/dark cycle. Mice were fed a standard chow (ProlabR RMH3000) or exposed to the HFD (40% kcal from fat, RD-D12079B Western Diet, Research Diet) starting at 8 weeks of age for 16 weeks. Water was provided ad libitum. Body weight was recorded once a week.
Brain slices preparation and staining
Brains were dissected from C57BL/6 mice were immediately frozen at −150°C. Frozen brains were mounted using Optimal cutting temperature compound (OCT compound) in a cryostat at −22°C; then, coronal 25-µm-thick slices of unfixed tissue were obtained. Slices containing the hypothalamic region were mounted on glass slides and incubated as previously described with Magic Red dye.Citation44,Citation81 First, slices were washed 3 times for 5 min in PBS and then incubated with Magic Red dye diluted in diH2O for 45 min at 37°C. After incubation, slices were washed three times for 5 min in PBS and mounted with fluorescent mounting media with DAPI. Images of the arcuate nucleus of the hypothalamus were acquired using the TCS SP8 laser-scanning confocal microscope (Leica Microsystems, Wetzlar, Germany).
Rab7-GTP pull-down assay
Rab7-GTP pulldown assay was performed as previously described.Citation82,Citation83 Briefly, cells were lysed in a buffer containing 25 mM HEPES (pH 7.4), 100 mM NaCl, 5 mM MgCl2, 1% NP 40, 10% glycerol, 1 mM dithiothreitol (DTT) and protease inhibitors (Pierce Complete, Mini Protease Inhibitor Cocktail). Extracts were incubated for 5 min on ice and clarified by centrifugation (10,000xg, 1 min, 4ºC). Postnuclear supernatants were used for pulldown assays with 30 μg of GSH beads precoated with GST-RILP fusion protein (Rab7GTP pulldown) per condition. Beads were incubated with supernatant for 15 min at 4ºC in a rotating shaker. Thereafter, beads were collected, washed with a lysis buffer containing 0.01% NP 40 and samples were analyzed by western blot.
Western blot analysis
Gels were transferred to nitrocellulose membranes and incubated with 5% BSA (BM-0150, Winkler, RM, Chile) – tris-buffered saline-0.1% Tween-20 (TBS-T) to block nonspecific binding. Membranes were incubated with the primary antibody anti Rab7 (1:1000; sc-376362, Santa Cruz Biotechnology, Inc.), at a dilution of 1:1000 in 5% BSA-TBS-T overnight on a rocking platform at 4ºC. Then, membranes were washed 3 times for 10 min in TBS-T and revealed with the appropriate horseradish peroxidase-labeled secondary antibody (Goat Anti-Mouse IgG (H + L)-HRP Conjugate, 1706516; Bio-Rad, CA, USA) and the chemiluminescent substrate. β-actin (1:10000; A1978, Sigma-Aldrich) was used as a loading control.
Results and statistical analysis
Results are shown as mean ± SEM from at least three independent experiments. Two groups were compared using two-tailed Student’s t tests. For more than two groups, one-way ANOVA was used followed by post hoc adjustment. All analyses were performed with GraphPad software (San Diego, CA, USA). P value of <0.05 was considered statistically significant.
Disclosure of Potential Conflicts of Interest
No potential conflicts of interest were disclosed.
Supplemental Material
Download Zip (4.7 MB)Acknowledgments
The authors acknowledge the services provided by UC CINBIOT Animal Facility funded by PIA CONICYT*ECM-07*Program for Associative Research, of the Chilean National Council for Science and Technology. This work was supported by the Unidad de Microscopía Avanzada UC (UMA UC) of the Pontificia Universidad Católica de Chile. The authors thank everyone in the Morselli lab for constructive discussions and criticisms.
Supplementary material
Supplemental data for this article can be accessed here.
Additional information
Funding
References
- Smith KB, Smith MS. Obesity Statistics. Prim Care. 2016;43(1):1–13. ix. doi:10.1016/j.pop.2015.10.001.
- Kopelman PG. Obesity as a medical problem. Nature. 2000;404(6778):635–643. doi:10.1038/35007508.
- Opie LH, Walfish PG. Plasma free fatty acid concentrations in obesity. N Engl J Med. 1963;268(14):757–760. doi:10.1056/NEJM196304042681404.
- Rodriguez-Navas C, Morselli E, Clegg DJ. Sexually dimorphic brain fatty acid composition in low and high fat diet-fed mice. Mol Metab. 2016;5(8):680–689. doi:10.1016/j.molmet.2016.06.014.
- Vagena E, Ryu JK, Baeza-Raja B, Walsh NM, Syme C, Day JP, Houslay MD, Baillie GS. A high-fat diet promotes depression-like behavior in mice by suppressing hypothalamic PKA signaling. Transl Psychiatry. 2019;9(1):141. doi:10.1038/s41398-019-0470-1.
- Valdearcos M, Robblee MM, Benjamin DI, Nomura DK, Xu AW, Koliwad SK. Microglia dictate the impact of saturated fat consumption on hypothalamic inflammation and neuronal function. Cell Rep. 2014;9(6):2124–2138. doi:10.1016/j.celrep.2014.11.018.
- Singh R, Cuervo AM. Autophagy in the cellular energetic balance. Cell Metab. 2011;13(5):495–504. doi:10.1016/j.cmet.2011.04.004.
- McWilliams RR, Maisonneuve P, Bamlet WR, Petersen GM, Li D, Risch HA, Yu H, Fontham ETH, Luckett B, Bosetti C, et al. Risk factors for early-onset and very-early-onset pancreatic adenocarcinoma: a pancreatic cancer case-control consortium (PanC4) analysis. Pancreas. 2016;45(2):311–316. doi:10.1097/MPA.0000000000000392.
- Berger NA. Young adult cancer: influence of the obesity pandemic. Obesity (Silver Spring). 2018;26(4):641–650. doi:10.1002/oby.22137.
- Koroukian SM, Dong W, Berger NA. Changes in age distribution of obesity-associated cancers. JAMA Netw Open. 2019;2(8):e199261. doi:10.1001/jamanetworkopen.2019.9261.
- Pascual G, Avgustinova A, Mejetta S, Martin M, Castellanos A, Attolini CS, Berenguer A, Prats N, Toll A, Hueto JA, et al. Targeting metastasis-initiating cells through the fatty acid receptor CD36. Nature. 2017;541(7635):41–45. doi:10.1038/nature20791.
- Pan J, Fan Z, Wang Z, Dai Q, Xiang Z, Yuan F, Yan M, Zhu Z, Liu B, Li C, et al. CD36 mediates palmitate acid-induced metastasis of gastric cancer via AKT/GSK-3beta/beta-catenin pathway. J Exp Clin Cancer Res. 2019;38(1):52. doi:10.1186/s13046-019-1049-7.
- Fatima S, Hu X, Gong RH, Huang C, Chen M, Wong HLX, Bian Z, Kwan HY. Palmitic acid is an intracellular signaling molecule involved in disease development. Cell Mol Life Sci. 2019;76(13):2547–2557. doi:10.1007/s00018-019-03092-7.
- Riccardi D, Das Neves RX, de Matos-neto EM, Camargo RG, Lima J, Radloff K, Alves MJ, Costa RGF, Tokeshi F, Otoch JP, et al. Plasma lipid profile and systemic inflammation in patients with cancer cachexia. Front Nutr. 2020;7:4. doi:10.3389/fnut.2020.00004.
- Galluzzi L, Baehrecke EH, Ballabio A, Boya P, Bravo-San Pedro JM, Cecconi F, Choi AM, Chu CT, Codogno P, Colombo MI et al. Molecular definitions of autophagy and related processes. Embo J. 2017;36(13):1811–1836. doi:10.15252/embj.201796697.
- Santana-Codina N, Mancias JD, Kimmelman AC. The role of autophagy in cancer. Annu Rev Cancer Biol. 2017;1(1):19–39. doi:10.1146/annurev-cancerbio-041816-122338.
- Yu L, Chen Y, Tooze SA. Autophagy pathway: cellular and molecular mechanisms. Autophagy. 2018;14(2):207–215. doi:10.1080/15548627.2017.1378838.
- Eskelinen EL. Maturation of autophagic vacuoles in mammalian cells. Autophagy. 2005;1(1):1–10. doi:10.4161/auto.1.1.1270.
- Lamb CA, Yoshimori T, Tooze SA. The autophagosome: origins unknown, biogenesis complex. Nat Rev Mol Cell Biol. 2013;14(12):759–774. doi:10.1038/nrm3696.
- Zhao YG, Zhang H. Autophagosome maturation: an epic journey from the ER to lysosomes. J Cell Biol. 2019;218(3):757–770. doi:10.1083/jcb.201810099.
- Cabukusta B, Neefjes J. Mechanisms of lysosomal positioning and movement. Traffic. 2018;19(10):761–769. doi:10.1111/tra.12587.
- Cabrera M, Nordmann M, Perz A, Schmedt D, Gerondopoulos A, Barr F, Piehler J, Engelbrecht-Vandre S, Ungermann C. The Mon1-Ccz1 GEF activates the Rab7 GTPase Ypt7 via a longin-fold-Rab interface and association with PI3P-positive membranes. J Cell Sci. 2014;127(5):1043–1051. doi:10.1242/jcs.140921.
- Hegedus K, Takats S, Boda A, Jipa A, Nagy P, Varga K, Kovács AL, Juhász G. The Ccz1-Mon1-Rab7 module and Rab5 control distinct steps of autophagy. Mol Biol Cell. 2016;27(20):3132–3142. doi:10.1091/mbc.e16-03-0205.
- Pankiv S, Alemu EA, Brech A, Bruun JA, Lamark T, Overvatn A, Bjørkøy G, Johansen T. FYCO1 is a Rab7 effector that binds to LC3 and PI3P to mediate microtubule plus end-directed vesicle transport. J Cell Biol. 2010;188(2):253–269. doi:10.1083/jcb.200907015.
- Yu S, Melia TJ. The coordination of membrane fission and fusion at the end of autophagosome maturation. Curr Opin Cell Biol. 2017;47:92–98. doi:10.1016/j.ceb.2017.03.010.
- Geronimo-Olvera C, Massieu L. Autophagy as a homeostatic mechanism in response to stress conditions in the central nervous system. Mol Neurobiol. 2019;56(9):6594–6608. doi:10.1007/s12035-019-1546-x.
- Lahiri V, Hawkins WD, Klionsky DJ. Watch what you (Self-) eat: autophagic mechanisms that modulate metabolism. Cell Metab. 2019;29(4):803–826. doi:10.1016/j.cmet.2019.03.003.
- Che Y, Wang ZP, Yuan Y, Zhang N, Jin YG, Wan CX, Tang Q-Z. Role of autophagy in a model of obesity: A longterm high fat diet induces cardiac dysfunction. Mol Med Rep. 2018;18(3):3251–3261. doi:10.3892/mmr.2018.9301.
- Yamamoto T, Takabatake Y, Takahashi A, Kimura T, Namba T, Matsuda J, Minami S, Kaimori J-Y, Matsui I, Matsusaka T, et al. High-fat diet-induced lysosomal dysfunction and impaired autophagic flux contribute to lipotoxicity in the kidney. J Am Soc Nephrol. 2017;28(5):1534–1551. doi:10.1681/ASN.2016070731.
- Morselli E, Criollo A, Rodriguez-Navas C, Clegg DJ. Chronic high fat diet consumption impairs metabolic health of male mice. Inflamm Cell Signal. 2014;1:e561.
- Portovedo M, Ignacio-Souza LM, Bombassaro B, Coope A, Reginato A, Razolli DS, Torsoni MA, Torsoni AS, Leal RF, Velloso LA, et al. Saturated fatty acids modulate autophagy’s proteins in the hypothalamus. PLoS One. 2015;10(3):e0119850. doi:10.1371/journal.pone.0119850.
- Kaushik S, Arias E, Kwon H, Lopez NM, Athonvarangkul D, Sahu S, Schwartz GJ, Pessin JE, Singh R. Loss of autophagy in hypothalamic POMC neurons impairs lipolysis. EMBO Rep. 2012;13(3):258–265. doi:10.1038/embor.2011.260.
- Quan W, Kim HK, Moon EY, Kim SS, Choi CS, Komatsu M, Jeong YT, Lee M-K, Kim K-W, Kim M-S, et al. Role of hypothalamic proopiomelanocortin neuron autophagy in the control of appetite and leptin response. Endocrinology. 2012;153(4):1817–1826. doi:10.1210/en.2011-1882.
- Hernandez-Caceres MP, Toledo-Valenzuela L, Diaz-Castro F, Avalos Y, Burgos P, Narro C, Peña-Oyarzun D, Espinoza-Caicedo J, Cifuentes-Araneda F, Navarro-Aguad F, et al. Palmitic acid reduces the autophagic flux and insulin sensitivity through the activation of the free fatty acid receptor 1 (FFAR1) in the hypothalamic neuronal cell line N43/5. Front Endocrinol (Lausanne). 2019;10:176. doi:10.3389/fendo.2019.00176.
- Morselli E, Fuente-Martin E, Finan B, Kim M, Frank A, Garcia-Caceres C, Navas C, Gordillo R, Neinast M, Kalainayakan S, et al. Hypothalamic PGC-1alpha protects against high-fat diet exposure by regulating ERalpha. Cell Rep. 2014;9(2):633–645. doi:10.1016/j.celrep.2014.09.025.
- Mauvezin C, Neufeld TP. Bafilomycin A1 disrupts autophagic flux by inhibiting both V-ATPase-dependent acidification and Ca-P60A/SERCA-dependent autophagosome-lysosome fusion. Autophagy. 2015;11:1437–1438.
- Kimura S, Noda T, Yoshimori T. Dissection of the autophagosome maturation process by a novel reporter protein, tandem fluorescent-tagged LC3. Autophagy. 2007;3(5):452–460. doi:10.4161/auto.4451.
- Klionsky DJ, Abdelmohsen K, Abe A, Abedin MJ, Abeliovich H, Acevedo Arozena A, Adachi H, Adams CM, Adams PD, Adeli K et al. Guidelines for the use and interpretation of assays for monitoring autophagy (3rd edition). Autophagy. 2016;12:1–222.
- Rubinsztein DC, Codogno P, Levine B. Autophagy modulation as a potential therapeutic target for diverse diseases. Nat Rev Drug Discov. 2012;11(9):709–730. doi:10.1038/nrd3802.
- Choy CH, Saffi G, Gray MA, Wallace C, Dayam RM, Ou ZA, Lenk G, Puertollano R, Watkins SC, Botelho RJ. Lysosome enlargement during inhibition of the lipid kinase PIKfyve proceeds through lysosome coalescence. J Cell Sci. 2018;131.
- Creasy BM, Hartmann CB, White FK, McCoy KL. New assay using fluorogenic substrates and immunofluorescence staining to measure cysteine cathepsin activity in live cell subpopulations. Cytometry A. 2007;71(2):114–123. doi:10.1002/cyto.a.20365.
- Pryor PR. Analyzing lysosomes in live cells. Methods Enzymol. 2012;505:145–157.
- Duvvuri M, Gong Y, Chatterji D, Krise JP. Weak base permeability characteristics influence the intracellular sequestration site in the multidrug-resistant human leukemic cell line HL-60. J Biol Chem. Mol Biol Cell. 2004;279(31):32367–32372. doi:10.1074/jbc.M400735200.
- Jara C, Aranguiz A, Cerpa W, Tapia-Rojas C, Quintanilla RA. Genetic ablation of tau improves mitochondrial function and cognitive abilities in the hippocampus. Redox Biol. 2018;18:279–294. doi:10.1016/j.redox.2018.07.010.
- Mauthe M, Orhon I, Rocchi C, Zhou X, Luhr M, Hijlkema K-J, Coppes RP, Engedal N, Mari M, Reggiori F, et al. Chloroquine inhibits autophagic flux by decreasing autophagosome-lysosome fusion. Autophagy. 2018;14(8):1435–1455. doi:10.1080/15548627.2018.1474314.
- de Araujo MEG, Liebscher G, Hess MW, Huber LA. Lysosomal size matters. Traffic. 2020;21(1):60–75. doi:10.1111/tra.12714.
- Wang H, Lo WT, Haucke V. Phosphoinositide switches in endocytosis and in the endolysosomal system. Curr Opin Cell Biol. 2019;59:50–57. doi:10.1016/j.ceb.2019.03.011.
- Bucci C, Thomsen P, Nicoziani P, McCarthy J, van Deurs B. Rab7: a key to lysosome biogenesis. Mol Biol Cell. 2000;11(2):467–480. doi:10.1091/mbc.11.2.467
- Levesque S, Pol JG, Ferrere G, Galluzzi L, Zitvogel L, Kroemer G. Trial watch: dietary interventions for cancer therapy. Oncoimmunology. 2019;8(7):1591878. doi:10.1080/2162402X.2019.1591878.
- Hariri N, Thibault L. High-fat diet-induced obesity in animal models. Nutr Res Rev. 2010;23(2):270–299. doi:10.1017/S0954422410000168.
- Lien EC, Vander Heiden MG. A framework for examining how diet impacts tumour metabolism. Nat Rev Cancer. 2019;19(11):651–661. doi:10.1038/s41568-019-0198-5.
- Sasaki A, Nagatake T, Egami R, Gu G, Takigawa I, Ikeda W, Nakatani T, Kunisawa J, Fujita Y. Obesity suppresses cell-competition-mediated apical elimination of RasV12-transformed cells from epithelial tissues. Cell Rep. 2018;23(4):974–982. doi:10.1016/j.celrep.2018.03.104.
- Beloribi-Djefaflia S, Vasseur S, Guillaumond F. Lipid metabolic reprogramming in cancer cells. Oncogenesis. 2016;5(1):e189. doi:10.1038/oncsis.2015.49.
- Vishwakarma M, Piddini E. Outcompeting cancer. Nat Rev Cancer. 2020;20(3):187–198. doi:10.1038/s41568-019-0231-8.
- Ortiz-Rodriguez A, Acaz-Fonseca E, Boya P, Arevalo MA, Garcia-Segura LM. Lipotoxic effects of palmitic acid on astrocytes are associated with autophagy impairment. Mol Neurobiol. 2019;56(3):1665–1680. doi:10.1007/s12035-018-1183-9.
- Yamamoto T, Takabatake Y, Minami S, Sakai S, Fujimura R, Takahashi A, Namba-Hamano T, Matsuda J, Kimura T, Matsui I, et al. Eicosapentaenoic acid attenuates renal lipotoxicity by restoring autophagic flux. Autophagy. 2020:1–14. doi:10.1080/15548627.2020.1782034
- Wu X, Nagy LE. MLKL contributes to Western diet-induced liver injury through inhibiting autophagy. Autophagy. 2020:16-7. doi:10.1080/15548627.2020.1760624
- Niso-Santano M, Malik SA, Pietrocola F, Bravo-San Pedro JM, Marino G, Cianfanelli V, Ben‐Younès A, Troncoso R, Markaki M, Sica V, et al. Unsaturated fatty acids induce non-canonical autophagy. Embo J. 2015;34(8):1025–1041. doi:10.15252/embj.201489363.
- Li S, Li H, Yang D, Yu X, Irwin DM, Niu G, Tan H. Excessive autophagy activation and increased apoptosis are associated with palmitic acid-induced cardiomyocyte insulin resistance. J Diabetes Res. 2017;2017:2376893. doi:10.1155/2017/2376893.
- Coll AP. Effects of pro-opiomelanocortin (POMC) on food intake and body weight: mechanisms and therapeutic potential? Clin Sci (Lond). 2007;113(4):171–182. doi:10.1042/CS20070105.
- Bravo-San Pedro JM, Sica V, Martins I, Pol J, Loos F, Maiuri MC, Durand S, Bossut N, Aprahamian F, Anagnostopoulos G, et al. Acyl-CoA-binding protein is a lipogenic factor that triggers food intake and obesity. Cell Metab. 2019;30(6):1171. doi:10.1016/j.cmet.2019.10.011.
- Zahoor M, Farhan H. Crosstalk of autophagy and the secretory pathway and its role in diseases. Int Rev Cell Mol Biol. 2018;337:153–184.
- Oh TS, Cho H, Cho JH, Yu SW, Kim EK. Hypothalamic AMPK-induced autophagy increases food intake by regulating NPY and POMC expression. Autophagy. 2016;12(11):2009–2025. doi:10.1080/15548627.2016.1215382.
- Antonova L, Aronson K, Mueller CR. Stress and breast cancer: from epidemiology to molecular biology. Breast Cancer Res. 2011;13(2):208. doi:10.1186/bcr2836.
- van Norren K, Dwarkasing JT, Witkamp RF. The role of hypothalamic inflammation, the hypothalamic-pituitary-adrenal axis and serotonin in the cancer anorexia-cachexia syndrome. Curr Opin Clin Nutr Metab Care. 2017;20(5):396–401. doi:10.1097/MCO.0000000000000401.
- Anderson CM, Macleod KF. Autophagy and cancer cell metabolism. Int Rev Cell Mol Biol. 2019;347:145–190.
- Galluzzi L, Pietrocola F, Bravo-San Pedro JM, Amaravadi RK, Baehrecke EH, Cecconi F, Codogno P, Debnath J, Gewirtz DA, Karantza V, et al. Autophagy in malignant transformation and cancer progression. Embo J. 2015;34(7):856–880. doi:10.15252/embj.201490784.
- Mizushima N, Levine B, Cuervo AM, Klionsky DJ. Autophagy fights disease through cellular self-digestion. Nature. 2008;451(7182):1069–1075. doi:10.1038/nature06639.
- Kallunki T, Olsen OD, Jaattela M. Cancer-associated lysosomal changes: friends or foes? Oncogene. 2013;32(16):1995–2004. doi:10.1038/onc.2012.292.
- Schulze U, Vollenbroker B, Kuhnl A, Granado D, Bayraktar S, Rescher U, Pavenstädt H, Weide T. Cellular vacuolization caused by overexpression of the PIKfyve-binding deficient Vac14 L156R is rescued by starvation and inhibition of vacuolar-ATPase. Biochim Biophys Acta Mol Cell Res. 2017;1864(5):749–759. doi:10.1016/j.bbamcr.2017.02.012.
- Odorizzi G, Babst M, Emr SD. Fab1p PtdIns(3)P 5-kinase function essential for protein sorting in the multivesicular body. Cell. 1998;95(6):847–858. doi:10.1016/S0092-8674(00)81707-9.
- Schulze U, Vollenbroker B, Braun DA, Van Le T, Granado D, Kremerskothen J, Fränzel B, Klosowski R, Barth J, Fufezan C, et al. The Vac14-interaction network is linked to regulators of the endolysosomal and autophagic pathway. Mol Cell Proteomics. 2014;13(6):1397–1411. doi:10.1074/mcp.M113.034108.
- Guerra F, Bucci C. Multiple roles of the small GTPase Rab7. Cells. 2016;5(3):34. doi:10.3390/cells5030034.
- Marwaha R, Arya SB, Jagga D, Kaur H, Tuli A, Sharma M. The Rab7 effector PLEKHM1 binds Arl8b to promote cargo traffic to lysosomes. J Cell Biol. 2017;216(4):1051–1070. doi:10.1083/jcb.201607085.
- Hyttinen JM, Niittykoski M, Salminen A, Kaarniranta K. Maturation of autophagosomes and endosomes: a key role for Rab7. Biochim Biophys Acta. 2013;1833(3):503–510. doi:10.1016/j.bbamcr.2012.11.018.
- Yu L, McPhee CK, Zheng L, Mardones GA, Rong Y, Peng J, Mi N, Zhao Y, Liu Z, Wan F, et al. Termination of autophagy and reformation of lysosomes regulated by mTOR. Nature. 2010;465(7300):942–946. doi:10.1038/nature09076.
- Galluzzi L, Bravo-San Pedro JM, Levine B, Green DR, Kroemer G. Pharmacological modulation of autophagy: therapeutic potential and persisting obstacles. Nat Rev Drug Discov. 2017;16(7):487–511. doi:10.1038/nrd.2017.22.
- Belsham DD, Cai F, Cui H, Smukler SR, Salapatek AM, Shkreta L. Generation of a phenotypic array of hypothalamic neuronal cell models to study complex neuroendocrine disorders. Endocrinology. 2004;145(1):393–400. doi:10.1210/en.2003-0946.
- Bustamante HA, Cereceda K, Gonzalez AE, Valenzuela GE, Cheuquemilla Y, Hernandez S, Arias-Muñoz E, Cerda-Troncoso C, Bandau S, Soza A, et al. The proteasomal deubiquitinating enzyme PSMD14 regulates macroautophagy by controlling golgi-to-ER retrograde transport. Cells. 2020;9(3):777. doi:10.3390/cells9030777.
- Duvvuri M, Gong Y, Chatterji D, Krise JP. Weak base permeability characteristics influence the intracellular sequestration site in the multidrug-resistant human leukemic cell line HL-60. J Biol Chem. 2004;279(31):32367–32372. doi:10.1074/jbc.M400735200.
- Tapia-Rojas C, Torres AK, Quintanilla RA. Adolescence binge alcohol consumption induces hippocampal mitochondrial impairment that persists during the adulthood. Neuroscience. 2019;406:356–368. doi:10.1016/j.neuroscience.2019.03.018.
- Diaz J, Mendoza P, Ortiz R, Diaz N, Leyton L, Stupack D, Quest AFG, Torres VA. Rab5 is required in metastatic cancer cells for Caveolin-1-enhanced Rac1 activation, migration and invasion. J Cell Sci. 2014;127(11):2401–2406. doi:10.1242/jcs.141689.
- Torres VA, Mielgo A, Barila D, Anderson DH, Stupack D. Caspase 8 promotes peripheral localization and activation of Rab5. J Biol Chem. 2008;283(52):36280–36289. doi:10.1074/jbc.M805878200.