
ABSTRACT
Over four workshops, we collected community input on what people considered as persistent challenges in geovisualization with the participation of 72 experts from various sub-domains of geographic information science and technology. We categorize and analyze this bottom-up input, and contrast it with the previously published research challenges based on five research agenda papers (top-down). We observe certain overlaps but also some interesting differences between the top-down and bottom-up approaches. A synthesis of the two suggests three major issues as persistent challenges: (1) a better understanding of the scope of our domain, how it interacts with other domains, and how to make this happen, (2) a systematic understanding of human factors, (3) a ‘practicable’ set of guidelines that matches the visualization types to task types, and guides the practitioner to design geovisualizations that are appropriate and helpful to the user. Distinguishing persistent from important, we discuss why the identified challenges are persistent, and draw recommendations for action based on our observations and interpretations. We believe these findings will help building a stronger, better-grounded research agenda for our community.
RÉSUMÉ
En quatre ateliers, nous avons collecté des données auprès de 72 experts de différents domaines des sciences et technologies de l’information géographique sur ce qui est considéré comme des défis persistants en géovisualisation. Nous avons classé et analysé ces informations ascendantes (bottom-up) et les avons comparées aux défis de recherche précédemment publiés dans cinq papiers centrés sur les agendas de recherche et qui constituent notre référence descendante (top-down). Nous observons certains chevauchements mais aussi des différences intéressantes entre les approches ascendantes et descendantes. Une synthèse des deux suggère trois problèmes majeurs comme défis persistants : 1/ une meilleure compréhension de l’étendue de notre domaine, comment il interagit avec d’autres domaines et comment susciter ces interactions 2/ une compréhension systématique des facteurs humains 3/ développer un ensemble de guides pratiques qui mettraient en correspondance les types de visualisation à des types de tâches, qui guideraient le praticien pour concevoir des visualisations qui sont adaptées et utiles à l’utilisateur. En différenciant la persistance de l’importance nous avons débattu les raisons de la persistance des défis identifiés et nous avons proposé des recommandations basées sur nos observations et interprétations. Nous pensons que ces éléments seront utiles pour construire un agenda de recherche plus solide et mieux ancré pour notre communauté.
Introduction and related work
A persistent challenge in research might indicate the continued relevance of a topic over time, or a long-standing research problem that remains ill-defined, difficult to solve or not addressed adequately. For such problems, partial solutions might exist, however, such partial solutions might help provide a focus, thus make the problem persist. In this study, we provide a bottom-up community perspective on persistent (research) challenges in geovisualization, and contrast the bottom-up view with a set of selected research agenda papers that represent a top-down view (i.e. Andrienko et al., Citation2007; Fairbairn, Andrienko, Andrienko, Buziek, & Dykes, Citation2001; Laramee & Kosara, Citation2006; MacEachren & Kraak, Citation1997; Virrantaus, Fairbairn, & Kraak, Citation2009). We believe identifying persistent problems through these two perspectives (bottom-up and top-down) and reflecting on the possible reasons for their persistency will contribute towards a well-informed research agenda. As by-products, we are interested in identifying bridges between the basic (fundamental) and applied sciences where possible, as well as (in)consistencies between the top-down and bottom-up findings, as these may lead to identification of previously unnoticed persistent challenges, or possibly a problem that may be considered solved by the scientists but persists for practitioners, or vice versa.
Many important contributions have been offered on research challenges related to geovisualization (e.g. Keim et al., Citation2008; MacEachren, Citation1994; MacEachren & Kraak, Citation2001; McMaster & Usery, Citation2004; Slocum et al., Citation2001; Theus, Citation2005). We complement these existing efforts by offering a new understanding on the scope and degree of persistency of identified challenges. In our bottom-up approach, we asked active researchers and practitioners to report what they considered as persistent problems and categorized them, thus, we obtained a collective view. In our top-down approach, we analyzed five research agenda papers starting from the early mentions of the term geovisualization in literature (Andrienko et al., Citation2007; Fairbairn et al., Citation2001; Laramee & Kosara, Citation2006; MacEachren & Kraak, Citation1997; Virrantaus et al., Citation2009). Some of these papers also present research agendas with an implicit community involvement, for example, Andrienko et al. (Citation2007) formulated their observations based on workshops where qualitative discussions took place, MacEachren and Kraak (Citation1997) is an editorial to a special issue (thus reflects the contributions of all authors in that special issue) and Virrantaus et al.’s (Citation2009) study statements made by the ICA’s commissions, implicitly benefitting from a form of collective wisdom. Nonetheless, the agendas are prepared top-down, that is, they are mainly the intellectual work of experts, while the community input in our case is direct, and even if they are also self-selected, they represent a broader base.
Emergence of geovisualization
Geographic visualization (often shortened as geovisualization and colloquially used as geovis) was born as cartography transitioned into the digital era. Geovisualization has been defined by various scholars and committees with an emphasis on exploration (and thus analytical inference making) enabled by interactivity, a defining characteristic that would set it apart from traditional cartography (e.g. Dykes, MacEachren, & Kraak, Citation2005; Jiang & Li, Citation2005; Kraak, Citation2003). In recent years, the term geovisual analytics emerged with similar definitions; perhaps somewhat more closely linked with computational analyses; but with an emphasis on bridging the innate human abilities of extracting information from visual displays and the tasks in which computers are superior (Andrienko et al., Citation2007).
Cartography is thousands of years old, and it has been originally optimized for tangible (i.e. carved on wood, drawn, printed) maps, with the primary goal to design maps for communicating spatial information (Board, Citation2011; Thrower, Citation1996). However, as the digital era disrupted all disciplines, the added dynamism and interactivity opened new possibilities and challenges also for cartography, which, in turn, motivated a search for a new name to express the differences between the traditional cartography and this new multi-media cartography (Cartwright & Peterson, Citation2007). Several terms have been used over time that are somewhat related, for example, computer cartography, digital cartography, geovisualization and geovisual analytics; and today it might be hard to draw a line between them ().
Figure 1. The terminology in geovisualization since computers became commonplace.
Beginnings of digital/computer cartography was focused on automation, which was coupled with analytical cartography (leading to spatial analysis, e.g. see Moellering, Citation2000); while visualization took a different turn and grew to become interfaces/tools to support thinking/ideas. shows an n-gram of some of these terms produced using Google’s online Ngrams tool (https://books.google.com/ngrams).
Figure 2. Google N grams for ‘cartography’ (top), and other terms featured in (bottom). The rise of geographic visualization roughly corresponds with the fall or the stagnation of the other terms (‘geovisualization’ shows the same pattern).
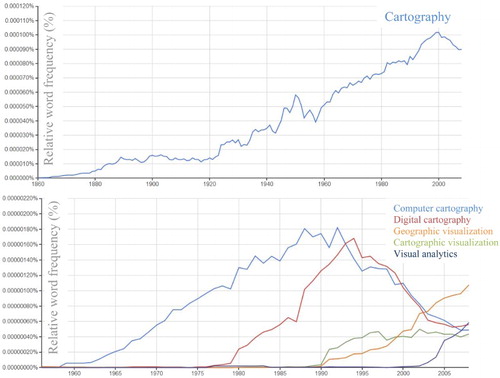
These Ngrams in are based on a sample of books published roughly over 200 years (1800–2008), and they reveal the timeline of the emergence, rise and fall of the studied terms. We see that the use of the term cartography appears starting mid-1800s, and steadily increases over time until ∼2000. Coinciding with the influential publication ‘Visualization in Scientific Computing’ by McCormick, DeFanti, and Brown (Citation1987), we see that around 1990 the term geovisualization starts slowly replacing the terms digital and computer cartography (, bottom). Soon after the use of the term geovisualization rises, we see a fall of the word cartography in general as well (, top). Visual analytics emerges around 2000, but we see no record of geovisual analytics at the time of sampling (the data are until 2008). Cartographic visualization Footnote1 emerges around the same time as geovisualization, but stagnates after late 1990s. Note that, cartographic visualization has also been described with an emphasis on interactivity, decision-making and hypotheses generation – which are essential in the way we define geovisualization and geovisual analytics today – demonstrating the continuity of and the tight relationship between these terms (e.g. Fairbairn et al., Citation2001; MacEachren, Citation1994).
Nonetheless, there are arguments for a distinction. Many scholars hold the view that even when digital; cartography focuses on map design (e.g. Fairbairn et al., Citation2001) and relevant interaction design, while geovisualization aspires for a broader goal of knowledge construction and decision support since its conception (e.g. MacEachren, Citation1994). A widely accepted conceptualization of cartography and geovisualization through cartography(3) and its subsequent updates (MacEachren, Citation1994; MacEachren et al., Citation2004) also supports that all geovisualization environments would include cartography, while cartography can be purely about map design, and not necessarily include the objectives of geovisualization.
We also witnessed major changes in the types and availability of data that are used for making maps. What was once expensive and rare became plentiful and overwhelming (Li et al., Citation2015) along with a shift in the understanding of who the cartographers are: we moved from an authoritative top-down map production to a much more open system in which anyone with a computer or GPS tracker can produce maps. Such user-generated content even led to the proposal of a new word ‘produser’ (i.e. the user is also the producer) (Straumann, Çöltekin, & Andrienko, Citation2014). Emergence and spread of the Internet radically changed also collaborative map making and map use (Goodchild, Citation2008). Thus, we also see emerging terms trying to capture such changes and the implications they have for map design and geovisualization-based knowledge construction, for example, participatory GIS (e.g. Jankowski, Citation2009), neogeography (e.g. Turner, Citation2006), collaborative geovisualization (e.g. Fuhrmann & Pike, Citation2005), etc.
With its important components constantly changing (e.g. users, producers, data, media, accessibility, technical procedures), the discipline naturally interacts with other disciplines such as computer science, social sciences, perceptual and cognitive psychology and human–computer interaction. In terms of interdisciplinary interactions, perhaps the closest to geovisualization are information visualization (InfoVis) and scientific visualization (SciVis); and an obvious question in the discourse on the scope of geovisualization is how it is related to (and separated from) these two domains. There are community-driven traditions/conventions where GeoVis, InfoVis and SciVis differ; however, when we look at the research challenges expressed in these domains, we see a large overlap in the stated research problems (e.g. Chaomei Chen, Citation2005; Laramee & Kosara, Citation2006; Munzner, Citation2009; Thomas & Kielman, Citation2009). We might think spatial is special (Anselin, Citation1989), but of course InfoVis and SciVis are also spatial (although often not geographic). Therefore, some common concerns naturally exist. If and when one needs to distinguish between these domains, again, a spectrum may be most appropriate: One could say that InfoVis community works more with abstract visualizations (i.e. also when there is no natural spatial structure in the data), SciVis community more with realistically visualizing existing scientific entities; and GeoVis seem to do either (or both), for example, social (human) geography themes might be closer to InfoVis, while environmental (physical) geography themes might be closer to SciVis. No longer driven by hardware dependencies, InfoVis and SciVis communities themselves have large overlaps and thus are merging. This also means the distinction made above might not persist, or might persist only because of conventions and not because of clearly defined disciplinary scopes.
In this section, we provided a brief historical overview and a discussion of the scope of geovisualization. It was important to look back to identify when the term geovisualization enters the discourse, because we posed the question as such (persistent problems in geovisualization). It was also necessary to discuss the scope of geovisualization as a discipline to frame our findings, because the participants might have had a broad view of geovisualization thinking about the posed question. Furthermore, through this assessment of historical shift in the discourse, we identified the time span for selecting the research agenda papers. Our literature survey did not yield an identical approach to ours (identifying persistent challenges based on direct community input), thus we report the input from our 72 participants as an original contribution, and compare our findings to selected existing research agenda papers published in the time span since the ‘birth’ of the term geovisualization.
Methods
We used a semi-structured survey to collect the input. We then analyzed the input using quantitative and qualitative methods; then analyzed five selected research agenda papers based on a systematic review, and finally synthesized our findings in bottom-up and top-down analyses. Below we detail the procedures of data collection and processing as well as the quantitative and qualitative approaches we used for analyses.
Bottom-up: data collection and processing
In four different workshops, we asked the participants () to respond to the questions below, presented as slides on a projector ():
Figure 3. Participants answered to the survey questions using sticky notes.
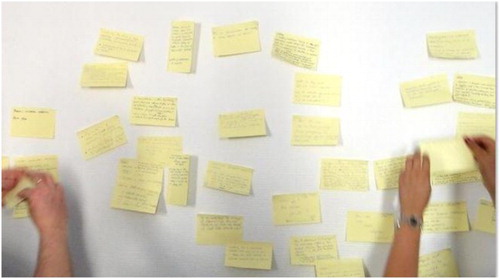
Table 1. The workshops in which we collected the data.
‘What is a persistent research problem in geovisualization?’
How well formulated is the problem?
How challenging is the problem (size of task)?
How long will it take?
In this paper, we mainly report on the first question, because of low response rates in some of the workshops to the questions two and three, and because the responses, those questions were too generic to interpret in many of the cases.
We selected the workshops () to cover a broad range of expertise within geovisualization (basic and applied sciences, technology and engineering). ICC (International Cartographic Conference) is the bi-annual conference of the International Cartographic Association, with varied participants both from basic and applied sciences, while ISPRS (International Society for Photogrammetry and Remote Sensing) draws more technology and engineering research, and AutoCarto might be considered between the two in terms of participant profiles. This characterization is of course not with crisp boundaries as each conference has special interest groups (working groups, commissions) that have some overlaps with the others.
Participation was voluntary, and participants responded the questions individually. We did not impose limits as to how many times participants could answer the questions; that is, some participants may not have provided any input, while some may have provided several answers. Furthermore, some participants were in both ICC meetings. However, the core contribution of this study is the outcome of the bottom-up ‘brainstorm’; thus, we believe the repeat-participants or unlimited-answers do not pose a threat to the findings (in fact it might help with the flow of thoughts). We opted for this semi-structured approach similar to a focus group study (Courage & Baxter, Citation2005; Monmonier & Gluck, Citation1994) not to limit or guide the participants’ thoughts.
Data handling and analysis
We transcribed the sticky notes verbatim, and checked the digital version for correctness and completeness. We then analyzed the data both quantitatively and qualitatively with the intention to identify the breadth of the collected statements about persistent problems and the most prominent statements. Quantifying text occludes/removes context, thus qualitative analysis is important; conversely, quantitative analysis is important as it reveals patterns that are not easy to see in the qualitative analysis (Mehl, Citation2006).
Quantitatively, we analyzed the word-frequency in transcribed statements using the text mining library tm in R (Feinerer, Hornik, & Meyer, Citation2008). In preparation of the corpus, whitespaces, punctuation, numbers and standard English stop words (such as of/or/the, etc.) were removed. We did not apply stemming; instead we manually analyzed the resulting words and grouped them. For plurivalent words, such as generalization, which could either refer to generalization of data or generalizability of findings, we performed manual ‘text in context analyses’ to establish their true meaning. General high-level words such as data, problem or geovisualization occurred often and were not taken into account. In parallel, using a qualitative content analysis approach, we analyzed the transcribed statements depending on their content, and assigned them to one or several categories. We used an emerging rather than an a priori coding scheme (Stemler, Citation2001) while categorizing the statements as we wanted to identify the persistent problems bottom-up. The categorization of the statements was refined in subsequent runs and independently reviewed by another researcher as a means of a qualitative validation to reduce possible bias in the process.
Top-down: selecting and processing the research agenda papers
We selected the five research agenda papers from the time period 1997 to 2009 () based on their temporal and thematic representativeness. Our criteria were that they covered a time span that included early considerations of geovisualization research as well as the beginnings of the geovisual analytics topics, and a keyword search confirmed that the scope of the papers was relevant to our analysis. gives an overview of the selected papers.
Table 2. The research agenda papers.
Similarly as Lam, Bertini, Isenberg, Plaisant, and Carpendale (Citation2012), we used a systematic review; that is, we first summarized the selected papers based on the mentioned research themes, and coded our findings into categories using a matrix to understand the overlaps between these papers.Footnote2 Thus, we obtained a survey of the problems that were mentioned in all the studied papers over time, which, in turn, brought the findings from the papers into a form that we could compare to the community survey. We finalized our analyses by synthesizing and contrasting the bottom-up findings to the findings from the top-down analysis based on categories that emerged in each.
Results
Bottom-up persistent problems
Word-count analysis
Overall, 115 statements were obtained (48/ICC2011, 33/ISPRS2012, 7/AutoCarto2012 and 27/ICC2013). The word-count analysis of these 115 statements resulted in a list containing 157 different words (minus the stop words) occurring at least twice; with 53 words occurring 5 and more times in the corpus (see Appendix 1). The word counts reveal a strong focus on words that relate to understanding and considering the users in the geovisualization design, which is clearly perceived as a long-standing challenge: we see mention of users (17), usefulness (11), experts (6), non-experts (5), user studies (6), user requirements (5) and user-centered (4) in relation to what we can broadly consider human factors research. We also see a number of terms that broadly refer to the processes involved in creating and using geovisualizations, for example, design (15), analysis (14), tasks (10), representation (9) and exploration (5). Another emerging category appears to relate to methods and techniques including the mentions of these words themselves; methods (13), tools (10), techniques (7), technologies (7). Explicitly and often mentioned words that refer to techniques/methods are interaction (9) and animation (5). In terms of data, temporal and spatiotemporal (9) and environmental (6) data were mentioned often, followed by linked (5) data. Also level (7), complex (6) and large (5) were mentioned relatively often (a cross-check revealed that level referred to different levels/degrees of realism or abstraction, while complex referred to complexity of displays or methods, and large mostly to the size of the data sets, for example, big data). Thus, these words link to topics such as realism (10) and abstraction (4) or perhaps schematization (3). We also see terms related to outcomes, that is, knowledge (13), maps (10), display (9), effective (8) (efficient (3) was used less often), understand (8), application (6) and relevant (6). We see that the words decision (4), insight (3) and reasoning (3) appear relatively infrequently. Last but not least, the terms uncertainty (8), and modifiable unit problem (3) were mentioned as persistent problems by the participants.
Content analysis
Taking another perspective, we grouped the statements into categories based on their thematic similarity, independent from the word-count analysis. shows the 11 categories we obtained by this method.
Figure 4. Research themes as mentioned by all participants in all four workshops. Note that single statements within a category may overlap with more than one category.
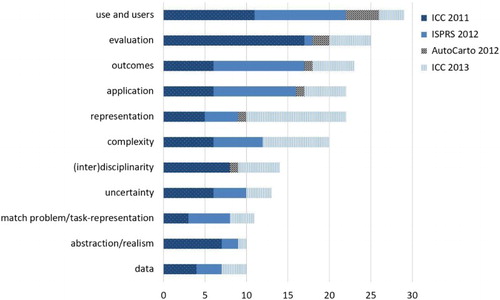
immediately reveals that the participants considered human factors and related research as long-standing challenges: Top two items are use and users and evaluation. However, one must distinguish use-and-user issues from evaluation, because the latter might refer to other forms of testing the fitness of a product (technical, quantitative validation methods). Nonetheless, we link the term evaluation broadly to human factors research because the criteria for validation often implicitly or explicitly consider human needs. Following the themes related to human factors, we see outcomes and application emerge as dominant themes. These two are also linked at a conceptual level, that is, an application could be an outcome. We placed these as separate categories, as we reasoned that the outcome could be an insight, a better understanding of something (basic/fundamental science), or making a decision; while applications could refer to applied science questions such as turning knowledge into products, contemporary impact on the society or technological/engineering research.
At the end, we reconsidered these 11 categories () along with the word-count analysis, and summarized them into 6 broader categories. Primarily, we merged the representation-related challenges under a single category and brought ‘outcomes’ and ‘applications’ together. The resulting categories are: (Inter)disciplinarity, Use and users, Data, Representation: visualization types and corresponding task types, abstraction-realism, complexity and uncertainty, and Outcomes and applications.
Qualitative interpretation
In the following sections, we provide a qualitative interpretation on each of the six categories (as listed above), and provide example statements to provide the context in which they were expressed.
(Inter)disciplinarity
The interdisciplinary nature of geovisualization appears to be perceived as a persistent challenge. While interdisciplinarity is clearly also an opportunity, various participants formulated that interdisciplinarity posed challenges, for example, ‘how can we more effectively interact with cognate research fields (when+where)?’, ‘what are the related disciplines, have we even found all of them?’ or ‘what are the best ways to link our discipline with other disciplines?’. Thus, participants expressed that keeping up with interdisciplinary interactions was an ongoing challenge and that we lacked effective instruments to bridge our discipline to other, related disciplines. Some research fields/areas were explicitly mentioned: psychology, cognitive science, technology/computer science, knowledge discovery and representation, computational linguistics and ubiquitous computing. The challenges regarding the technology seem to be twofold: some participants posited taking full advantage of the fast-changing technology as a persistent challenge, while others mentioned that technology has been driving science and this is a persistent challenge to overcome for healthy scientific progress and long-lasting theoretical developments.
Furthermore, accessibility, popularity and dissemination of geovisualization were mentioned, which were framed also as challenges of interdisciplinarity (‘Do we reach potential users of geovisualization such as K-12 students, policy makers, stakeholders and the geovisualization as well as other research communities?’). Additionally, understanding factors and contexts (e.g. time/budget restrictions, commercial ramifications) which may hinder potential users in all disciplines in adopting geovisualization tools and displays was stated as a challenge. Participants stated that research tools and displays developed for one project are often not re-useable with others, nor are they often transferable to other application domains. In other words, as a participant expressed it, a recurring problem seems to be ‘how can we increase the awareness of available tools and capabilities, so that they can be utilized’. This last question hints at an understanding of the users, why they might and might not adapt a solution, thus links to the next category of persistent problems.
Use and users
Participants reported various challenges in connection to use and users, for example, one participant noted ‘understanding cognition aspects in reasoning tasks (and applying them to GeoVis tools)’ was a persistent challenge, while another proposed that ‘[creating] comprehensible, informative, memorable (temporal) maps’ was one. Furthermore, following challenges were listed by the participants: an overall understanding of the role of humans in the entire process of creation and consumption of the geovisualizations; the interaction between users, tasks and visualizations; the influence of different designs or varying context in a user’s success; determining relevant information for a particular user; usefulness or usability, and what concepts and categories are needed for exploration of these problems. Users have different backgrounds, perceptual/cognitive abilities, preferences and requirements that need to be taken into account and potentially modeled. Thus, personalization was mentioned as an opportunity, and a challenge. Similarly, participants mentioned (again, in connection to users) that technology-driven development of tools is a persistent problem, as well as the misrepresentation and misuse of these tools. Perhaps, a large and long-term question is if universal usability is achievable (and what does it mean for geovisualization).
Evaluation
The topic evaluation is home to a number of research challenges. The main challenge is perhaps best summarized by the question posed by one participant: ‘How can we comprehensively but efficiently and effectively evaluate geovisualizations?’ Seemingly, methods that are specifically optimized for evaluating geovisualizations have been a persistent challenge. Participants mentioned the often fragmented, disconnected and un-generalizable nature of evaluations. One participant noted ‘Pinning down the reasons behind the “better” or “worse” solution will help us generalize’. This is especially important for the transferability of findings across applications and domains. Furthermore, challenge of working with ‘real world’ users, finding representative tasks, identifying appropriate measures and outcomes as well as unintended potential effects of tool and design choices were mentioned. Thus, generating theories and design guidelines through user studies is a long-standing challenge, perhaps specifically complex for geovisualization user studies, in comparison to, for example, spatial cognition research in psychology, because stimuli (maps, 3D virtual cities) are rarely free from possible confounding variables (Çöltekin, Lokka, & Zahner, Citation2016).
Another evaluation challenge seems to be in defining systematic and well-considered approaches to benchmarking, and how ‘fair’ it is to compare new methods to established ones (e.g. one solution may be slower but allows different insights).
Data
Participants stated broadly ‘understanding’ of the data as a persistent challenge; possibly because the data is often collected by others before it is used by the geovisualization experts. Similarly, understanding different types of uncertainty associated with data has been a long-standing challenge, as well as finding suitable representations for uncertainty (‘how can informal, affective, subjective, vague or contextual data be suitably represented?’). One participant noted ‘visualization of informal data (let’s say VGI) is a problem (diversity, lack of authority, no specific goal)’. Procedures that ensure such interactions between the data expert, geovisualization expert and the domain experts as users of visual analytics systems (assuming these are different people) would be worth developing to address the chain of processes that might contribute to uncertainty, including the visualization itself. The complexity of data and its multidimensionality (spatial, temporal, attribute) were also noted. Data sharing is still an issue, despite the modern data sources, some data are still not available and data collection is expensive. Interestingly, privacy was brought up by only one participant, while, as one would expect, big data was brought up many times despite its relatively recent history as a term (although of course conceptually managing large datasets have been always a concern in geovisualization, thus it is a persistent problem even if the term is relatively new).
Representation: visualization types and corresponding task types, abstraction–realism, complexity and uncertainty
At this point, we clustered five of the topics together, since they can all be viewed as issues related to representation/design, that is, matching visualization types to task types, abstraction/realism, (visual) complexity and representation of uncertainty. The participants noted a range of visualization types, which they feel we do not understand enough – and that this lack of understanding is a persistent challenge. These visualization types include, for example (in no particular order), space–time representations and temporal maps (specifically animations); schematizations; representations of semantics and relations between spatiotemporal objects; representations of qualitative/informal/textual data; transitions between different representations; combined representations of heterogeneous, varying, dynamic, complex, uncertain, multi-source, streaming data; three-dimensional representations as well as virtual and augmented reality; interactive, hyperlinked and connected representations; and mobile representations. While learning more about these representation types is important, it was also noted that it is critical to gain knowledge about which representation is useful or suited to solve what problem. Answers might be context-dependent and include processes where the task is long-term, ill-defined and/or multifaceted. As indicated above, we are missing guidance (e.g. best practices, recommender systems) as to which geovisualization type might be suited for which data, task and audience.
Closely connected to identifying a ‘right’ visualization type for the data/purpose/audience, many of our participants noted that challenges regarding abstraction–realism spectrum were persistent, for example, ‘establish which level of abstraction is necessary for which task’. While the term generalization was rarely mentioned, related terms such as filtering, visual complexity, simplifying and ‘benefitting from the maximum information without suffering from information overload’ were stated as problems. Thus, ‘selecting the right visualization type in terms of abstract versus real’ and ‘finding the right level of detail when designing a visual display’ were considered unsolved by the participants. Representing uncertainty and metadata without cluttering the display was also mentioned. Along the same lines, interface design has been brought up several times, thus linking the representation/design issues to interaction design and use and user issues.
Outcomes and applications
Many participants expressed that we lack a connection between research and practice. The statements varied from large-scale social and organizational issues (e.g. ‘The unwillingness of organizations to change […]. Reluctant to adopt new technology even if it will help’, or that the need for scientific knowledge is ‘clear with department managers but reluctant to act on it due to budget issues, it’s not in the culture … ’), to more specific issues (e.g. ‘What are the domains that need/use geovisualization?’) suggesting that challenges encountered in practice were linked to research and science by the community members at various scales. Many statements also suggest accessibility (technical knowledge as a barrier) as an issue which might hinder the adoption of geovisualization solutions. Some participants suggest to look for ways to disseminate existing solutions, while some urge that we should turn knowledge into tools that non-experts can use (‘experts only talk to experts’). Besides the important social and organizational issues, participants noted that accuracy, efficiency, relevance and quality of the outcomes (and if they lead to engagement and/or insight) as not only persistent challenges but difficult problems to address, because a range of factors hinder even delineating these problems. For example, we still do not fully understand how interface design or visualization design choices precisely affect decision-making, and if they do, to what extent. Similarly, it is not well understood how uncertainty is propagated through the processes involved in preparing geovisualizations. As such, we would benefit from rethinking our methods, and establishing reliable methods to measure the effect of geovisualizations on the outcomes.
As mentioned earlier, participants indicated that we do not know enough about in which domains geovisualization can be (potentially) of use. On the other hand, many participants brought up specific domains/application areas where they see potential, but also see a need to better integrate geovisualization, for example, mobility, environment, hazards, geology, neighborhood analysis, sentiment analysis, population change, volunteered geographic information (VGI), spatial data infrastructures (SDI), linguistics, knowledge representation, understanding place and change in place. A better understanding of the characteristics of the application domains may also help the transferability of the methods and processes for the creation of geovisualizations between application domains.
Top-down persistent problems
We systematically surveyed the research agenda papers using a semi-structured coding approach. We did not search for the six categories that emerged from the bottom-up analysis at this stage. However, once the literature survey was complete, we contrasted the findings to the six categories, and integrated them into a larger framework based on whether they were science or non-science (e.g. organization, coordination, policy) problems, and if science, whether they were basic or applied ().Footnote3 The coding process revealed the research themes presented in , which are persistent in the sense that they appear in one form or another in all five papers. There were many other research questions in these papers; however, we focus on those that we encountered in all of them. Naturally, the emerging research challenges from this analysis were rather continuous than discrete. We capture this in larger categories in .
Figure 5. Categories that emerged from the analysis of the five research agenda papers re-organized into themes.
Table 3. The research themes that emerged in all five research agenda papers.
The categorization in is obviously only one of the many possible ways to organize the emerging themes. We opted for this categorization as it not only allows us to get an overview, it expresses the non-discrete nature of these problems through the overlaps, as well as allowing multiple links between the themes. On the other hand, broader categorizations necessarily occlude the specific questions (which are important, even though clearly impossible to include all of them). We, thus, discuss several selected research questions below, and recommend the reader to consult the original papers if they are interested in all the questions listed in these five papers.
Interdisciplinary collaboration appears in all of the papers, where authors state its importance, the organizational complications that come with it, and their concerns on duplicating knowledge. MacEachren and Kraak (Citation1997) specifically make links to SciVis, tools and technologies developed in computer science, and to cognitive science for decision support systems and call for awareness and collaboration; while Fairbairn et al. (Citation2001) express that cartography community must seek contact and lead the research on areas linked to spatial data and tasks. On the other hand, Laramee and Kosara (Citation2006) urge that the visualization knowledge is somewhat esoteric, and that we must make effort to bring it to a wider audience. Around the same time, Andrienko et al. (Citation2007) express how the newly emerging visual analytics needs ‘concerted cross-disciplinary efforts to achieve substantial progress’, and emphasize this throughout the paper in context of various research themes, and list the need and benefits of bridging domains that could offer competence in mathematics, computer science, cognitive science, human–computer interaction among others. Virrantaus et al. (Citation2009) also consider the interdisciplinarity, and suggest that cartography could/should offer expertise to others.
The research agenda papers also clearly indicate an ongoing need for developing/updating conceptual and theoretical developments, such as finding effective visual metaphors (Laramee & Kosara, Citation2006; MacEachren & Kraak, Citation1997), identifying representation primitives (MacEachren & Kraak, Citation1997; Virrantaus et al., Citation2009). All papers explicitly or implicitly refer to the importance and non-trivial nature of understanding when and how to use abstraction/realism, and finding an optimum level of abstraction/realism, given a specific purpose and audience. In the earlier papers (Fairbairn et al., Citation2001; MacEachren & Kraak, Citation1997), this issue is linked to the use of 3D and virtual reality along with the level of detail and generalization, while the later papers also mention transitioning between multiple visualizations (Laramee & Kosara, Citation2006), information reduction (Andrienko et al., Citation2007) and implementing visual hierarchy as we map increasingly more information, for example, through Web 2.0 (Virrantaus et al., Citation2009).
In terms of human factors, most research agenda papers make a case that we do not fully understand cognitive processes involved in map-based decision-making and call for more effort to understand how visualization solutions facilitate thinking. Reasoning, decision-making and collaborative decision-making all involve understanding the users; and thus design that takes human limitations/strengths into account remains as a fundamental, ongoing challenge.
Irrespective of all considerations, all geovisualizations begin with data, thus numerous issues were listed as challenges that regard understanding, organizing, processing, storing and managing data. Among those, working with high-dimensional data (and reducing it to fit cognitive/computational limits), filtering the data in sophisticated ways to support the given context (identifying what is relevant), and also to support necessary abstraction levels are challenging and persistent issues. Also, the research papers suggest that managing and visualizing qualitative data, temporal data, metadata and other information about data quality and uncertainty remain as challenges. In more recent papers, we also see that big data becomes a part of the discourse. These data management issues also are a call for collaborating with computer graphics as a discipline, as both disciplines could benefit from some knowledge transfer.
Last but not least, all papers mention how the technological changes (computational power, the Internet, displays, interaction modalities) impose constant reconsideration of our methods as well as theories; and that we lack a systematic approach that would ensure that the new solutions are known to the practitioners and adopted by them.
Discussion
We were set out to document the current collective understanding of long-standing research challenges, and identify convergent and divergent points within and between the community views and existing research agenda papers over time. We intentionally did not impose specific hypotheses, and conducted the study as open as possible with structure to stimulate (and not restrict) participants’ thought process. Thus, when we synthesize and compare the community input to the analysis of the research papers, unsurprisingly, we see that the community input has a large granularity (problems of very different scale), while the research agenda papers present the problems in an organized manner. However, we identified large overlaps and therefore categorized them together into broad themes. In this final categorization, we conceptualized the entire set of persistent problems into those that belong to science and/or non-science (we view problems of organization, coordination and dissemination as non-science, or meta-science), and further classified the science problems into basic and/or applied science (not dichotomous categories but rather two ends of a natural continuum) ().
Figure 6. Synthesized bottom-up and top-down findings on persistent research challenges, categorized based on their relationship to science.
We also identified some differences between the bottom-up and top-down findings. A major difference is that the research agenda papers mention theoretical and conceptual challenges considerably more often and more explicitly than the workshop participants. Furthermore, we see that some specific topics (e.g. collaborative visualization, scalability, platform-independent visualization) that were brought up in the research agenda papers were largely omitted by the workshop participants. On the other hand, there is a very clear emphasis on (the lack of) transferring knowledge from science to practice in the bottom-up view, while, albeit present, this topic is not as prominent in the research agenda papers. Such discrepancies might be explained by an implicit bias which might have been introduced by the workshop themes, or perhaps by the fact that the workshops had some experts from industry and government while the research agenda papers have been written by academics working at universities.
When we synthesize all findings, we find that three themes come through very strongly in both analyses: (1) a better understanding of the scope of our domain, how it interacts with the other domains, and how to make this happen, (2) a systematic understanding of human factors, (3) a ‘practicable’ set of guidelines that matches the visualization types to task types, and guides the practitioner to design the geovisualizations that are appropriate and helpful to the user (or the ‘user type’). While data-related problems are also quite prominent, and some are rather complex (e.g. privacy issues, automatization of data filtering), these may remain as a necessary components of working in the GIScience domain and we might need to continuously work on temporary solutions and update the solutions as needed.
Of these three broad challenges, we view the first one, which we called ‘(inter)disciplinarity’ in this paper, is an important as well as persistent, but a non-scientific (or meta-scientific) challenge. This challenge calls for community action, there appears to be a need for outlets in which the interdisciplinary knowledge is shared in an accessible manner (e.g. workshops, dedicated blogs that draw publications from different fields and link them to the relevant problems come to mind). Our community is highly aware of the interdisciplinarity nature of geovisualization, and collaborative efforts do exist, thus we believe much progress can be expected in the next decade in this area, even though it probably can never be entirely solved, because new communities are born based on sub-domain expertise over time when the communities grow larger.
Second problem is ill-defined and we anticipate that it will persist for many more years. However, we estimate that in the next two decades, we will have made considerable progress also on this issue. The interest in human factors research in recent years has been unprecedented in (geo)visualization. Nonetheless, not only cartographers, but also psychologists and neuroscientists, do not precisely understand all factors that affect human behavior, even though there are indications that certain user groups (e.g. based on abilities, expertise, age, gender or culture) might have differences in performance and preference when working with geovisualizations. Such differences might justify more effort on personalized designs as a solution (e.g. based on distinctions between a ‘one time user’, ‘first time user’, ‘returning user’ and ‘expert user’); rethink design for different age groups, and possibly employ machine learning methods to continuously assess user performance in real time and adjust the design according to their performance, habits and preferences. Of course allowing the users to turn off any and all help if they prefer is important not to annoy them (Richter, Tomko, & Çöltekin, Citation2015).
The third problem, that we need to match the existing knowledge and come up with practicable guidelines that can guide the practitioners seems partly achievable (e.g. meta analyses and books on specific themes could be good ways forward); however, despite much respectable work in this vein, coming up with a clear, universal ‘10 commandments’ is a hard task because of the sheer complexity introduced by the variety of tasks and visualization designs, and because one size rarely fits all, that is, there is a remarkable intra-individual variation among the users of geospatial displays (Çöltekin, Citation2015). It is a basic science challenge to identify underlying primitives, for example, from a design perspective, visual variables (Bertin, Citation1967), and from a task perspective, Knapp’s taxonomy (Knapp, Citation1995) are great starting points, while from a human factors perspective, perhaps Hegarty et al.’s (Citation2006) work on spatial abilities in relation to the visual displays covers an important dimension, albeit there are many more dimensions to humans. It is then a joint basic and applied science challenge to turn the identified primitives into, for example, practicable guidelines, personalized displays and/or visualization recommender systems. As artificial intelligence and information science matures, we might get decent software help in choosing the design that is appropriate for the purpose/audience in the next two decades, although possibly solutions will remain incomplete for a long time and subject to updates at all times.
Conclusions
With the intention to strengthen and further inform the research agendas proposed in geovisualization domain, we set out to find what the community considers persistent (research) challenges in geovisualization, what makes them persistent and if community’s view matches the scientists’ top-down view. First of all, in a brief historical overview using Google Ngrams revealed that starting ∼1990, the term geovisualization enters the discourse and its use steadily increases, seemingly at the cost of the term cartography (and other related/competing terms) after ∼1997, linked to the emergence of SciVis. Despite its close links in its core research interests to SciVis and InfoVis, now after nearly 20 years, geovisualization is an established domain, and with this paper, we document what (a sample of) the geovisualization community considers persistent research challenges, and how their view compares to a top-down view, which we analyzed over time to understand if the problems persisted in research agenda papers.
Our twofold approach revealed that bottom-up and top-down findings both suggest that there are many opportunities in interacting with related disciplines and transfer knowledge. It is also evident that more research is needed in understanding human (perceptual and cognitive) factors and translating this understanding into design guidelines. Furthermore, it appears that meta analyses are needed that put the knowledge together that might allow us to infer if there are certain task types that require certain visualization types and match that with the user types, and/or consider if a display can be personalized based on all relevant factors. Clearly in connection to these, we observed that workshop participants as well as the top-down study suggested a large number of design issues, including topics linked to abstraction–realism, visual complexity or relevance – all of which are broadly rooted in cartographic generalization. The fact that a large number of design problems emerged in the study is interesting (perhaps also a bit worrying); however, part of this might be a high-level communication problem: we might want to think of better ways to communicate the known ‘best practice’ examples to those who produce geovisualization displays. Organizing the existing knowledge into books, and possibly putting more time spreading such knowledge on social media (blogs, other means) should perhaps be encouraged as possible measures to address parts of this knowledge transfer issue.
We believe the persistent research challenges we identified in this paper are disguised research opportunities for scientists, science management teams, education professionals and those who are driven to transfer research into applications. A natural continuation of this effort would be a multi-lingual global study that would systematically include all stakeholders in the domain and thus catch global trends and regional priorities in the process.
Acknowledgements
We would like to thank our participants in all of the workshops, as without their willingness to contribute, this information would never be available.
Disclosure statement
No potential conflict of interest was reported by the authors.
Notes on contributors
Arzu Çöltekin is a Research Group Leader and a Senior Lecturer at the GIScience Center of the University of Zurich and a research affiliate at the Seamless Astronomy group at the Harvard University. Her interdisciplinary work covers topics related to GIScience, visualization, vision (perception and cognition), eye tracking, virtual environments, and human-computer interaction. She is the chair of the ISPRS working group Geovisualization and Virtual Reality and is an active member of various other commissions and editorial boards.
Susanne Bleisch is Professor of Geovisualization and Visual Analytics at the FHNW University of Applied Sciences and Arts Northwestern Switzerland. From 2012 to 2014 she was a postdoctoral researcher in the Ambient Spatial Intelligence Research Group at the University of Melbourne. She studied Geomatics Engineering and obtained a PhD in Geographical Information Science from City University London in 2011.
Gennady Andrienko is a lead scientist responsible for the visual analytics research at the Fraunhofer Institute IAIS and a professor at the City University, London. He was the chair of the Commission on GeoVisualization of the ICA between 2007 and 2015 and currently is the associate editor of journals Information Visualization and IEEE Transactions on Visualization and Computer Graphics (since 2012) and International Journal of Cartography (since 2014) and editorial board member of Cartography and Geographic Information Science.
Jason Dykes is a Professor of Visualization in the Department of Computer Science at City, University of London where he co-directs the giCentre. His work involves developing techniques for interactive visual data analysis and knowledge about their use. A co-chair of the Commission on GeoVisualization of the ICA between 2007 and 2015 he serves on the Steering Committee of IEEE Information Visualization, having been papers’ co-chair in 2012 and 2013 and conference chair in 2014.
ORCID
Arzu Çöltekin http://orcid.org/0000-0002-3178-3509
Susanne Bleisch http://orcid.org/0000-0002-4563-060X
Gennady Andrienko http://orcid.org/0000-0002-8574-6295
Jason Dykes http://orcid.org/0000-0002-8096-5763
Notes
1. MacEachren and Kraak (Citation1997) report tracing the word visualization in cartographic literature as early as 1950s, citing Philbrick (Citation1953).
2. The original matrix can be seen here: https://www.dropbox.com/s/fb8zdils9441qpb/persistent%20problems%20-%20review%20of%20research%20agendas%20-%20matrix.pdf?dl=0
3. Note that these labels represent two ends of a spectrum and not two absolute binary categories.
References
- Andrienko, G., Andrienko, N., Jankowski, P., Keim, D., Kraak, M.-J. M. J., Maceachren, A., & Wrobel, S. (2007). Geovisual analytics for spatial decision support: Setting the research agenda. International Journal of Geographical Information Science, 21(8), 839–857. doi: 10.1080/13658810701349011
- Anselin, L. (1989). What is special about spatial data? Alternative perspectives on spatial data analysis. (D. A. Griffith, Ed.), Symposium on Spatial Statistics Past Present and Future. Syracuse, NY: Institute of Mathematical Geography.
- Bertin, J. (1967). Sémiologie graphique: Les diagrammes-les réseaux-les cartes. Paris: Gauthiet-Villars.
- Board, C. (2011). Cartographic communication. In The map reader (pp. 37–47). Chichester: John Wiley & Sons, Ltd.
- Cartwright, W., & Peterson, M. P. (2007). Multimedia cartography (2nd ed.). Berlin: Springer.
- Chaomei Chen, C. (2005). Top 10 unsolved information visualization problems. IEEE Computer Graphics and Applications, 25(4), 12–16. doi: 10.1109/MCG.2005.91
- Çöltekin, A. (2015). Mix well before use: Understanding the key ingredients of user studies. Workshop (position) paper. Presented at the pre-conference workshop “Envisioning the Future of Cartographic Researhc” at the International Cartograhic Conference, ICC 2015, Curitiba, Brazil. Retrieved from http://www.geo.uzh.ch/%7Earzu/publications/coltekin-2015-curitiba-position-paper.pdf
- Çöltekin, A., Lokka, I., & Zahner, M. (2016). On the usability and usefulness of 3D (geo)visualizations – A focus on virtual reality environments. International Archives of the Photogrammetry, Remote Sensing and Spatial Information Sciences, XLI-B2, 387–392. doi:10.5194/isprs-archives-XLI-B2-387-2016
- Courage, C., & Baxter, K. (2005). Focus groups. In C. Courage & K. Baxter, Understanding your users: A practical guide to user requirements. Chapter 12, pp. 514–560. San Francisco, CA: Morgan Kaufmann.
- Dykes, J. A., MacEachren, A. M., & Kraak, M.-J. (2005). Exploring geovisualization. Amsterdam: Elsevier Ltd.
- Fairbairn, D., Andrienko, G., Andrienko, N., Buziek, G., & Dykes, J. (2001). Representation and its relationship with cartographic visualization: A research agenda. Cartography and Geographic Information Science, 28(1), 13–28. doi: 10.1559/152304001782174005
- Feinerer, I., Hornik, K., & Meyer, D. (2008). Text mining infrastructure in R. Journal of Statistical Software, 25(5), 1–54. doi: 10.18637/jss.v025.i05
- Fuhrmann, S., & Pike, W. (2005). User-centered design of collaborative geovisualization tools. In J. Dykes, A. Maceachren & M.-J. Kraak (Eds.), Exploring geovisualization (pp. 591–609). Oxford: Elsevier.
- Goodchild, M. F. (2008). Assertion and authority: The science of user-generated geographic content. Proceedings of the colloquium for Andrew U. frank’s 60th birthday. Department of Geoinformation and Cartography, Vienna, Austria. Retrieved from http://www.geog.ucsb.edu/~good/papers/454.pdf
- Hegarty, M., Montello, D. R., Richardson, A. E., Ishikawa, T., & Lovelace, K. (2006). Spatial abilities at different scales: Individual differences in aptitude-test performance and spatial-layout learning. Intelligence, 34(2), 151–176. doi: 10.1016/j.intell.2005.09.005
- Jankowski, P. (2009). Towards participatory geographic information systems for community-based environmental decision making. Journal of Environmental Management, 90(6), 1966–1971. doi: 10.1016/j.jenvman.2007.08.028
- Jiang, B., & Li, Z. (2005, June). Geovisualization: Design, enhanced visual tools and applications. The Cartographic Journal, 42(1), 3–4. doi:10.1179/000870405X52702
- Keim, D., Andrienko, G., Fekete, J., Carsten, G., Melan, G., Keim, D., … Carsten, G. (2008). Visual analytics: Definition, process and challenges. In A. Kerren, J. T. Stasko, J.-D. Fekete, & C. North (Eds.), Information visualization – human-centered issues and perspectives LNCS 4950 (pp. 154–175). Berlin: Springer. Retrieved from http://www.springer.com/de/book/9783540709558 doi: 10.1007/978-3-540-70956-5_7
- Knapp, L. (1995). A task analysis approach to the visualization of geographic data. In T. L. Nygeres, D. M. Mark, R. Laurini, & M. J. Egenhofer (Eds.), Cognitive aspects of human computer interaction for geographic information systems (pp. 355–371). Berlin: Springer. doi:10.1007/978-94-011-0103-5
- Kraak, M.-J. (2003). Geovisualization illustrated. ISPRS Jounal of Photogrammetry & Remote Sensing, 57, 390–399. doi: 10.1016/S0924-2716(02)00167-3
- Lam, H., Bertini, E., Isenberg, P., Plaisant, C., & Carpendale, S. (2012). Empirical studies in information visualization: Seven scenarios. IEEE Transactions on Visualization and Computer Graphics, 18(9), 1520–1536. doi: 10.1109/TVCG.2011.279
- Laramee, R. S., & Kosara, R. (2006). Challenges and unsolved problems. In A. Kerren, A. Ebert, & J. Meyer (Eds.), Human-Centered visualization environments, LNCS (pp. 213–254). Berlin: Springer.
- Li, S., Dragicevic, S., Castro, F. A., Sester, M., Winter, S., Coltekin, A., … Cheng, T. (2015). Geospatial big data handling theory and methods: A review and research challenges. ISPRS Journal of Photogrammetry and Remote Sensing, 115, 119–133. doi:10.1016/j.isprsjprs.2015.10.012
- MacEachren, A. M. (1994). Visualization in modern cartography: Setting the agenda. In A. M. MacEachren & D. R. F. Taylor (Eds.), Visualization in modern cartography (pp. 1–12). Oxford: Pergamon.
- MacEachren, A. M., Gahegan, M., Pike, W., Brewer, I., Cai, G., & Hardisty, F. (2004). Geovisualization for knowledge construction and decision support. IEEE Computer Graphics and Applications, 24(1), 13–17. doi:10.1109/MCG.2004.1255801
- MacEachren, A. M., & Kraak, M.-J. (1997). Exploratory cartographic visualization: Advancing the agenda. Computers & Geosciences, 23(4), 335–343. doi: 10.1016/S0098-3004(97)00018-6
- MacEachren, A. M., & Kraak, M.-J. J. (2001). Research challenges in geovisualization. Cartography and Geographic Information Science, 28(1), 3–12. doi: 10.1559/152304001782173970
- McCormick, B. H., DeFanti, T. A., & Brown, M. D. (1987). Visualization in scientific computing. Computer Graphics, 21(6). Retrieved from https://www.evl.uic.edu/documents/visc-1987.pdf
- McMaster, R. B., & Usery, E. L. (Eds.). (2004). A research agenda for geographic information science (1st ed.). Boca Raton, FL: CRC Press.
- Mehl, M. R. (2006). Quantitative text analysis. In Handbook of multimethod measurement in psychology (pp. 141–156). Washington, DC: American Psychological Association.
- Moellering, H. (2000). The scope and conceptual content of analytical cartography. Cartography and Geographic Information Science, 27(3), 205–224. doi: 10.1559/152304000783547858
- Monmonier, M., & Gluck, M. (1994). Focus groups for design improvement in dynamic cartography. Cartography And Geographic Information Systems, 21(1), 37–47. doi: 10.1559/152304094782563948
- Munzner, T. (2009). A nested model for visualization design and validation. In IEEE transactions on visualization and computer graphics ( Vol. 15, pp. 921–928). Piscataway, NJ: IEEE Educational Activities Department. doi:10.1109/TVCG.2009.111
- Philbrick, A. K. (1953). Toward a unity of cartographical forms and geographical content. The Professional Geographer, 5(5), 11–15. doi: 10.1111/j.0033-0124.1953.55_11.x
- Richter, K.-F., Tomko, M., & Çöltekin, A. (2015). Are we there yet? Spatial cognitive engineering for situated Human-Computer Interaction. In CESIP 2015: Cognitive engineering for spatial information processes: From user interfaces to model-driven design. Workshop at COSIT 2015, October 12, 2015. Santa Fe, NM, USA.
- Slocum, T. A., Blok, C., Jiang, B., Koussoulakou, A., Montello, D. R., Fuhrmann, S., & Hedley, N. R. (2001). Cognitive and usability issues in geovisualization. Cartography and Geographic Information Science, 28(1), 61–75. doi: 10.1559/152304001782173998
- Stemler, S. (2001). An overview of content analysis. Practical Assessment, Research & Evaluation, 7(17).
- Straumann, R. K., Çöltekin, A., & Andrienko, G. (2014). Towards (re)constructing narratives from georeferenced photographs through visual analytics. The Cartographic Journal, 51(2), 152–165. doi: 10.1179/1743277414Y.0000000079
- Theus, M. (2005). Statistical data exploration and geographical information visualization. In Exploring geovisualization (pp. 127–142). Amsterdam: Elsevier.
- Thomas, J., & Kielman, J. (2009). Challenges for visual analytics. Information Visualization, 8(4), 309–314. doi: 10.1057/ivs.2009.26
- Thrower, N. J. W. (1996). Maps & civilization: cartography in culture and society. Library.
- Turner, A. J. (2006). Introduction to neogeography. O'Reilly Media. Retrieved from http://shop.oreilly.com/product/9780596529956.do?sortby=publicationDate
- Virrantaus, K., Fairbairn, D., & Kraak, M.-J. (2009). ICA research agenda on cartography and GIScience. Cartography and Geographic Information Science, 36(2), 209–222. doi: 10.1559/152304009788188772
Appendix 1
Summary of the community input ‘Persistent Problems in Geovisualization’
Geovisualization as a discipline [domain, meta thinking]
- Body of Knowledge [resource need, summarization]
○ Maybe we should have a committee (members should change, obviously) for writing a geovis book every other year? ‘Progress in Geovisualization’
- Value of Geovisualization [non-science, thinktank]
- Perspective, that is, providing tools/displays or rather thinking about perceiving/understanding representations/data [applied science]
- What are the research problems [resource need, thinktank]
Interdisciplinarity
- Taking advantage of technology development, ubiquitous computing [applied science]
- Scalability, limitations of technology [applied science, thinktank]
- Interaction with cognate research fields [coordination]
- Interaction with other relevant fields, do we know them, do they know us [coordination]
- Understanding of research questions in other fields [basic science]
○ Other disciplines mentioned: psychology, cognitive science, knowledge discovery and representation, computational linguistics
Data
- Data quality [applied-to-basic science]
- Informal data (VGI) [applied science, thinktank]
- Qualitative data [basic science]
- Data sharing, data availability [applied science]
- Complexity of data (see also Other problem areas) [basic-to-applied science]
- 2D vs. 3D data collection [applied science]
Uncertainty
- Realism vs. Abstraction [basic science]
- Influence on decision-making [basic science]
- Representation of uncertainty, fuzzy information, multifaceted/multi-sources of uncertainty, vague concepts, qualitative data [basic science] [applied science]
- Relevance of accuracy, ground level reality [applied science]
- Propagation of uncertainty in the geovisual analytics process [basic science]
Decision-making/outcomes
- Effect of design on decisions [basic-to-applied science]
- Influence of displays of uncertainty on decision-making [basic science]
- Necessary to map qualitative, affective, subjective, only loosely spatial, contextual, individual, emotional data for problem solving/decision-making [basic science] [applied science]
- Definition of ‘success’ – accurate, fast, insight, engagement, motivation, quality [basic science]
- What is insight, reporting of findings, definition of relevance [basic science]
- How to detect patterns, are we good at pattern detection and understanding (influenced, e.g. by outliers, gaps in the data) [basic science]
- ‘Knowledge’ extraction [basic science]
- Visual Analytics process, how to represent knowledge input/extraction of analyst during analysis process [applied science]
Other problem areas
- Levels of realism/abstraction, schematization, effects on decision, propagation, abstraction/generalisation of complex data (space/time/topic) [basic science]
- Modifiable unit problem (especially for temporal units, e.g. for different time variables), representation of granularity, scale, resolution [basic science]
- Understand cognitive aspects in reasoning tasks [basic science]
- Complexity: space/time/topic, large data/big data, including uncertainty/fuzziness/vagueness, multiple source, heterogeneity, long-term data and problems, hyperlinked data, dynamism [basic science]
- Streaming data [applied science]
Representations we do not know enough about yet [basic science]
- Space–time cube, other space–time representations
- Animations
- Schematizations
- Temporal maps
- Representations of semantics/relations between spatiotemporal objects
- Representations of qualitative, informal, textual data
- Transitions between different representations
- Combinations of heterogeneous, varying, dynamic, complex, multi-source, streaming data
- Representation of uncertainty (see also Uncertainty)
- 3D, virtual and augmented reality
- Interactive, hyperlinked, connected representations
- Mobile representations
Applications of geovisualization [applied science]
- What are application domains, for example, mobility, environment, hazards, geology, neighborhood analysis, sentiment analysis, population change, VGI, linguistics, knowledge representation
- Transferability between application domains
- Understand place and change in place
- Human’s role, individual space (privacy) vs. space for public in virtual urban environments
- Representations of heterogeneous spatiotemporal data on the web
- Big Data
- Large data sets to answer local questions
- RGB imagery to detect specific species
- Combination of data, for example, hyper-spectral with vectors or images from other sensors
- Photo-realism for environmental change
- Monitoring data, for example, truck drivers
- Influence of commercial ramifications
- SDIs, geo-portals
- Dynamic phenomena, moving fields, for example, smoke, thunderstorms
- Mobile applications
Use and users [basic science] [applied science]
- Personalization
- Analysis of usefulness, utility and usability (see also Evaluation), what concepts/categories are needed
- Interaction between users, tasks and displays
- Influence of different designs (e.g. colors), approaches, how to deal with misleading results based on unjudged influences
- Relevance, context dependency
- Eye candy vs. useful
- Interaction, interface design, interaction operators, scalability
- Expert vs. novice users, definition, influence, context knowledge, terminology
- Needs vs. tool-driven development
- Universal usability
- Usefulness/usability of non-expert designed interfaces
- Understanding the humans’ role(s)
- Mis-representations, misuse of tools
- Role of (functional) legend
- Communication vs. exploration, how to ensure most important information is perceived first versus exploration without hypothesis and thus no clue as to what to display how
- User-centred design, influencing factors (e.g. population characteristics, tasks)
- Utility vs. preference/familiarity
- Educating the users, for example, 3D, novel visualizations
Evaluation [methodological meta thinking]
- How to comprehensively evaluate Geovisualizations rather than with (disconnected, inconclusive) experiments, fragmented evaluation
- Efficient and effective ways of evaluation
- Tests with real world users
- Questions, definition of independent/dependent variables in testing, interpretation of variation, correlation vs. causality
- Unintended effects of design choices/tools
- Define outcomes (see also outcomes), how to measure
- Evaluation of interactive, hyperlinked, complex representations, operational performance
- Control/manipulation of time pressure
- Fairness of comparing new methods to established ones, for example, new interface may be slower but allow different insights
Evaluation results/goals [methodological meta thinking]
- Generalisation of findings, for example, from case studies
- Transferability of findings between application domains
- Long -lasting theory vs. rapid technological developments
- Define ‘better’, rather reasons than better/worse
Dissemination [non-science, coordination]
- Making Geovisualization more accessible through ‘entertainment’ – music, games, cinema, photo-realism, popularity and accessibility of Geovisualization
- Making Geovisualization available to a wide range of users, for example, K-12, policy-makers, stakeholders, community
- Willingness of potential users to adopt new tools/displays, culture
- Time and budget restrictions restrict developments and adoption, understanding commercial ramifications
- Communication of scientific results to non-scientific community
- Re-use of tools/displays with own data, in different application domain, being aware of tools and capabilities, self-service, user-driven
Matching problem/task – representation [basic-to-applied science]
- Which representations solves what problem/task or vice versa
- Context dependency
- Suitable visual analytics processes, long-term, complex, ill-defined problems/tasks, exploration
- Lack of guidance on Geovisualization techniques, for example, which ones are good for what and where are they implemented
- Methods and best practices for varying audiences