
ABSTRACT
This paper sheds light on the question of whether globes or maps are best suited to providing an adequate understanding of global phenomena. Drawing upon evidence from the history of cartography, we show how the ancient, medieval and early sixteenth-century mapmakers had already recognized the importance of globes and world maps. An analysis of Ptolemy, Strabo and the negotiations around the Treaty of Tordesillas will demonstrate how our basic assumptions regarding the relationships of globes and world maps have been present for a long time. These assumptions are discussed in the light of current user studies on world maps, for example on distance and area estimations and the issue of peripheral continuity. As we can see from this review of empirical research, designing an appropriate world map is not only an issue of map projection; the edge of a world map also affects the knowledge users may generate. In terms of the importance of ‘globes vs. world maps’, these findings indicate that globes are prominent because of their undistorted, but also seamless visualization of global phenomena.
RÉSUMÉ
Ce papier met en lumière la question de savoir qui des globes ou des cartes sont le plus adapté à la compréhension de phénomènes globaux. A partir de preuves issues de l’histoire de la cartographie nous montrons comment les cartographes de l’époque antique, du moyen âge et du début du XVIème siècle ont déjà reconnu l’importance des globes et des planisphères. Une analyse de Ptolémée, Strabon et des négociations autour du traité de Tordesillas démontre comment nos hypothèses simples sur les relations entre les globes et les planisphères existent depuis fort longtemps. Ces hypothèses sont discutées à la lumière des études utilisateurs actuelles sur les planisphères, par exemple en interrogeant l’estimation de la distance et de la surface ou la problématique de la continuité en périphérie. Comme on peut le voir dans cette analyse de la recherche empirique, concevoir un planisphère n’est pas uniquement une question de projection, le bord du planisphère impacte aussi les connaissances possiblement produites auprès des utilisateurs. SI on compare l’importance réciproque des globes par rapport aux planisphères, ces résultats indiquent que les globes sont préférés en raison de la non distorsion mais aussi de la visualisation sans bord des phénomènes globaux.
ZUSAMMENFASSUNG
Der vorliegende Beitrag widmet sich der Frage, ob sich zur Darstellung globaler Phänomene besser Globen oder Karten eignen. Ausgehend von Beispielen aus der Geschichte der Kartographie wird dargelegt, wie bereits seit der Antike die Bedeutung von Erdgloben und -karten diskutiert wurde. Anhand von Texten von Ptolemäus und Strabon, sowie durch eine Analyse der Verhandlungen um den Vertrag von Tordesillas wird deutlich, dass grundlegende Annahmen der Kartographie zum Verhältnis Globus vs. Karte bereits seit Jahrhunderten bestehen. Diese Annahmen werden im Lichte rezenter empirischer Studien zum Verständnis von Erdkarten und Globen hinterfragt. Dabei lässt sich zeigen, dass die Gestaltung einer geeigneten Erdkarte nicht nur ein Problem der Kartenprojektion ist. Vielmehr nehmen auch die Kartenränder einen wichtigen Einfluss auf das vom Kartennutzer erworbene Wissen. Empirische Erkenntnisse legen also nahe, dass die Bedeutung von Globen nicht nur in einer verzerrungsfreien, sondern vor allem auch in der kontinuierlichen Visualisierung globaler Phänomene liegt.
Introduction
‘A world view gives rise to a world map; but a world map in turn defines its culture’s view of the world’ (Brotton, Citation2014, p. 22). Defining maps as ‘graphic representations that facilitate a spatial understanding of things, concepts, conditions, processes, or events in the human world’ (Harley & Woodward, Citation1987, p. xvi), world views had already found their expression in the form of maps in prehistorical times. However, it was only when the Greeks began to comprehend the Earth as a spherical rather than a flat object that this world view gave rise to the globe: Approximately 2000 years ago, Crates of Mallus constructed the earliest known (since lost) terrestrial globe in the second-century BC, while the oldest (extant) celestial globe, known as the Farnese Atlas, dates from around AD 150 (Sumira, Citation2014).
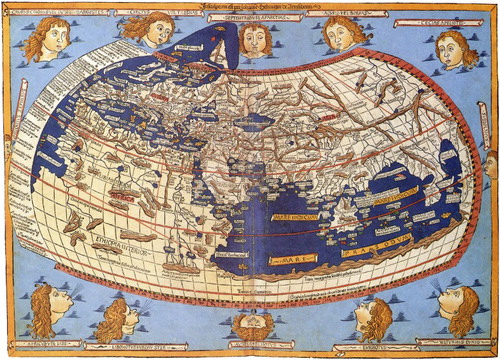
The conceptual model of the globe was defined in this period by scholars such as Eratosthenes, Euclid and, most prominently, Claudius Ptolemy (cf. Olwig, Citation2011): Ptolemy showed not only how to describe every position on Earth through a pair of spherical coordinates (i.e. latitude/longitude), but also how to transpose these coordinates from the spherical Earth onto a plane, providing three map projections for this purpose (cf. ).
Figure 1. Ptolemaic world map from the Geography (Johannes Schnitzer, 1482). Published in the public domain: https://en.wikipedia.org/wiki/Ecumene#/media/File:Claudius_Ptolemy-_The_World.jpg.
Ancient scholars who believed the Earth to be spherical challenged mapmakers in two main ways: Firstly, a spherical surface cannot be projected onto a plane map without generating distortions of areas, distances and/or angles, as proven by Gauss’s Theorema Egregium (Pressley, Citation2010). Secondly, there is (mathematically speaking) an infinite number of ways to portray the spherical Earth on a plane surface. Scientists from different fields have taken up this challenge over the last 2000 years, and today we can choose between several hundred projections whenever a map is required.Footnote1
However, this wide selection does not necessarily mean that we are spoilt for choice; cartographic practice is in fact dominated by just a few map projections, and there has been a constant (at times even heated) discussion regarding the most suitable way of mapping the world – especially over the last 50 years (cf. Monmonier, Citation2004; Šavrič, Jenny, White, & Strebe, Citation2015). However, the debate on world map projections shows at least three shortcomings: (1) discussion has focused mainly on map projections, while the second characteristic of each world map, namely the existence of edges, has been largely neglected so far; (2) the potential of undistorted visualization on globes is hardly taken into consideration; and (3) very little research has been conducted on how different map projections influence the user’s mind.
Against this background, we attempt to shed some light on these three ‘blind spots’ in a twofold manner: Drawing upon evidence from the history of cartography, we discuss in the following chapter how the importance of globes, maps and map edges was already recognized by the ancient, medieval and early sixteenth-century mapmakers. In a brief analysis of the studies of Ptolemy and Strabo, we outline how the issue of map distortion already accompanied the earliest projections, while the negotiations of the Treaty of Tordesillas provide an example of the importance of the edges of world maps. We discuss these examples from cartographic history in the light of recent empirical experiments on map distortion and map edges.
From sphere to plane
Map projections
In his publication Geography, Ptolemy not only describes three ways to map locations from a sphere onto a plane (cf. ), but also recognizes some limitations that are intrinsic to each world map:
Making the map on the globe gets directly the likeness of the earth’s shape, and it does not call for any additional device to achieve this effect, but it does not conveniently allow for a size [of map] capable of containing most of the things that have to be inscribed on it, nor can it permit the sight to fix on [the map] in a way that grasps the whole shape at once, but one or the other, that is, either the eye or the globe, has to be moved to give a progressive view [of the whole]. Drawing a map on a plane eliminates these [difficulties] completely; but it does require some method to achieve a resemblance to a picture of a globe, so that on the flattened surface, too, the intervals established on it will be in as good proportion [summetrias] as possible to the true [interval]. (Berggren & Jones, Citation2000, p. 82)
Up to the present day, most cartographers have adopted Ptolemy’s valuation of globes and maps without major concern, so that Ptolemy’s call for ‘good proportion’ has found expression in a multitude of different map projections. Furthermore, Ptolemy’s judgment on the limited practicality of the globe from 2000 years ago seems to remain valid in the current cartography: ‘They are expensive to make, difficult to reproduce, cumbersome to handle, awkward to store, and difficult to measure and draw on’ (Robinson, Morrison, Muehrcke, Kimerling, & Guptill, Citation1995, p. 60).
Ptolemy was neither the first to publish a Geography nor the first to bring up the issue of map projection. By the time of Christ’s birth, Greek scholar Strabo had published his Geographica, where he described the transformation of a sphere onto a plane surface as follows:
We have now traced on a spherical surface the area in which we say the inhabited world is situated; and the man who would most closely approximate the truth by constructed figures must needs take for the earth a globe like that of Crates, and lay off on it the quadrilateral, and within the quadrilateral put down the map of the inhabited world. But since the need of a large globe […] it is better for him to construct a globe of adequate size […] no less than ten feet in diameter. But if he cannot construct a globe of adequate size or not much smaller, he should sketch his map on a plane surface of at least seven feet. For it will make only a slight difference if we draw straight lines to represent the circles, that is, the parallels and meridians […] for our imagination can easily transfer to the globular and spherical surface the figure or magnitude seen by the eye on a plane surface. (Jones, Citation1917, p. 449)
Edges of world maps
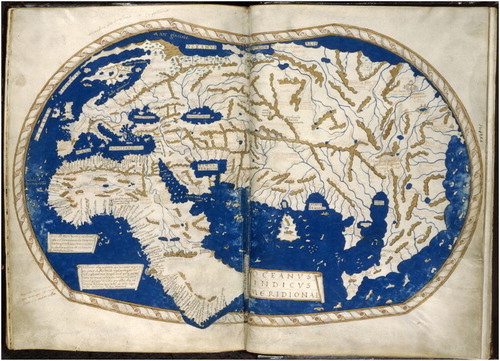
Early mapmakers like Ptolemy focused on the mathematical issues of projecting a spherical surface onto a plane in order to represent the world as it was then known, or supposed, on a map. However, the European worldview remained incomplete until the late fifteenth century; for example, in terms of the eastern and western edges of the Eurocentric world map as shown in .
Figure 2. World map of Henricus Martellus Germanus (1489). Published in the public domain and provided by the British Library from its digital collections: https://goo.gl/XvePNy.
Against the background of this incomplete worldview, Portugal (then the world’s leading naval power) and Castile signed the Treaty of Alcáçovas in 1479 in order to put an end to the War of the Castilian Succession (1475–1479). While this treaty does not explicitly define a line of demarcation between both empires, the Portuguese received the exclusive right of conquering territories ‘from the Canary island down’ (Davenport, Citation1917, p. 44; cf. , map 1). Sailing ‘down’, Bartolomeu Dias rounded the Cape of Good Hope in 1488, giving way to Vasco da Gama who reached India by sea in 1498.
Figure 3. Lines (or rather zones) of demarcation defined in the Treaty of Alcáçovas (A, map 1), the Treaty of Tordesillas (B, map 2) and the antimeridian of B resulting from the Treaty of Zaragoza (C, map 3); map 4 also shows the antimeridian of B in accordance with the current geographic knowledge (i.e. C1 = A + 180° of longitude) together with the Moluccas (M).
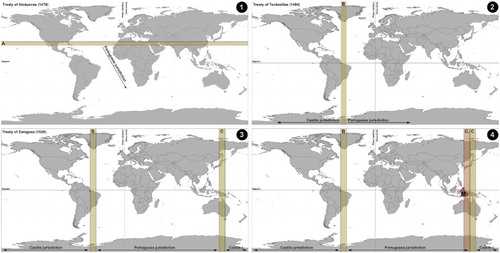
Knowledge of both the existence of land mass in the east (incl. the so-called Dragon’s Tail) and the spherical shape of the Earth, together with the prohibition of access to the southern Atlantic (as contracted within the Treaty of Alcáçovas), motivated Italian navigator Christopher Columbus to search for a new, westward route to the Indies: He departed from Spain in August 1492 and a few months later reached what are now the Bahamas, Cuba and Hispaniola. His return to Spain in early 1493 immediately posed the question of ownership of these newly discovered territories. The following negotiations between Spain and Portugal resulted in the Treaty of Tordesillas in 1494 (, map 2) where both kingdoms agreed:
[…] that a boundary or straight line be determined and drawn north and south, […] from the Arctic to the Antarctic pole. This boundary or line […] shall be drawn at a distance of three hundred and seventy leagues west of the Cape Verde Islands […]. And all lands […] discovered hereafter by the said King of Portugal […] on the eastern side of the said bound […] shall belong to, and remain in the possession of, and pertain forever to the said King of Portugal and his successors. And all other lands […] on the western side of the said bound shall belong […] to the said King and Queen of Castile, Leon, etc. and to their successors. (Davenport, Citation1917, p. 95)
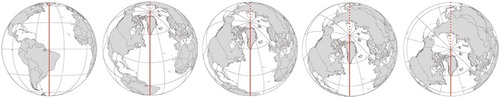
If we visualize the results from the Treaty of Tordesillas on a modern world map (cf. , map 2), the negotiated compromise looks feasible at first glance: The world had been split in a manner that protected both the Portuguese interest in the eastern trade routes and the Spanish claims in the New World. However, if we visualize the map drawn in on a globe, it becomes clear that the negotiators of the treaty had not planned beyond the edge of the map (). A single line may be enough to divide a world map into two parts, but on a global level, this line only defined a new prime meridian, from which both contracting parties began to measure. Hence, from 1494 onwards, the Portuguese navigated eastward and the Spanish westward from the new division line – and encountered each other once again on the opposite side of the globe just 25 years later.
Figure 4. Visualizing the demarcation line from the Treaty of Tordesillas on a southward rotating globe. The demarcation (solid) line is only defined ‘from the Arctic to the Antarctic pole’ (Davenport, Citation1917, p. 95). On the globe, this shortcoming, which is easily missed on a world map (), becomes evident, since no antimeridian (dashed line) was defined in the treaty.
Two important voyages hastened the encounter: On the one hand, Vasco da Gama reached India by sea in 1498, which allowed the Portuguese to push further eastward, discovering the Moluccas in 1512. On the other side, Ferdinand Magellan (expanding the ideas of Columbus) believed he could also reach the Moluccas by sailing westward around the southern tip of the American continent. Several authors point to the globe as an important argument for Magellan’s decision: De Las Casas (Citation1986/1527–1561), for instance, recalls a meeting where the navigator explained to him the intended route on a well-painted globe (‘un globo bien pintado’; De Las Casas (Citation1986/1527–1561), p. 368). Moreover, Hennig (Citation1948) argues for Magellan’s familiarity with the work of Martin Behaim, author of the oldest surviving terrestrial globe from 1492; it should be noted that the cartographic content of Behaim’s globe is remarkably similar to the world map shown in .
To summarize the importance of a spherical representation of the Earth for Magellan’s worldview, we can cite Brotton, who stated that
…] for pilots like Magellan, the spherical projection of a terrestrial globe allowed him to think outside the geographical mentality of his time. While most princes and diplomats in Portugal and Castile continued to envisage the world on a flat map, with no real sense of the connection between the earth’s western and eastern hemispheres, Magellan’s planned voyage suggests that he was beginning to imagine the world as a global continuum. (Citation2014, p. 156)
Magellan’s assumption proved true: His fleet circumnavigated South America in 1520, and reached the Moluccas almost a year later, although Magellan himself was killed on the voyage. Once arriving at the Moluccas, on-site longitude calculations led the Spaniards to believe that the archipelago was 19° within their agreed half of the globe. As soon as the remaining ship reached Spain (still sailing westward and thus completing the first circumnavigation of the Earth), both Portugal and Castile claimed the Moluccas to be within their zone of the Treaty of Tordesillas. Due to lacking and imprecise geographic knowledge and cartographic material, the opposing parties could neither prove their own viewpoint, nor disprove that of the opposite party. Finally, after seven years of unsuccessful negotiation, the differences were reconciled pragmatically: Degrees of longitude were translated into money and the Spanish Crown relinquished its claims to the Moluccas upon payment.
To formalize the agreement, a new, second division line was defined in the Treaty of Zaragoza ‘east nineteen degrees from Molucco’ (Davenport, Citation1917, p. 188), positioning the archipelago clearly in the Portuguese domain. Considering a level of precision similar to the line of demarcation defined in the Treaty of Tordesillas, we can assume the division agreed upon in 1529 to be located at 142°E ± 4° (see section C in , map 4). This means, on the one hand, that the Treaty of Zaragoza did not produce two equal hemispheres, but rather advantaged the Portuguese zone of influence. On the other hand, if we consider the present precisely known position of the Moluccas (e.g. the location of Halmahera, the largest island of the archipelago at 127.5°E), the Portuguese most probably would have been right in any case: Adding 180° (i.e. a hemisphere) to the 1494 division line, located at 46°W ± 4°, the antimeridian in the Pacific Ocean should have been drawn at 134°E ± 4°, leaving the majority of the Maluku Islands in the Portuguese part of the world (see section C1 in , map 4).
The conflict on the partition of the globe during the early sixteenth century was finally solved not by cartographic, but rather by economic arguments. However, it is one of the finest examples in cartographic history to show that the projection of the Earth onto a plane map results not only in geometrical distortion, but also disrupts the world’s continuity – sometimes even conceptually in the form of world views limited by map edges. As we shall see in the next section, the correct understanding of how to connect (e.g. left and right) edges of a world map remains a problem for many users.
Empirical research on world maps and globes
In the previous chapters, we have seen that the understanding of the Earth’s spherical form established more than 2000 years ago was paralleled by the insight that the surface of this sphere can be represented both on a globe and on a map. However, for practical reasons, cartographers always favored plane world maps, consciously accepting the geometrical distortions inherent to each map.Footnote2 Even modern cartographic textbooks and syllabi pay only limited attention to both real and virtual globes (e.g. Kraak & Ormeling, Citation2010; Robinson et al., Citation1995).
The second consequence of projecting a spherical body onto a plane, namely the rupture of a continuous surface along the map edges was of little importance to early mapmakers since their geographical knowledge was regional rather than global. Only the expeditions of the fifteenth and sixteenth centuries ‘would require both Europe’s empires and its mapmakers to start to imagine the world globally, projected onto a sphere, rather than flat on a map’ (Brotton, Citation2014, 154). The events surrounding the Treaty of Tordesillas are prime examples of how map edges can affect division and views of the world.
Following Ptolemy’s call for ‘good proportion’ and assuming (like Strabo) that map users can easily transfer information cut out on a world map back on the continuous surface of the Earth globe, post-medieval cartography focused its efforts on the production and discussion of an ever-growing number of map projections: While the Renaissance mapmaker could choose between 16 ways of transforming the Earth onto a plane, late twentieth-century cartographers already had 265 projections at hand (Snyder, Citation1997). From these 265 ways of mapping the Earth’s surface onto a plane, only a few projections predominate in small-scale cartography. Šavrič et al. (Citation2015), for instance, conducted an empirical study based upon only nine map projections commonly used in atlases, showing that both general map readers and professionals prefer the Robinson projection.
Over the last 50 years, the constant discussion has been held regarding the most suitable way of projecting the Earth onto a map; the Peters projection has become a famous example of how the antique maxim of ‘good proportion’ can be interpreted quite differently. Interestingly enough, although cartographers explicitly or implicitly claimed to map the world for the benefit of the user, the user was hardly ever taken into consideration in the form of empirical studies, not even by the academically organized twentieth-century cartography.
While the problem of map distortion was considered, at least practically, in the form of different projections, the issue of the edges of world maps has been completely ignored by theoretical cartographers and mapmakers alike. The same applies to the globe, which has been excluded from a scientific debate for the practical reasons quoted above, although these disadvantages have lost relevance since 2000 at the latest, with the dawn of virtual globes and spherical displays (usable as hyperglobes; cf. Riedl, Citation2011). Against this background, we discuss in the subsequent sections empirical studies of the spatial knowledge acquired from world maps and globes. This allows us to better understand which lessons can be learned from the historical case studies presented in chapter 2, and to determine the questions that remain to be answered by modern mapmakers.
User studies on map projections
Advertised as one of the most important innovations in over 400 years of mapping the world, German historian Arno Peters presented in 1973 a ‘new cartography’, whose centerpiece was a cylindrically projected equal area world map. Peters explicitly presented his map as an alternative to the Mercator projection, which had been published in 1569 for navigation purposes but ‘[…] became the standard world map for nineteenth-century atlases and wall maps’ (Monmonier, Citation2004, p. 122f). While Peters denounced the Mercator projection with its poleward increasing distortion of area as a symbol of European imperialism and Eurocentric world view, cartographers harshly criticized both Peters’ argument and projection; even prestigious mapmakers such as Arthur H. Robinson did not shy away from ridiculing the Peters map, describing it as ‘somewhat reminiscent of wet, ragged, long, winter underwear hung out to dry on the Arctic circle’ (Citation1985, p. 104). Since a detailed description of this controversy (the aftereffects of which are still noticeable in the cartographic literature) is beyond the scope of this paper, the interested reader is referred to Vujakovic (Citation2003) and Monmonier (Citation2004) for a comprehensive review on these map wars.
Heavily and perseveringly discussed, the problem underlying the Peters projection controversy remains unresolved. Since both parties abstained from presenting empirically founded arguments, we still lack an in-depth understanding of how to visualize global phenomena in the most comprehensible manner. Nevertheless, we can cite several studies undertaken in the recent years that demonstrate that user tests actually provide suitable tools to further our understanding of how spatial knowledge is shaped through our cartographic representations of the world.
A study that directly addressed the central issue of the discussion provoked by Peters was published by Battersby and Montello (Citation2009). The authors began their experiment with area estimates, under the assumption that the areal distortion on common world maps should generate distortion in the users’ mental maps, resulting in corresponding estimation errors. However, this hypothesis was proved to be wrong since the participants actually estimated the areas of different world regions relatively well: ‘Thus, we found no evidence for a Mercator Effect in our studies, which would lead to increasing estimates of area as landmasses become more distant from the equator’ (Battersby & Montello, Citation2009, p. 288).
Positional rather than areal knowledge was investigated by Friedman and Brown (Citation2000): Participants were asked to estimate the latitude and longitude of African, American and European cities. The results obtained from this study indicated that the probands draw on experience gathered from different and hierarchically organized sources. This knowledge is combined with multiple representations, which allow for reasoning processes such as the following:
For example, a person attempting to estimate the latitude of Athens, Greece might know that Greece has a warm climate and that countries with warm climates tend to be close to the equator. This implies that Greece, and hence Athens, is relatively close to the equator. Moreover, because Greece is in Europe and Europe is north of the equator, Athens must also be north of the equator. However, because Greece has a warm climate, it cannot be too far north. Thus, an estimate of 15° north might seem reasonable, although it is incorrect (the actual latitude of Athens is 38° north). (Friedman & Brown, Citation2000, p. 195)
User studies on the edges of world maps
Compared with the empirical research conducted on the effects of projection and distortion, knowledge regarding the cognitive function of map edges is even less complete. Using sketch maps, Saarinen (Citation1987) analyses where a typical world view is centered by probands from different parts of the world. On a global level, the results of this study indicate that Eurocentric world maps are the most popular, since they were drawn by 79% of the participants (cf. ). However, closer examination at the regional level shows that Eurocentric maps dominate in the Americas, Europe and Africa, but Sinocentric maps prevail among participants from East Asia and Oceania.
Figure 5. Habitual worldviews of map users, differentiated by Eurocentric (79%), Sinocentric (11%) and Americentric (7%) sketch maps (cf. Saarinen, Citation1987, p. 34).
These findings are interesting for two reasons: On the one hand, a world map’s center determines the location of its edges, for example, while the edges of a Eurocentric world map will probably cut through the Pacific, a Sinocentric map will intersect the Atlantic Ocean (cf. ). On the other hand, and with regard to the aforementioned discussion of the Peters projection, Saarinen’s results suggest that the Eurocentrism criticized by Peters might itself have been a child of Eurocentrism: while other world regions adapt and center world maps to their own needs, Mercator and Peters (both Europeans) aligned their projections with their home continent.
While Saarinen treats the function of the edges of world maps only indirectly, Hennerdal (Citation2015) examines this issue more explicitly. The test design used by Hennerdal for this purpose is surprisingly straightforward: World maps of five different projections show an airplane crossing the edge of the map. Under this scenario, each test person is asked to highlight where the airplane will reappear on the map after passing the map’s edge (cf. ). Testing both children and adults Hennerdal uses this test design to examine, whether or not a map user understands peripheral continuation at map edges. Results of the study show that most users have a rather naïve understanding of how to mentally connect opposite edges of a world map, caused by a systematic misapplication of Euclidean geometry to world maps:
In Euclidean geometry, the shortest path between any two points on a plane is the straight line segment connecting them. If we inaccurately apply this theorem to a world map, where non-Euclidean spherical geometry should be used, and combine this with the understanding that if we continue in the same direction to complete a lap around the world, we will come back to the same place from the other direction, then, we will acquire the naïve idea that the peripheral continuation of the route is along the straight line that continues tangentially to the original route where it crosses the edge. […] If the Euclidean-based understanding of great circles is followed, the peripheral continuity would always be perceived as linear. Because the surface of the round world is non-Euclidean and great circles are not always presented as straight lines on a world map, this perception does not always correspond to the actual case. (Hennerdal, Citation2015, p. 776f)
Figure 6. Linear and actual peripheral continuity demonstrated on world maps with Robinson (map A) and Lambert azimuthal equal-area projection (map B) (cf. Hennerdal, Citation2015).
Edges not only complicate the understanding of continuity between different sides of a world map, but also influence estimation of distances: Within a comparative study of globes and maps, Hruby and Riedl (Citation2013) noticed that map edges affect the quality of distance estimates. Depending on whether or not the shortest path connection between two locations crosses the right or left edge of a world map, distances tend to be over- or underestimated.
This observation was investigated more systematically in a follow-up study by Hruby, Avelino, and Ayala (Citation2016): Probands were asked to memorize the locations of 10 cities, including five North American and five Asian locations. One group learnt these locations from a Eurocentric world map, while the second group used an Americentric map (cf. left and right maps in ). Both map designs share projection and scale, thus differing from each other only in regard to the longitudes of the map’s center and edges. Once the names of all the cities had been memorized, participants were asked to estimate distances between five pairs of locations from memory. Since each pair was formed by a North American and an Asian city, the Eurocentric test group had to consider the western map edge for an appropriate estimate, while the Americentric group could ignore such visual discontinuities in their reference map.
The findings of this study show that it makes a significant difference whether locations are learnt from an Americentric or a Eurocentric world map: While the majority of test persons reported greater familiarity with Eurocentric maps (in accordance with the aforementioned study by Saarinen (Citation1987)), all of the distances were estimated more exactly when learned from an Americentric world map. This result indicates that map users memorize spatial information on world maps as a function of where the map is cut and centered, respectively. Hence, the quality of a world map depends not only on the projection chosen, but also on its edges and alignment.
Conclusion – globes vs. maps: a question of paradigm?
The question of ‘globes vs. maps’, at least as it is addressed in the current cartographic textbooks, was already basically answered 2000 years ago: Ancient scholars who had accepted the Earth to be spherical discussed both globes and world maps as possible forms of representation, but soon favored maps for several reasons: Globes were considered as inconvenient and inefficient by showing just one hemisphere at a time, while a world map presents the entire Earth at a glance. Distortions that unavoidably occur during the process of map projection were viewed more as a challenge than a problem. Furthermore, Strabo had already assumed that map users could mentally reproject the information gleaned from a map with no problem.
If we follow the course of the history of cartography, especially during the nineteenth and twentieth centuries when cartography moved to the mainstream of academia, it seems that Ptolemy had already established a cartographic paradigm some 2000 years previously. According to Thomas Kuhn, a paradigm represents ‘universally recognized scientific achievements that, for a time, provide model problems and solutions for a community of practitioners’ (Citation1970, p. viii). This citation describes precisely the function of the world map for cartographers to date: The world map has been accepted as a model solution, which is not questioned by the scientific community but rather modified and extended by a still growing number of map projections.
If we accept this idea of the world map as a paradigmatically established solution, it is no surprise that discussion regarding the most appropriate projection has been limited to the issues of distortion. The fact that a map, besides deforming a spherical object, also interrupts the continuous surface was, at best, a theoretical problem for ancient mapmakers who had only limited and regional geographic knowledge. While cartographers from the sixteenth century onwards successively filled up even the farthest corner of the map sheet, only a few scholars thoroughly examined the location and function of these corners and edges – among them Charles Sanders Peirce, who presented his quincuncial projection in Citation1879.
While the issue of the world map’s edges and their possible influence on the knowledge gathered by the map reader has been widely neglected by mainstream cartography, history also provides examples of this issue. As we have seen from the case of the Treaty of Tordesillas, a world map not only visually interrupts the Earth surface but may also restrict solutions for actual global problems to the limits of a map sheet. Just as the map is not the territory (Korzybski, Citation1933), the world map is not the Earth but it can influence the worldview(s) that guide our thoughts and actions.
In summary, we demonstrate that the history of cartography offers several clues with which to better understand the importance of both the distortions and edges of world maps. However, over a period of 2000 years, cartographers have not investigated these clues in a systematic manner. Again in the terms of the Kuhnian concept of paradigm, we can state that it was not the members of the traditional community of cartographic practitioners, but rather researchers from outside the subject area and scholars from an interdisciplinary background, e.g. from the field of spatial cognition research (cf. Montello, Citation2002), who began to shed some light on the function of world maps and also, therefore, on the question of ‘globes vs. maps’.
A lesson learned from these empirical studies is that the cognitive impact of the geometric distortion inherent in world maps has possibly been overestimated, just as the effect of the edges of world maps is still underestimated by cartographers. With this in mind, another lesson still to be learned by mapmakers is not to rely uncritically on cartographic customs. Empirically testing the impact of established visualization techniques can help us to better understand the worldviews adopted by users of cartographic products. As we have seen in this paper, we can find rich examples throughout the history of cartography of how both maps and globes act to shape the spatial mind and the worldview of the user.
Disclosure statement
No potential conflict of interest was reported by the authors.
Notes on contributors
Dr Florian Hruby is CONACyT research fellow at the National Commission for the Knowledge and Use of Biodiversity (CONABIO) in Mexico City; Lecturer at the Department of Geography and Regional Research, Cartography and Geoinformation at the University of Vienna; Co-editor of meta-carto-semiotics – Journal for Theoretical Cartography.
Dr Andreas Riedl is Assistant professor at the Department of Geography and Regional Research, Cartography and Geoinformation of the University of Vienna; Head of Hyperglobe Research Group (HRG).
Notes
1 While in-depth discussion and typologies of map-projections and transformations are beyond the scope of this paper, the interested reader is referred to the cartographic textbooks and technical literature on map projections (cf. Robinson et al., Citation1995; Snyder, Citation1997; Maling, Citation2013).
2 Readers wondering about the cartometric usability of globes and world maps are reminded that, for instance, a 30-cm Ø globe shows the Earth at a scale of ca. 1:42,500,000, roughly comparable with the scale of a world map in a paper printed atlas. At such a scale, even an area of 1 mm2 represents ca. 180 km2, which predestines both globes and world maps more for relative comparison and ‘world-viewing’ than for absolute and precise measurement.
3 Readers with a special interest in this particular topic are also referred to Carbon and Hesslinger (Citation2013), who show that even user attitudes can affect estimates of distance.
References
- Battersby, S. E., & Kessler, F. (2012). Cues for interpreting distortion in map projections. Journal of Geography, 111(3), 93–101. doi: 10.1080/00221341.2011.609895
- Battersby, S. E., & Montello, D. R. (2009). Area estimation of world regions and the projection of the global-scale cognitive map. Annals of the Association of American Geographers, 99(2), 273–291. doi: 10.1080/00045600802683734
- Berggren, J. L., & Jones, A. (2000). Ptolemy’s geography: An annotated translation of the theoretical chapters. Princeton, NJ: Princeton University Press.
- Brotton, J. (2014). A history of the world in 12 maps. London: Penguin.
- Carbon, C. C., & Hesslinger, V. M. (2013). Attitudes and cognitive distances: On the non-unitary and flexible nature of cognitive maps. Advances in Cognitive Psychology, 9(3), 121–129. doi: 10.5709/acp-0140-y
- Davenport, F. G. (1917). European treaties bearing on the history of the United States and its dependencies to 1648. Washington, DC: Carnegie Institution of Washington.
- De Las Casas, B. (1986/1527–1561). Historia de las Indias. Caracas: Fundación Biblioteca Ayacuch.
- Friedman, A., & Brown, N. R. (2000). Reasoning about geography. Journal of Experimental Psychology: General, 129(2), 193–219. doi: 10.1037/0096-3445.129.2.193
- Friedman, A., & Montello, D. R. (2006). Global-scale location and distance estimates: Common representations and strategies in absolute and relative judgments. Journal of Experimental Psychology: Learning, Memory, and Cognition, 32(2), 333–346.
- Harley, J. B., & Woodward, D. (1987). The history of cartography (Vol. 1). Chicago, IL: The University of Chicago Press.
- Harrisse, H. (1897). The diplomatic history of America. Its first chapter. London: Stevens.
- Hennerdal, P. (2015). Beyond the periphery: Child and adult understanding of world map continuity. Annals of the Association of American Geographers, 105(4), 773–790. doi: 10.1080/00045608.2015.1022091
- Hennig, R. (1948). The representation on maps of the magalhães straits before their discovery. Imago Mundi, 5, 33–37. doi: 10.1080/03085694808591902
- Hruby, F., Avelino, M. C., & Ayala, R. M. (2016). Journey to the end of the world Map – How edges of world maps shape the spatial mind. GI_Forum 2016, 1, 314–323.
- Hruby, F., & Riedl, A. (2013). Maps versus globes–distance estimation on flat and spherical displays. Kartographische Nachrichten, 63(4), 205–209.
- Jones, H. L. (1917). The geography of Strabo ( Loeb Classical Library, Vol. 1). Harvard University Press. Retrieved from http://penelope.uchicago.edu/Thayer/E/Roman/Texts/Strabo/2E1*.html
- Korzybski, A. (1933). Science and sanity: An introduction to non-Aristotelian systems and general semantics. New York, NY: International Non-Aristotelian Library Publishing Company.
- Kraak, M. J., & Ormeling, F. (2010). Cartography: Visualization of geospatial data. London: Routledge.
- Kuhn, T. S. (1970). The structure of scientific revolutions. Chicago, IL: University of Chicago Press.
- Maling, D. H. (2013). Coordinate systems and map projections. Oxford: Pergamon Press.
- Monmonier, M. (2004). Rhumb lines and map wars: A social history of the Mercator projection. Chicago, IL: University of Chicago Press.
- Montello, D. R. (2002). Cognitive map-design research in the twentieth century: Theoretical and empirical approaches. Cartography and Geographic Information Science, 29(3), 283–304. doi: 10.1559/152304002782008503
- Olwig, K. R. (2011). The earth is not a globe: Landscape versus the ‘globalist’ agenda. Landscape Research, 36(4), 401–415. doi: 10.1080/01426397.2011.582940
- Peirce, C. S. (1879). A quincuncial projection of the sphere. American Journal of Mathematics, 2(4), 394–396. doi: 10.2307/2369491
- Pressley, A. (2010). Gauss’ Theorema Egregium. In A. Pressley (Ed.), Elementary differential geometry (pp. 247–268). London: Springer.
- Riedl, A. (2011). Digital globes: Their historical development. Globe Studies, 57/58, 149–161.
- Robinson, A. H. (1985). Arno Peters and his new cartography. The American Cartographer, 12(2), 103–111. doi: 10.1559/152304085783915063
- Robinson, A. H., Morrison, J. L., Muehrcke, P. C., Kimerling, A. J., & Guptill, S. C. (1995). Elements of cartography. New York, NY: Wiley.
- Saarinen, T. F. (1987). Centering of mental maps of the world. Tucson: ERIC Clearinghouse.
- Snyder, J. P. (1997). Flattening the earth: Two thousand years of map projections. Chicago, IL: University of Chicago Press.
- Sumira, S. (2014). Globes: 400 years of exploration, navigation, and power. Chicago, IL: University of Chicago Press.
- Šavrič, B., Jenny, B., White, D., & Strebe, D. R. (2015). User preferences for world map projections. Cartography and Geographic Information Science, 42(5), 398–409. doi: 10.1080/15230406.2015.1014425
- Vujakovic, P. (2003). Damn or be damned: Arno Peters and the struggle for the ‘new cartography’. The Cartographic Journal, 40(1), 61–67. doi: 10.1179/000870403235002105