
 ?Mathematical formulae have been encoded as MathML and are displayed in this HTML version using MathJax in order to improve their display. Uncheck the box to turn MathJax off. This feature requires Javascript. Click on a formula to zoom.
ABSTRACT
Stellite alloys have good wear resistance and maintain their strength up to ~ 600°C, making them suitable for various industrial applications like cutting tools and combustion engine parts. This investigation was aimed at i) manufacturing new Stellite alloy blends using powder metallurgy and ii) mathematically mapping hardness, yield strength, ductility and impact energy of base and alloy blends. Linear, exponential, polynomial approximations and dimensional analyses were conducted in this semi-empirical mathematical modelling approach. Base alloy compositions similar to Stellite 1, 4, 6, 12, 20 and 190 were used in this investigation to form new alloys via blends. The microstructure was analysed using Scanning Electron Microscopy (SEM) and X-ray Diffraction (XRD). Mechanical performance of alloys was conducted using tensile, hardness and Charpy impact tests. MATLAB® coding was used for the development of property maps. This investigation indicates that hardness and yield strength can be linked to the wt.% composition of carbon and tungsten using linear approximation with a maximum variance of 5% and 20%, respectively. Elongation and carbide fraction showed a non-linear relationship with alloy composition. Impact energy was linked with elongation through polynomial approximation. A dimensional analysis was developed by interlinking carbide fraction, hardness, yield strength, and elongation to impact energy.
1. Introduction
Stellite alloys are cobalt base ternary alloys which use chromium with tungsten or molybdenum as the main alloying elements. Carbon content in these alloys dictates carbide formation. These alloys are used to resist wear, oxidation and corrosion in harsh lubrication starved and high temperature environments [Citation1,Citation2]. The chemical composition and the manufacturing route of these alloys influence the structure property relationships and thus their industrial applications. These structure property relationships rely on optimising the combination of hardness, toughness, fatigue resistance and yield strength along with microstructural features such as carbide size and distribution, solid solution strengthening and chemical composition influencing corrosion, wear and oxidation [Citation3,Citation4]. Base Stellite alloys exhibit excellent resistance to wear, galling, corrosion, and oxidation [Citation2,Citation3,Citation5–8]. Some of these alloys maintain these properties at elevated temperatures up to 600 °C. They were earlier used in cutting tools, hard-facing and corrosion-resistant casting but currently form a crucial part of power generation, steel manufacturing, chemical processing, oil and gas and marine industries [Citation4,Citation9–11]. These alloys can be manufactured through different techniques such as casting, surface coating, and powder metallurgy (Hot Isostatic Press, HIP), making them attractive for industrial applications [Citation2–11]. Although these alloys’ composition and manufacturing route have long been researched to optimise their performance for various industrial applications, there has been limited research in forming new alloy blends using the base Stellite alloys. This paper, therefore, considers structure property relationships of new alloy blends made from base Stellite alloys.
Most conventional alloys developed for manufacturing techniques such as powder bed fusion or powder metallurgy are alloyed in the melt before powders are obtained from atomisation. However, the atomisation process is expensive and tedious, limiting the alloy variations that can be studied in alloy development. Mechanical Alloying (MA) is a solution to overcome this limitation where metal and/or metal oxides can be alloyed [Citation12]. MA is a solid-state powder manufacturing technique where powder particles undergo repeated cold welding, fracturing and re-welding in a ball mill. The powder is then consolidated through solid-state processing like sintering or hot isostatic pressing. One of the most successfully MA materials is oxide dispersion strengthened Fe-base and Ni-base superalloys for the aerospace industry, where this technique has been used to manufacture various materials [Citation13]. Recent research shows that MA has also been utilised to manufacture high entropy alloys (HEAs) [Citation14], nanocomposites [Citation15], nanocrystalline materials [Citation16], oxide dispersion strengthened (ODS) steel [Citation17] and a variety of other materials classes [Citation18], which shows the superiority over conventional alloying for selected applications. MA can be used to blend elemental powders, which can give unique properties, and it becomes important to develop mathematical models to correlate composition with properties [Citation19].
Mathematical models relating chemical composition to the property are critical in reducing the time and effort required to develop complex alloys. Machine Learning (ML) is one such model that can guide high-throughput experiments to map and optimise new alloy systems for each target property [Citation20]. This approach provides a new knowledge-based framework design to tailor Compositionally Complex Materials (CCMs, both alloys and ceramics) with the required combination of tribo-mechanical properties. Both mechanical and tribomechanical modelling of alloys and coatings has also been attempted using the semi-empirical design approach, where both mechanical properties and derived performance parameters such as fatigue and wear resistance can be modelled [Citation1].
The superior strength and wear resistance of Co-based alloy is due to the localised FCC (face centred cubic) to HCP (hexagonal closely packed) transformation during deformation, solid solution strengthening by tungsten and the formation of hard Cr/W-rich carbides [Citation4]. The structure-property relationships, along with tribological evaluations of Stellite alloys manufactured using casting [Citation21–26], HIPing [Citation22–26] or re-HIPing [Citation21,Citation23] were previously reported. A recent investigation by Ahmed et al. [Citation19] considered structure-property relationships of new-Cobalt based alloy manufactured by blending standard Stellite powders. Cobalt alloys manufactured by blending can be tailored for specific industrial applications, which can be cost-effective. This paper utilises different Stellite alloys, which are first blended in different proportions in their powder form and then consolidated using HIPing, followed by an evaluation of microstructure and mechanical properties. The blending allows for varying the alloying elements C, Cr, and W, which are then correlated with the mechanical properties of the alloy. The experimental data points from the properties obtained were then utilised to form mathematical models. Different approximations such as linear, polynomial and exponential were explored to analyse properties and their results are presented and discussed. This research aimed to develop models to predict the properties of a new HIPed Stellite alloy with given chemical composition. This is the first modelling work to address the quantitative correlation between alloying elements and the mechanical properties of Stellite alloy blends.
2. Methodology
2.1. Material
Three alloy groups (blend A, B and C) were considered in this study and are summarised in . Each group consisted of two base alloys and blend alloys, which were blends of the base alloys with different blend ratios, such as 25/75, 50/50 and 75/25 in wt.%. The chemical composition was provided by Deloro Stellite (UK) and measured using ICP-OES (inductively coupled plasma-optical emission spectroscopy) with specific standards developed for Stellite alloys and validated via wet chemistry. The powders were gas atomised and mixed using standard industrial powder blending techniques. For the blends of the base alloys, they were blended by tumbling in a powder hopper as described in the patent by Saveker [Citation27]. This was followed by HIPing which was carried out for a soaking temperature of 4 hours at a temperature and pressure of 1200 °C and 100 MPa, respectively.
Table 1. The chemical compositions of the HIPed Stellite alloys and blends A, B and C in wt.%.
2.2. Scanning electron microscopy (SEM) and energy dispersive x-ray spectroscopy (EDS)
The microstructure of Stellite alloys was observed using SEM with back-scattered electron (BSE) and secondary electron (SE) detectors. The HIPed Stellite alloy samples were prepared in a manner to minimise the strain-induced phase transformation from FCC to HCP during the mechanical polishing operations [Citation28]. The chemical compositions of the phases identified from the microstructure were examined using the EDS.
The SEM images, particularly in the BSE mode of operation, present a clear brightness contrast between the individual phases, e.g. Cr-rich carbides, W-rich carbides, and Co-rich matrix. Therefore, using the image analysis software (ImageJ), the area fractions of each phase identified from the SEM image were computed.
2.3. Hardness, tensile and Charpy impact tests
The Vickers hardness of Stellite alloys was measured at both macro- and micro-level. A conventional Avery hardness tester was used for macro-hardness measurement under 294 N (30 kgf) load. The micro-hardness was measured on the MVK-H1 hardness tester under a 2.94 N (300 gf) load. Five measurements on the macro-hardness and ten on the micro-hardness were conducted on each alloy.
The tensile tests were carried out on an Instron tensometer following the BS EN 10,002 standard [Citation29]. The dumbbell-shaped specimens, with 25 mm gauge length and 4 mm diameter, were used in this investigation. The tests were conducted at 0.05 mm/min, equalling a strain rate of 0.000033 s−1. Three tests were conducted on each alloy. The fracture sections were examined via SEM.
The Avery Charpy impact tester was used in this investigation. The maximum capacity of the machine was 298 J (220 ft. lb). All samples were unnotched, with dimensions of 10 mm × 10 mm × 55 mm. The impact rate was 5 m/s (16.5 ft/sec). Three tests were conducted on each alloy, and averaged values are reported.
2.4. Mathematical modelling
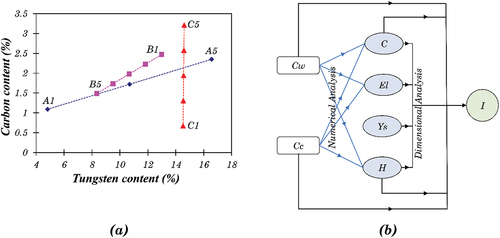
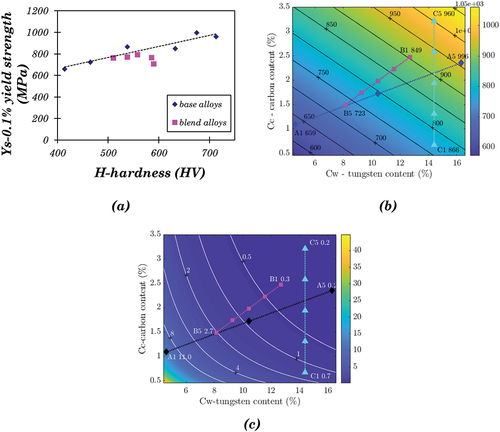
The Stellite alloys investigated in this project have carbon content ranging from 0.67 (C1, Stellite 4) to 3.21 (C5, Stellite 190), and tungsten content ranging from 4.30 (A1, Stellite 6) to 16.30 (A5, Stellite 20). However, they represent only a few discrete points in the chemical composition map of cobalt-based alloys, as summarised in . Analytical work can be applied to link these experimental data points and construct a generalised composition-property model where the mechanical properties (such as hardness and impact energy) can be estimated for a given blend. As discussed later, modelling properties is a multivariate problem that can be solved via numerical and dimensional analysis.
Figure 1. (a) the chemical composition distribution map of Stellite alloys. A, B and C refers to the alloys shown in Table 1, (b) Illustration of the mathematical model. Cw = Tungsten content in wt.%, Cc = Carbon content in wt.%, C = Total area fraction of carbides in %, El = Percent elongation in %, Ys = 0.1% offset yield strength in MPa, H = Vickers macro-hardness, I = Un-notched Charpy Impact Energy in J.
2.4.1. Numerical analysis
Numerical analyses such as polynomial interpolation, cubic spline interpolation, and least-squared approximation can be used to construct a function that fits the experimental data points. This approximation can then be employed for interpolation to estimate unknown values. Interpolation with a single polynomial is a simple way of fitting data points. However, the interpolation function will be a high order polynomial for large datasets, which naturally oscillates and may not represent the actual trend. Therefore, interpolation is sometimes applied in a piecewise manner where different low-order polynomials are used to interpolate successive data pairs. Cubic spline interpolation is the most commonly used method in such a situation. The least-squared approximation is a method to construct a function that minimises the sum of squared deviations from the function to each data point with an assumed linear or non-linear relationship. The difference between interpolation and least-squared approximation is that the interpolation function strictly fits the data points, whereas the approximating function does not. Nevertheless, the approximation method does seek a relationship between the variables and results, with the trend of the relationship assumed. Details about the algorithms of these numerical methods can be seen elsewhere [Citation30]. Some work of numerical analysis, such as two-dimensional interpolation and cubic spline interpolation was done using MATLAB [Citation31].
2.4.2. Dimensional analysis of stellite alloys
Dimensional analysis is used to check the correctness of physical equations and/or derive formulas and equations simply from the notion of dimensions of physical quantities. Using dimensional analysis, the relationship between selected physical quantities can be derived based on the requirement that each side of any equation should have the same dimensions in length, mass and time, i.e. dimensional homogeneity. Details of the dimensional analysis method can be seen in [Citation32]. Dimensionless groups, which are combinations of dimensional and dimensionless variables with no overall dimension, can arise from the results obtained through dimensional analysis. In engineering studies, dimensionless groups, e.g. Reynolds number, are frequently adopted as criteria of theories. Notably, the number of independent dimensionless groups equals the number of variables minus the number of fundamental dimensions.
gives the physical variables related to the mechanical properties of HIPed Stellite alloys. The dimensional formulas are presented as the combinations of the three absolute units, namely, length (L), mass (M), and time (T).
Table 2. Variables used in the modelling analysis and their dimensional formulas.
illustrates how the analytical work is implemented. The supplementary information of can be found in Appendix A: Supplementary information for analytical modelling. As the basic mechanical property, hardness is closely related to chemical composition. Carbide fraction is an important factor in terms of microstructure, and it also depends on the chemical composition, i.e. Cw and Cc. Both relationships can be derived via numerical analysis. The elongation is not only connected with Cw and Cc but also with carbide fraction, as the carbide/matrix boundaries played an important role in crack initiation and propagation during tensile testing. A simple relationship can be found between yield strength and hardness. The impact energy has relatively complicated relationships with the other mechanical properties, as it depends on material hardness, microstructure (carbide/matrix boundaries), ductility, and strength. Therefore, dimensional analysis is applied to appreciate the relationship between impact energy and the various properties, e.g. elongation and carbide fraction.
3. Results and discussion
3.1. Microstructure
3.1.1. Blend A
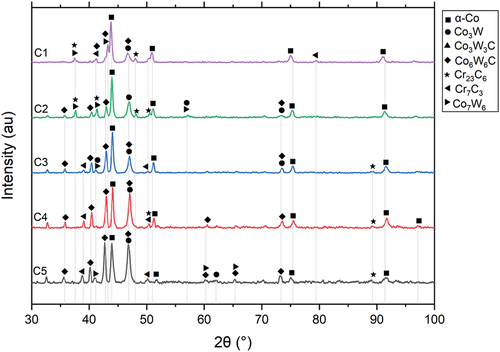
The HIPed microstructure of alloys from blend A (A1, A3 and A5) are shown in . Carbon and tungsten composition of the A2 (75/25-Stellite 6 and 20) and A4 (25/75 composition of Stellite 6 and 20) would be very similar to that of B5 and C3, respectively (), and hence were not considered in the current investigation. The area fraction of the phases observed in blend A is summarised in . There were two distinct secondary phases, the dark phase and the light phase, in A5 (), whilst only the former appeared in A1 (). A3 consisted of two regions resembling A1 and A5, which are labelled in . The EDS analysis indicated that the dark phase was Cr-rich carbides, and the light phase was W-rich carbides. The X-ray diffraction (XRD) spectrums are shown in , which suggests that the possible phases were α-cobalt (FCC), Cr7C3, Co3W, Co7W6 for A1, and α-cobalt (FCC), Cr7C3, Cr23C6, Co3W, Co7W6, Co6W6C for HIPed A5. A3 consisted of α-cobalt (FCC), Cr7C3, Co3W, Co7W6 and Co6W6C.
Figure 2. The microstructure of HIPed Stellite alloy (a) A1(HS6); (b) A3; (c) A5 (HS20) [Citation19].
![Figure 2. The microstructure of HIPed Stellite alloy (a) A1(HS6); (b) A3; (c) A5 (HS20) [Citation19].](/cms/asset/4ad64aad-3da8-40b9-bdff-1ca4c5675646/tmpt_a_2220242_f0002_oc.jpg)
Figure 3. The XRD spectra of HIPed Stellite alloys A1 (HS6), A3, and A5 (HS20).
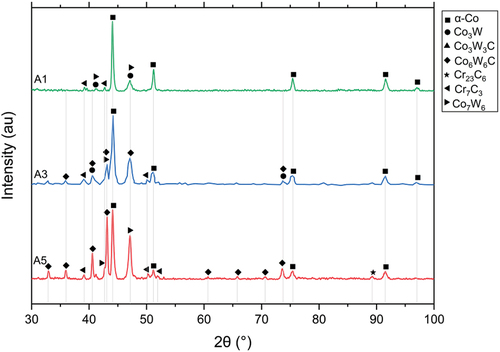
Table 3. The area fraction of the individual phases in the HIPed Stellite alloys and blends A, B and C.
The dual region obtained from blending A1 and A5 powders can be useful for design in certain engineering applications, e.g. providing strength and ductility. The original regions where the A1 and A5 powders existed during the HIPing of A3 alloy are defined as A1-like and A5-like regions. There was much higher tungsten and carbon content in A5 powder than in A1 powder. During the HIPing process, carbon could diffuse from a high-carbon A5-like region to a low-carbon A1-like region. However, tungsten could not diffuse freely due to its large atomic radius. Therefore, in the A3 blend alloy, most W-rich carbides/phases appeared in the original region of the A5 powders. No appreciable porosity was observed in the HIPed blend alloy, indicating full densification during the HIPing process. The boundary between the two regions could only be recognised via their different microstructure. Most possible phases identified via the XRD analysis in A1 and A5 can also be identified in A3, though the compositions of the phases might be slightly different.
In the order of A1, A3, and A5, the tungsten and carbon content increased significantly, and the chromium content increased slightly. The total area fraction of carbides, therefore, increased from 17.9% (A1) to 33.3% (A3) and 48.9% (A5) (). The fraction of the Cr-rich carbides in A3 was very close to the average of those in A1 and A5 (), indicating the carbide fraction was proportional to the carbon and tungsten content. The content of W-rich carbides in A3 was around half of that in A5, as there was no W-rich carbide in A1 (). The average sizes of the Cr-rich carbides and the W-rich carbides in the three alloys were similar (2–3 μm), indicating that carbide morphology in the HIPed alloys did not vary with chemical compositions.
3.1.2. Blend B
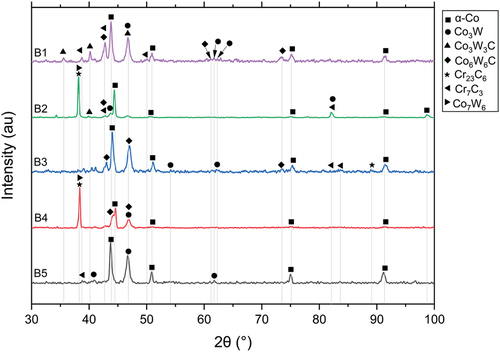
The HIPed microstructure of alloys from blend B (B1, B2, B3, B4 and B5) are shown in . The area fraction of the phases observed in blend B is tabulated in . The microstructures were similar, with fine Cr-rich carbides (dark phase) and W-rich carbides (light phase) uniformly distributed in the Co-rich matrix. The XRD spectrums are shown in , which reveals that the possible phases in these alloys were α-cobalt (FCC), carbides (Cr23C6, Cr7C3, Co3W3C, and Co6W6C), and intermetallic compounds (Co3W and Co7W6).
Figure 4. The microstructure of HIPed Stellite alloy (a) B1 (HS1); (b) B2; (c) B3; (d) B4; (e) B5 (HS12).
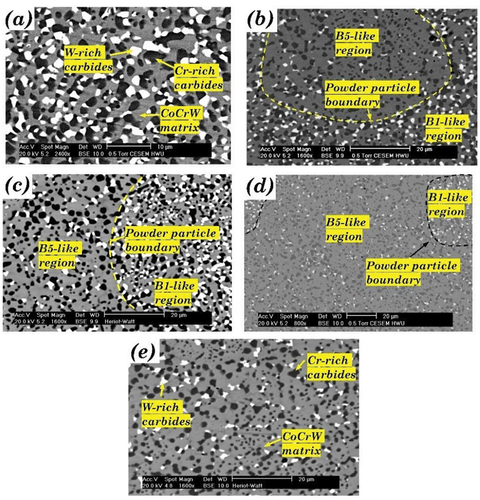
Figure 5. The XRD spectra of HIPed Stellite alloys B1 (HS1), B2, B3, B4, and B5 (HS12).
Similar to the microstructure of A3, the B1-like and B5-like regions, which represented the original regions of the two kinds of powders used in this blend (i.e. B1 powder and B5 powder), could be recognised in B2, B3 and B4 due to the different fractions of W-rich carbides between the two powders (). The main microstructural difference in these blend alloys is the area fraction of W-rich carbides, which was 13.3% in B1 and only 5.2% in B5 (). This was attributed to the decrease of tungsten content and carbon content from B1 to B5. However, the difference in chemical composition between B1 and B5 was not as significant as that between A1 and A5. Therefore, the only minor difference was between the Cr-rich carbide factions of the alloys in blend B.
The XRD analysis presented in indicated that the possible types of carbides in these alloys were similar. Cr7C3 and Co6W6C were identified in all the alloys except B4, where Cr7C3 was replaced by Cr23C6. The published literature also observed similar carbide composition changes from Cr7C3 to Cr23C6 due to the lower temperatures and different cooling rates during the liquid phase sintering or HIPing process [Citation28,Citation33]. The EDS analysis indicated that the approximate composition of the Cr-rich carbide in the B1 alloy was (Cr0.76Co0.20W0.04)7C3, and the Cr-rich M7C3 carbides in the other alloys had similar compositions. In B4, the Cr-rich M23C6 carbide had an approximate composition of (Cr0.74Co0.24W0.02)23C6. Besides Co6W6C, which was identified as the main W-rich carbide in all the alloys in blend B, whereas Co3W3C was also identified in B1 and B2. However, the compositions of the W-rich carbides differed from B1 to B5, as the C and W content in the carbides decreased from 11.2% and 42.3% to 9.6% and 32.8%, respectively.
3.1.3. Blend C
The HIPed microstructure of alloys from blend C (C1, C2, C3, C4 and C5) are shown in . The area fraction of the phases observed in blend C is tabulated in . The carbide fraction increased with the increase in carbon content from C1 to C5. The XRD spectrums are shown in , which indicate that the possible phases in blend C were α-cobalt (FCC), Co3W, Co7W6, Cr23C6, Cr7C3, and Co6W6C.
Figure 6. The microstructure of HIPed Stellite alloy (a) C1 (HS4); (b) C2; (c) C3; (d) C4; (e) C5 (HS190).
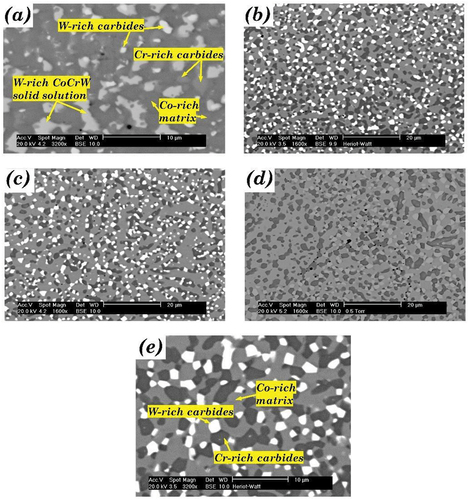
Figure 7. The XRD spectra of HIPed Stellite alloys C1 (HS4), C2, C3, C4, and C5 (HS190).
Similar possible phases, i.e. α-cobalt (FCC), Co3W, Co7W6, Cr23C6, Cr7C3, and Co6W6C, were identified in C1 and the other alloys of blend C. The microstructure of C1 was different from the other alloys. There were three type of secondary phases in C1, including Cr-rich carbide (grey phase in ), W-rich carbide (light phase), and metallic compound phase (light grey phase). There were only two type of secondary phases, Cr-rich carbide (dark phase) and W-rich carbide (light phase), in the other alloys in this blend. The distinctive microstructure of C1 was derived from its unbalanced tungsten and carbon contents. C1 contained 14.4% tungsten but only 0.67% carbon, which was the lowest among the commercially available CoCrW alloys. Besides forming the W-rich carbides, tungsten remained in the solid solution and formed intermetallic compounds such as Co3W and Co7W6. The tungsten remaining in the solid solution was beneficial to the hardness of C1. However, it also increased the brittleness. As discussed later, this variance in the microstructure of C1 resulted in a relatively large scatter in impact energy from predictive models.
As the carbon content increased from C1 to C5, more carbides formed. The Cr-rich carbides increased from 14.6% in C1 to 36.7% in C5, whilst the fraction of W-rich carbides increased greatly from C1 (2.5%) to C2 (15.5%) and remained constant from C2 to C5 (15.8%). The EDS analysis indicated that the tungsten content in these W-rich carbides was constant, while the carbon content increased from C2 to C5.
Although, during the HIPing process, tungsten could not diffuse freely due to its large atomic radius, the distribution of tungsten was still uniform in the blend C alloys because of their similar tungsten content. However, the carbon could diffuse throughout the blend alloy from the high-carbon region (Stellite 190 powder) to the low-carbon region (Stellite 4 powder). The influx of carbon to the low-carbon region could form new carbides with the superfluous tungsten remaining in the matrix. Therefore, the thorough diffusion of carbon during the HIPing process resulted in a uniform microstructure of the C2, C3, and C4, where no C1-like or C5-like regions existed, which was unlike blends A and B.
3.2. Mechanical test results
3.2.1. Blend A
shows selected mechanical test results of blend A and additional results can be found in Table B1 in Appendix B. The macro-hardness, micro-hardness and yield strength are found to increase, while the elongation and impact energy decrease in the order of A1, A3 and A5.
Figure 8. (a) hardness and yield strength of blends A, B and C, (b) Elongation and unnotched charpy impact energy of blends A, B and C.
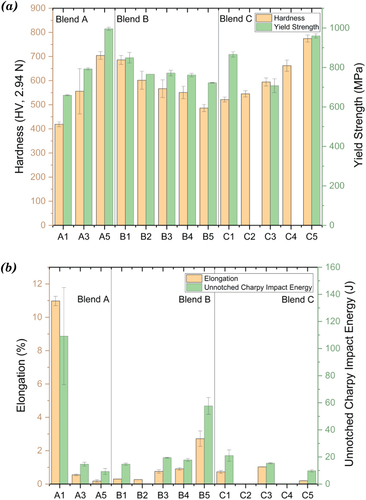
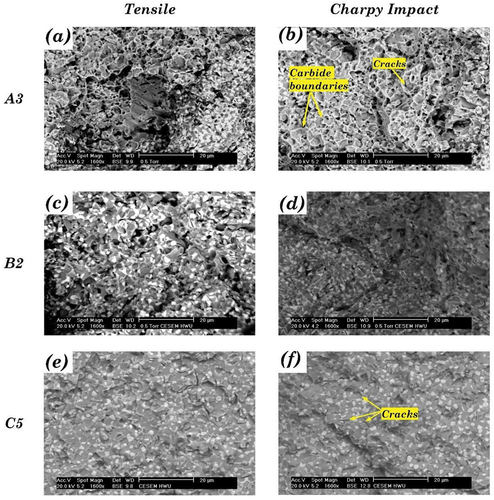
The carbides (M7C3, M23C6, Co3W3C, and Co6W6C) and intermetallic phases (Co3W and Co7W6) identified from the three alloys in blend A were all beneficial to the hardness. The macro-hardness of A3 (HV 558.0 ± 4.3) was around the average of those of A1 (HV 414.2 ± 7.9) and A5 (HV 675.0 ± 17.2), which was consistent with the carbide fractions of the three alloys. At the micro-level, there was a significant difference in the hardness of different regions in A3 alloy due to its mixed microstructure, which resulted in a high standard deviation of ten measurements (HV555.9 ± 93.9). Nevertheless, the average micro-hardness value of A3 was similar to its macro-hardness value. A1 and A3 had similar Young’s moduli, while A5 was slightly stiffer than them (Table B1 in Appendix B). The yield strength increased in the order of A1, A3, and A5. Despite the lowest yield strength, A1 had the highest UTS. The percent elongation is a quantitative expression of a material’s ductility, measuring the degree of plastic deformation sustained at fracture. The elongation of A1 during the tensile tests was 10.98%, which was much higher than the elongation of A5 (0.18%). The A3 blend inherited the brittle character of A5 much more than the ductile character of A1 and had a quite low elongation. The impact energy absorption of HIPed Stellite 6 (A1, 109.14 J) was approximately an order of magnitude higher than that of HIPed Stellite 20 (A5, 9.26 J) due to its much higher ductility. The impact energy of A3 (14.69 J) was much lower than the average of A1 and A5, which was consistent with the elongation results for this alloy as observed during the tensile tests. summarises the SEM observations of the fractured surfaces after tensile and Charpy impact tests for the blend alloys.
Figure 9. Fracture surfaces obtained using SEM in BSE mode for selected tensile ((a), (c) and (e)) and Charpy impact tests ((b), (d) and (f)) for A3, B2 and C5.
3.2.2. Blend B
shows selected mechanical test results of blend B and additional results can be found in Table B1 in Appendix B. The hardness and yield strength decreased, whilst the elongation and impact energy increased in the order of B1, B2, B3, B4 and B5.
The relatively higher deviation of the micro-hardness values was due to the coexistence of harder carbide and softer matrix in Stellite alloys, particularly the mixed microstructures in B2, B3, and B4. As discussed before, the carbon and tungsten content in Stellite alloys determines their hardness. The results of blend B confirmed the analysis, indicating that the hardness of the alloys in blend B was proportional to their carbon and tungsten content. Aside from the tensile test results of B2, Young’s modulus and yield strength decreased, whilst the elongation increased from B1 to B5. Alloys B3, B4, and B5 had similar UTS, which was higher than B1. B2 had similar yield strength to B3 and similar Young’s modulus and elongation to B1. The tensile test results of B2 could have been more accurate if more than one sample had been tested. The elongation of B3 and B4 was much closer to the result of B1 than that of B5, indicating that the brittle characteristic dominated the blended alloys. A similar trend was noticed between the elongation and the impact energy of blend B. B5 had a much higher impact energy than B1. The impact energy of B3 was lower than the average of B1 and B5, indicating that the property of blended alloy was dominated by the brittle characteristic inherited from B1. Although only one sample of B4 was tested, the result (16.95 J) indicated that B4 had similar impact energy to B3, which was much lower than B5.
3.2.3. Blend C
shows selected mechanical test results of blend C and additional results can be found in Table B1 in Appendix B. C5 was the hardest material in this blend group, with the highest yield strength and lowest elongation.
The tungsten remaining in the solid solution was regarded as the main factor for Stellite alloys to keep their hardness at elevated temperatures [Citation34]. As the alloys in blend C had the same tungsten content, their hardness was mainly affected by their carbon contents. Although C1 had the lowest hardness in blend C, it had the highest UTS and Young’s modulus, and both the yield strength and elongation of C1 were between C3 and C5. The tensile property of C1 was attributed to its unique microstructure, which was a combined result of its high content of tungsten remaining in the solid solution and its relatively low fraction of carbides. Despite the fine microstructure, the high fraction of secondary phases made the alloys in blend C very brittle with relatively low impact energy. The impact energy of C3 was approximately the average of C1 and C5. It differed from the trend found in blends A and B, where the impact energy values of A3 and B3 were much lower than the average of the base alloys in both blends. This was because, unlike A3 and B3 having mixed microstructure, C3 had a uniform microstructure without a C1-like or C5-like region, as discussed earlier in Section 3.1.3. Both C1 and C5 had an equal influence on C3, and neither could solely dominate the property of C3.
3.3. Mapping of hardness
3.3.1. Correlation between hardness and chemical composition
The hardness of Stellite alloys is determined by the content of carbon and tungsten (Section 3.1 and Section 3.2). Generally, the hardness increases with carbon content and tungsten content. This section will discuss a quantitative analysis of the correlation between the macro-hardness and the content of carbon and tungsten.
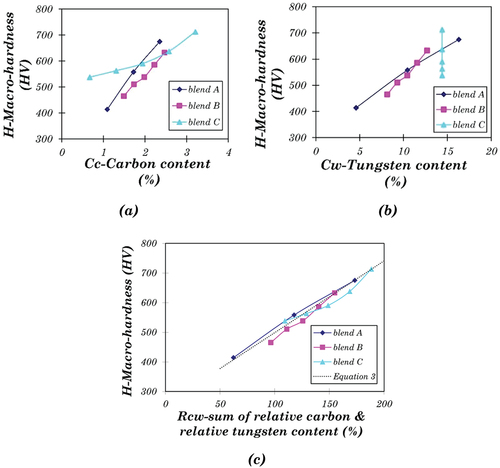
The relation between macro-hardness and the content of carbon and tungsten is shown in . Within each blend group, macro-hardness increases approximately linearly with the carbon content (). However, the rule is inapplicable to the alloys in different blend groups, as the line slopes for the three blends are different. A similar linear correlation between the macro-hardness and the tungsten content was also found individually in blends A and B (). However, neither carbon content nor tungsten content can solely model the hardness of a Stellite alloy with given composition. There are two ways to get a general solution of hardness for all the Stellite alloys under investigation. First, find out a single variable, which comprises the effect of both carbon content and tungsten content, and correlate this variable with hardness. Second, blend C is a special group with the blended alloys having the same tungsten content, indicating the change in hardness was only determined by the difference in carbon content. Therefore the correlation between hardness and carbon content for alloys with specified tungsten content can be derived from the results of blend C. Assuming this trend is independent of tungsten content, it can be generalised to the alloys with different tungsten content.
Figure 10. Variation of averaged macro-hardness with (a) Carbon content, (b) Tungsten content, (c) Sum of relative Carbon and Tungsten content.
3.3.2. Linear approximation – hardness
The simplest way to evaluate the influence of carbon and tungsten content is to add them together. However, in all the Stellite alloys, the tungsten content (maximum 16.3 wt.%, A5) is much higher than the carbon content (maximum 3.21 wt.%, C5). If both values are added simply, their sum will be dominated by the tungsten content, which deviates from the experimental observation of hardness values. Therefore, the absolute values of Cw and Cc were replaced by the relative values so that the influence of both contents can be comparable. The sum of relative tungsten content and relative carbon content, Rcw, is given by:
shows the linear relationship between Rcw and H, where the linear approximation function can be derived:
EquationEquation 2(2)
(2) fits the experimental data well. The maximum deviation occurs at the data point B5, around 4.5%. Based on EquationEquation 2
(2)
(2) , a contour map of hardness was developed, as shown in . The positions of the Stellite alloys under investigation were marked, along with the experimental result. For example, the positions of A1 and C5 are close to the contour lines of 400 and 700, respectively, which are similar to the experimental results (A1 414.2, C5 713.0), indicating that the contour map worked well. The drawback of this simple model is that it cannot distinguish the individual effects of carbon and tungsten. According to this model, any two alloys with the same Rcw will have the same hardness. For example, one alloy containing 1.2% C and 10.2% W has the same hardness as the other one containing 2.4% C and 4.1% W due to their same Rcw values (100%). In practice, however, it can be more complex.
Figure 11. (a) Contour map of hardness based on linear approximation using Equation 2, (b) Contour map of hardness based on the linear approximation for base alloys only using Equation 3, (c) Relationship between carbon content and hardness of Stellite alloys with different tungsten contents, which are shown in the bracket, (d) Contour map of hardness based on the exponential approximation for only base alloys.
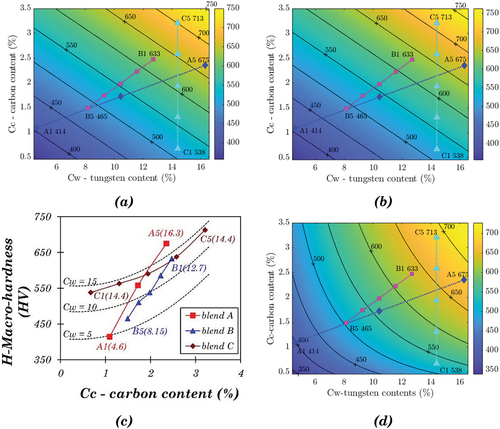
The blended alloys produced via blending two different powders during HIPing have different microstructures and properties from the base alloys. It is useful to create a model based on the data points of base alloys better than the model based on all the alloys due to its avoidance of the much more distinctive properties of the blend alloys. There are six CoCrW base alloys in this investigation, i.e. A1 (Stellite 6), B1 (Stellite 1), C1 (Stellite 4), A5 (Stellite 20), B5 (Stellite 12), and C5 (Stellite 190). The analysis of the base alloys may also offer a convenient way to predict the hardness values, which are required in further analysis of impact energy. Similar to EquationEquation 2(2)
(2) , a new linear approximation function was created for the base alloys only:
This function fits the experimental results and EquationEquation 2(2)
(2) , with a maximum deviation of 5% for B5. The contour map based on EquationEquation 3
(3)
(3) is presented in , showing that the experimental results of the base alloys are fitted well using this model.
3.3.3. Polynomial approximation (blend C) – hardness
The five alloys in blend C have the same tungsten content (14.40%), which can be used to find the relationship between the carbon content and hardness. As there are five data points in blend C, a polynomial of degree 4 is needed to fit all the points using polynomial interpolation. However, this polynomial of degree 4 has three turning points, which is unlikely to reflect the real relationship. Therefore, a quadratic approximation is used instead. The quadratic function is:
EquationEquation 4(4)
(4) gives the relationship between carbon content and hardness for blend C (Cw = 14.40). The Cw factor should be considered to generalise this equation to the other Stellite alloys. Assuming the alloys with different Cw have the same relationship with Cc as the alloys in blend C, a general solution can be given by:
Here fc and fw are the functions with variables of Cc and Cw, respectively, and Const represents a constant. fc can be derived from EquationEquation 4(4)
(4) as:
Then the specific equation for blend C (EquationEquation 4(4)
(4) ) can be rewritten in a general form:
Here fw represents the relationship between the variable Cw and the difference between H and fc. A quadratic approximation function can be given by:
Hence from EquationEquation 5(5)
(5) , EquationEquation 6
(6)
(6) and EquationEquation 8
(8)
(8) , the expression for H can now be derived:
EquationEquation 9(9)
(9) gives the individual effect of Cc and Cw on hardness, which applies to all the blended Stellite alloys under the current investigation. The maximum deviation occurs at A3, around 5.2%.
shows the experimental data points, with three dashed curves indicating the predicted hardness for alloys with fixed Cw values, i.e. 5, 10, and 15. The numbers in parenthesis are the Cw values of the individual alloys. The three dashed curves show a similar trend, consistent with the assumption that the tungsten content does not affect the relationship between carbon content and hardness. This model based on EquationEquation 9(9)
(9) fits most experimental points well except A1, indicating that revision of the model was needed for alloys with lower Cw.
For the contour map of hardness based on this model, the contour lines were not parallel, similar to the trend observed in . It was observed that the gaps between the contour lines were wider in the area with low Cc and high Cw but narrower in the area with high Cc and low Cw. It means that in order to increase hardness by adding tungsten or carbon, the required addition of tungsten or carbon for a certain increase in hardness is more in the area with high Cw and low Cc than in the other regions.
3.3.4. Exponential approximation (base alloys) – hardness
The previous polynomial approximation method is no longer applicable for the analysis based on base alloys only. The relationship between Cc and H can hardly be predicted accurately by only two alloys with fixed Cw, i.e. C1 and C5. Therefore, exponential fitting is used to correlate H with Cw and Cc, with a general equation as:
Here A is a constant, and a, b are exponents for Cw and Cc, respectively. EquationEquation 10(10)
(10) can be rewritten as a linear set of equations, A·x = b, using the logarithms of both sides:
There are only three unknowns, a, b, and Log(A). However, six equations can be created with the experimental results of six base alloys. In this over-determined case, a single unique solution does not exist. Therefore the solution that minimises the squared error in A·x-b is commonly used in practice. The least-squares solution is:
shows the contour map based on EquationEquation 12.(12)
(12) The results of B5 and C5 did not fit well, indicating exponential relationship is not a good description of the correlation between hardness and chemical compositions.
In summary, based on alloys investigated in this project, the best fitting model for hardness is the linear approximation function (EquationEquation 3(3)
(3) ), as indicated by the contour map shown in . Therefore, in the later Section 3.7 on impact analysis, EquationEquation 3
(3)
(3) will be used to generate the predicted hardness values. The other methods, i.e. polynomial approximation and exponential approximation, showed relatively larger deviations in some regions on the contour map, though they might fit the results better in other regions.
3.4. Mapping of carbide fraction
3.4.1. Correlation between carbide fraction and chemical composition
shows the relationship between carbide fraction and carbon content of all the CoCrW alloys under investigation. The total carbide fraction, the sum of the Cr-rich carbide fraction and W-rich carbide fraction, rises with increasing carbon content. The approximation function solely based on carbon content is:
Figure 12. (a) Variation of averaged carbide fraction with carbon content, (b) Variation of averaged carbide fraction with relative carbon and tungsten content.
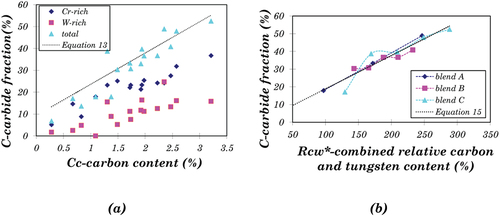
However, the deviations based on EquationEquation 13(13)
(13) were unacceptable for C2 (>30%), as indicated in . Therefore, a more sophisticated model was needed to reduce the deviations. The Cr-rich carbide fraction is determined by both Ccr and Cc, whilst both Cw and Cc determine the W-rich carbide fraction. Considering the chromium content (Ccr) of most Stellite alloys is similar, Cw and Cc are again the key factors to the carbide fraction, as analysed below.
3.4.2. Linear approximation – carbide fraction
Similar to the analysis in Section 3.3.2, a combined relative value, Rcw*, is founded as an indicator for the carbide faction. Rcw* is defined by:
As Cw mainly affects W-rich carbides, but Cc affects all kinds of carbides, the combined relative value consists of one portion of Cw and two portions of Cc is used in EquationEquation 14(14)
(14) in comparison to EquationEquation 1.
(1)
(1) shows the carbide fraction’s relationship between Rcw* and C. A linear function is derived via least-squared approximation as:
The trendline using EquationEquation 15(15)
(15) in has a good fit with blend A and blend B. However, the fit with blend C (in particular C1 and C2) is not consistent. For example, it is found that this model does not fit C1 well. The deviation between the predicted carbide fraction and the real one of C1 is 43%.
3.4.3. Polynomial approximation (base alloys) – carbide fraction
It is difficult to find a satisfying model to fit the results of all the Stellite alloys under investigation, as the deviation was as high as 43% for C1 in the previous analysis. This could mainly be attributed to the relatively irregular carbide fractions of the blended alloys. The carbide fractions of the blended alloys did not simply equal the averages of the base alloys due to the diffusion of carbon during the HIPing process and/or changing of carbide type. The maverick in the base alloys is C1 (Stellite 4), consisting of 14.4% tungsten content but a very low carbon content of only 0.67%. As discussed earlier in Section 3.1.3, most of tungsten in this alloy works as an intermetallic compound former instead of a carbide former (), which is attributed to its low carbon content. If the disturbances from the blended alloys and C1 (Stellite 4) are excluded from the analysis, some basic relationships between the base alloys will be can be formed.
shows that the Cr-rich carbide fraction increases with carbon content initially from 0 to 1.5%, then keeps constant with carbon content from 1.5% to 2.5%, and increases again with carbon content over 2.5%. shows that the W-rich carbide fraction increases monotonically with W content for all the base alloys except C1. EquationEquation 16(16)
(16) and EquationEquation 17
(17)
(17) give the polynomial approximation functions for the two relationships, and the sum of both kinds of carbide is the total carbide fraction, C, as indicated by EquationEquation 18.
(18)
(18)
Figure 13. (a) Variation of Cr-rich carbide with carbon content for base alloys, (b) the variations of W-rich carbide with W content for base alloys, (c) Contour map on carbide fraction based on the polynomial approximation for base alloys only using Equation 18 (d) Contour map of carbide fraction based on the exponential approximation for base alloys only using Equation 19.
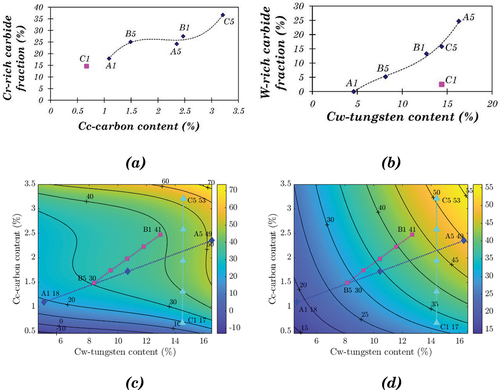
presents the contour map of the carbide fraction based on EquationEquation 18.(18)
(18) The carbide fractions of the base alloys are also presented. This model fits most base alloys quite well, including C1. However, the best fitting in terms of mathematics is not always the same as the best fitting in terms of engineering. In this model, the carbide fraction maintains constant while increasing the carbon content from around 1.7 to 2.5 wt.%, which contradicts the fact that the carbide fraction increases with carbon content. Furthermore, for the alloys with very high or very low Cc and Cw, i.e. the top right and bottom left corner in the contour map (), the carbide fraction change becomes more significant. Some of the predicted values (e.g. −10) for the carbide fraction are unacceptable.
3.4.4. Exponential approximation (base alloys) – carbide fraction
Similar to the analysis in Section 3.3.4, exponential approximation was also applied on carbide fraction for all base alloys except C1. The least-squares solution for carbide fraction is:
The contour map based on EquationEquation 19(19)
(19) is presented in . Although this model does not fit C1 well (deviation of 84%), it shows a smooth carbide fraction change with tungsten and carbon content all over the contour map. Excluding C1, the maximum deviation is 5%. Therefore, this model will be used to generate the predicted carbide fraction values in the analysis of impact energy, as discussed later in Section 3.7.
3.5. Mapping of yield strength
Similar to hardness, the yield strength of an engineering material is also a measure of its resistance to plastic deformation. The yield strength of cast iron, steel, and brass is found to be proportional to their Brinell hardness [Citation35]. shows the linear relationship between the hardness and yield strength of Stellite alloys. The linear approximation for the base alloys can be derived as:
Figure 14. (a) Variation of yield strength with hardness, (b) Contour map of yield strength based on the linear approximation for base alloys only using Equation 20, (c) Contour map of elongation based on the exponential approximation for base alloys only using Equation 22.
The maximum deviation of EquationEquation 20(20)
(20) occurs at C1, around 12% for base alloys. It also fits well with the blended alloys, with the maximum deviation at C3, approximately 20%.
According to EquationEquation 20(20)
(20) , the yield strength can be predicted with the hardness values. shows the contour map of yield strength based on EquationEquation 3
(3)
(3) and EquationEquation 20.
(20)
(20) This simple linear approximation can reasonably predict the yield strength values for blended alloys. Atakok et al. [Citation36] used ANOVA (analysis of variance) to predict an expression for tensile strength using material, layer thickness and occupancy rate as input to the predicted expression for 3D printed polylactic acid filament. However, the advantage of the modelling presented here is that the yield strength is predicted using hardness which in turn can be predicted using the carbon and tungsten content.
3.6. Mapping of elongation
As an indicator of the material’s ductility, elongation depends on the resistance to the crack initiation and propagation before fracture (). The investigation of the fractographs of Stellite alloys indicated that the carbide/matrix boundaries were the main routes for the cracks to propagate. Therefore, the carbide fraction is considered in the analysis of elongation, together with the chemical composition factors, Cw and Cc. Similar to the analysis in Section 3.3.4, exponential approximation was conducted on the elongation results of the base alloys only. C1 was excluded from this analysis because the boundaries of the intermetallic compound in the microstructure of C1 provided cracks propagation routes as well as the carbide particle boundaries. Therefore its carbide fraction is not a proper representation of the effect of particle boundaries. The approximation function is:
As carbide fraction is also related to Cw and Cc either in a polynomial or exponential relationship, the influence of C can be replaced by Cw and Cc. Therefore, a simpler function based on Cw and Cc only can be derived:
The predicted value of C1 is almost double the value of the experimental result, which is indicated in the contour map of elongation, as shown in . Excluding C1, the maximum deviation is 24% which occurs in B5.
presents the variations of elongation with tungsten content, showing that El decreases strikingly while Cw increases from 4% to 9% and then keeps a very low but stable level for the alloys with more than 9% Cw. A similar trend is also found between El and Cc of Stellite alloys except for C1, as shown in .
3.7. Mapping of impact energy
3.7.1. Properties related to impact energy
The investigation of the fracture mechanism of Stellite alloys suggested that material ductility and the carbide/matrix boundaries were the main relevant properties of the impact energy. Although impact energy decreases with increased carbon content monotonously within the blend group, no clear relationship can be found applying to all the alloys. shows the variations of impact energy with tungsten content, indicating that Cw has a restraining effect on the impact energy, probably due to the brittle character of W-rich carbides or intermetallic compounds. The impact energy results of the blended alloys are relatively low, even for the blend with 75% ductile alloy and 25% brittle alloy, indicating that the brittle character dominated the impact properties of the blended alloys. Impact energy represents the dynamic toughness of the material, which is consistent with static toughness. Static toughness can be ascertained as the area under the strain-stress curve obtained from the tensile test results up to the fracture point. Most Stellite alloys have very high UTS and yield strength and lower ductility. A1 has relatively higher elongation than the other CoCrW base alloys, resulting in a much higher static toughness and impact energy. The correlation between elongation and impact energy is shown in .
Figure 15. (a) Variation of impact energy with tungsten content, (b) Variation of impact energy with elongation, (c) Contour map of impact energy based on polynomial approximation on elongation for base alloys only using Equation 23, (d) Contour map of impact energy based on dimensional analysis using Equation 27.
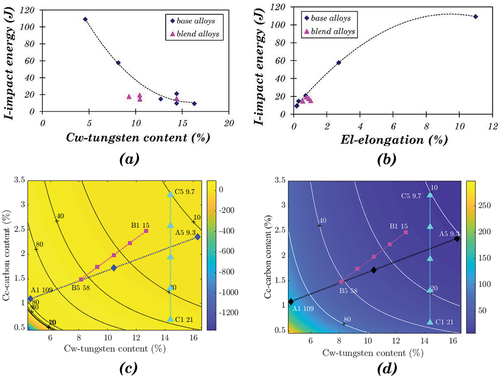
3.7.2. Polynomial approximation – impact energy
The relationship between impact energy and elongation provides a simple method to predict the impact energy value, i.e. polynomial approximation. The approximation function can be derived based on :
EquationEquation 23(23)
(23) fits the experimental results of base alloys very well, with the maximum deviation at B1, around 19%.
shows the contour map of impact energy based on EquationEquation 23.(23)
(23) The El values were predicted using EquationEquation 21.
(21)
(21) However, the predicted value of C1 (deviation of 67%) does not fit the experimental result very well. The predicted values for the alloys with low carbon and tungsten content (bottom left corner in ) are also unacceptable. Hence a different approach was investigated based on dimensional analysis.
3.7.3. Dimensional analysis – impact energy
The first step of dimensional analysis is to decide the variables on which the impact energy depends. Here the chosen variables are: carbide fraction (C), hardness (H), yield strength (Ys), and elongation (El). As the impact properties of blend alloys were significantly affected by their mixed microstructures, the analysis will only be conducted on the base alloys.
The solution of I, the impact energy, is as follows:
where A is a dimensional constant related to the dimensions of the un-notched sample, with a unit of mm2, and a, b, c, d, e are coefficients to be decided. The corresponding dimensional equation is:
so that a = 1.5 and c + d = 1. Hence:
There are four remaining unknowns in this equation, A, b, c, and e, which can be solved based on the experimental results of base alloys except for C1. The approximation equation is:
shows the contour map based on EquationEquation 27.(27)
(27) The predicted values for C, H, Ys, and El are based on EquationEquation 19
(19)
(19) , EquationEquation 3
(3)
(3) , EquationEquation 20
(20)
(20) and EquationEquation 22
(22)
(22) , respectively. Similar to the model using polynomial approximation on elongation (), this model does not fit C1 very well and has a deviation of about 80%. Furthermore, the predicted values of other base alloys had much larger variations ranging from 10% to 42%, which are much higher than the deviations from polynomial approximation. This signifies that the polynomial approximation is superior to dimensional analysis in predicting the impact energy, except for C1.
4. Conclusion
In this study, various Stellite powders were blended and then consolidated using HIPing to obtain CoCrW alloys with varying C, Cr and W content. These alloys were experimentally analysed, and mathematical models were developed to correlate properties, such as hardness, carbide content, tensile strength, elongation and impact strength with alloying content. Linear, polynomial and exponential approximations were applied to map the properties against carbon and tungsten content in base and blended alloys. Following specific conclusions can be made based on Stellite alloy combinations considered in this investigation.
The microstructure of blended alloys A and B was hybrid indicating powder particle boundaries of base alloys. Full densification was reached, and there was evidence of carbon diffusion across the powder particle boundaries.
Unlike blends A and B, as blend C had similar tungsten content, carbon could diffuse throughout the blend alloy from the high-carbon region (Stellite 190 powder) to the low-carbon region (Stellite 4 powder). The influx of carbon to the low-carbon region could form new carbides with the superfluous tungsten remaining in the matrix. Therefore, the thorough diffusion of carbon during the HIPing process resulted in a uniform microstructure of the C2, C3, and C4, where no C1-like or C5-like regions existed.
Linear approximation provides the best fit for mapping the hardness of alloys with a maximum variance of 5% (EquationEquation 2
(2)
Except for C1 (Stellite 4), exponential approximation provided the best contour map of carbide fraction against the alloying content of carbon and tungsten (EquationEquation 19
Yield strength was linked to hardness using the linear approximation. This resulted in a higher maximum variance of 12% for base alloy C1 and 20% for blended alloy C3.
Elongation was linked to carbide fraction and impact energy using exponential approximation. Excluding C1 using EquationEquation 22
Impact energy was linked with the elongation by a polynomial approximation. Excluding C1, the maximum deviation that occurred at B1 was 19%. To fit C1, a dimensional map of the impact energy was constructed by interlinking carbide fraction, hardness, yield strength, and elongation. Given the complexity of competing energy dissipation mechanisms, this map had inferior fitting than the polynomial approximation
Research Highlights
An approach of blending to form new Stellite alloys with tailored mechanical performance.
Structure-property relationships of existing and blended alloys (hardness, modulus, yield strength, ductility, and impact energy).
Mathematical models to predict alloy properties.
Author Statement
Ahmed: Investigation, Methodology, Visualization, Conceptualization, Writing-review and editing;
Fardan: Investigation, Methodology, Writing-original draft preparation, review and editing;
Davies: Investigation, Methodology, Writing-review and editing.
Nomenclature
| BSE | = | Back Scattered Electron |
| CCM | = | Compositionally Complex Material |
| EDS | = | Energy Dispersive X-ray Spectroscopy |
| FCC | = | Face Centered Cubic |
| HCP | = | Hexagonal Close Packed |
| HEA | = | High Entropy Alloy |
| HIP | = | Hot Isostatic Press |
| HS | = | Hot Isostatic Pressed Stellite |
| ICP-OES | = | Inductively Coupled Plasma-Optical Emission Spectroscopy |
| MA | = | Mechanical Alloying |
| ML | = | Machine Learning |
| ODS | = | Oxide Dispersion Strengthened |
| SE | = | Secondary Electron |
| SEM | = | Scanning Electron Microscopy |
| TCP | = | Topologically Close-Packed |
| UTS | = | Ultimate Tensile Strength |
| XRD | = | X-ray Diffraction |
| Symbols | = | |
| C | = | Total area fraction of carbides |
| Cw | = | Tungsten content (wt.%) |
| Cc | = | Carbon content (wt.%) |
| Ccr | = | Chromium content (wt.%) |
| El | = | Elongation (%) |
| fc | = | Function with variables of Cc |
| fw | = | Function with variables of Cw |
| H | = | Vickers macro-hardness |
| I | = | Un-notched Charpy Impact Energy |
| L | = | Length |
| M | = | Mass |
| Rcw | = | Sum of relative tungsten and carbon content (wt.%) |
| Rcw* | = | Combined relative value of tungsten and carbon content (wt.%) |
| T | = | Time |
| Ys | = | 0.1% offset yield strength |
Supplemental Material
Download (21.2 KB)Acknowledgements
The authors would like to acknowledge the support of Dr Hao Yu for the experimental work. Deloro Stellite UK provided test samples used in this investigation.
Disclosure statement
The authors declare that they have no known competing financial interests or personal relationships that could have appeared to influence the work reported in this paper.
Supplementary material
Supplemental data for this article can be accessed online at https://doi.org/10.1080/2374068X.2023.2220242
References
- Ahmed R, Ali O, Berndt CC, et al. Sliding wear of conventional and suspension sprayed nanocomposite WC-Co coatings: an invited review. J Therm Spray Technol. 2021;30(4):800–861.
- Crook P. Cobalt-base alloys resist wear, corrosion, and heat. Adv Mater Process. 1994;145:27–30.
- Antony KC. Wear-resistant cobalt-base alloys. JOM. 1983;35(2):52–60.
- Ahmed R, Lovelock HLDV. Friction and wear of cobalt-base alloys. In: ASM HandbookVol. 18. Frict. Lubr. Wear Technol. 2018. pp. 487–501. DOI:10.31399/asm.hb.v18.a0006390.
- Frenk A, Kurz W. Microstructural effects on the sliding wear resistance of a cobalt-based alloy. Wear. 1994;174(1–2):81–91.
- Klarstrom D, Crook P, Wu J. Metallography and microstructures of cobalt and cobalt alloys. Metallogr Microstruct. 2004;9:0.
- Silence WL. Effect of structure on wear resistance of Co-, Fe-, and Ni-base alloys. J Lubr Technol. 1978;100(3):428–435.
- Kosel TH, Li SZ, Rao CM. The size effect in abrasion of dual-phase alloys. A S L E Trans. 1985;28(3):343–350.
- Cooper D, Davis FA, Wood RJK. Selection of wear-resistant materials for the petrochemical industry. J Phys D Appl Phys. 1992;25(1A):A195–A204.
- De Mol Van Otterloo JL, De Hosson JTM. Microstructural features and mechanical properties of a cobalt-based laser coating. Acta Mater. 1997;45(3):1225–1236.
- Yao MX, Wu JBC, Xie Y. Wear, corrosion and cracking resistance of some W- or Mo-containing Stellite hardfacing alloys. Mater Sci Eng A. 2005;407(1–2):234–244.
- Benjamin JS. Mechanical Alloying. Sci Am. 1976;234(5):40–49. http://www.jstor.org/stable/24950349
- Bhadeshia HKDH. Recrystallisation of practical mechanically alloyed iron-base and nickel-base superalloys. Mater Sci Eng A. 1997;223(1–2):64–77.
- Vaidya M, Muralikrishna GM, Murty BS. High-entropy alloys by mechanical alloying: a review. J Mater Res. 2019;34(5):664–686.
- Taha MA, Nassar AH, Zawrah MF. Improvement of wetability, sinterability, mechanical and electrical properties of Al2O3-Ni nanocomposites prepared by mechanical alloying. Ceram Int. 2017;43(4):3576–3582.
- Zadorozhnyy VY, Milovzorov GS, Klyamkin SN, et al. Preparation and hydrogen storage properties of nanocrystalline TiFe synthesized by mechanical alloying. Prog Nat Sci. 2017;27(1):149–155.
- Oñoro M, Macías-Delgado J, Auger MA, et al. Powder Particle Size Effects on Microstructure and Mechanical Properties of Mechanically Alloyed ODS Ferritic Steels. Metals. 2021;12(1):69.
- Suryanarayana C. Mechanical alloying: a novel technique to synthesize advanced materials. Research. 2019;2019(2019):1–17.
- Ahmed R, de Villiers Lovelock HL, Davies S. Sliding wear of blended cobalt based alloys. Wear. 2021;466–467(2021):203533.
- FORGE TWI: NOVEL COATINGS for SUSTAINABLE INDUSTRIAL FUTURE, TWI Ltd. (2020). https://www.twi-global.com/media-and-events/press-releases/2020/forge-novel-coatings-for-sustainable-industrial-future (accessed December 28, 2021).
- Ahmed R, Ashraf A, Elameen M, et al. Single asperity nanoscratch behaviour of HIPed and cast Stellite 6 alloys. Wear. 2014;312(1–2):70–82.
- Ahmed R, De Villiers Lovelock HL, Faisal NH, et al. Structure-property relationships in a CoCrMo alloy at micro and nano-scales. Tribol Int. 2014;80:98–114.
- Ahmed R, De Villiers Lovelock HL, Davies S, et al. Influence of Re-HIPing on the structure-property relationships of cobalt-based alloys. Tribol Int. 2013;57:8–21.
- Yu H, Ahmed R, de V Lovelock H, et al. Influence of manufacturing process and alloying element content on the tribomechanical properties of cobalt-based alloys. J Tribol. 2009;131(1):1–12.
- Yu H, Ahmed R, de Villiers Lovelock H. A comparison of the tribo-mechanical properties of a wear resistant cobalt-based alloy produced by different manufacturing processes. J Tribol. 2007;129(3):586–594.
- Yu H, Ahmed R, Lovelock HDV, et al. Tribo-mechanical evaluations of cobalt-based (Stellite 4) Alloys Manufactured via HIPing and Casting. Proc World Congr Eng WCE. 2007;2(2007):1385–1390.
- . Saveker JJ. Methods and apparatus for mixing powdery substances, particularly for manufacture of metal matrix composite (mmc. Materials. 2007;20100068087. Available form: https://patents.justia.com/patent/20100068087
- Ashworth MA, Jacobs MH, Davies S. Microstructure and property relationships in hipped Stellite powders. Powder Metall. 1999;42(3):243–249.
- British Standards Institution, BS EN 10002 - Tensile testing of metallic materials. UK. 2001. DOI:10.3403/BSEN10002
- Wood A. Introduction to numerical analysis. Harlow, Essex, England: Addison-Wesley; 2001.
- Hanselman D, Littlefield B. Mastering MATLAB 5 : a comprehensive tutorial and reference. New York: Prentice-hall; 1998.
- Huntley HE. Dimensional Analysis. New York: Dover Publications; 1967.
- Mcginn PJ, Kumar P, Miller AE, et al. Carbide composition change during liquid phase sintering of a wear resistant alloy. Metall Mater Trans A. 1984;15(6):1099–1102.
- Brouwer JL, Coutsouradis D. Influence of tungsten and carbon contents on the microstructure and properties of a cobalt-base hardfacing alloy. Cobalt. 1966;32:141–147.
- Callister WD,Rethwisch DG. Materials Science and Engineering: An Introduction. 9th ed. Hoboken NJ: Wiley; 2014.
- Atakok G, Kam M, Koc HB. Tensile, three-point bending and impact strength of 3D printed parts using PLA and recycled PLA filaments: a statistical investigation. J Mater Res Technol. 2022;18:1542–1554.