
Abstract
The objective of this study was to provide a basis for future updates to the 2010 ASHRAE Performance Measurement Protocols for Commercial Buildings (PMP) through case studies. The PMP defines a standardized method of measuring and analyzing building performance in six categories: energy, water, thermal comfort, indoor air quality, lighting, and acoustics. We conducted case studies for five buildings following the PMP. Based on experiences following the protocol in this wide range of buildings, we assessed the validity, reliability, and practicality of the PMP and provided comments and recommendations for future revisions.
Most of the measurement protocols at the basic level are reliable, practical, and valid. Many tasks at the intermediate and advanced levels, however, can be difficult to perform for some building types. Some of the tasks or measurement procedures were results from past research projects, and the software or tools recommended may not be readily available or fully supported. The measurement protocols at the intermediate level are only somewhat reliable and some of them are impractical. Most measurement protocols at the advanced level are complex and need to be performed by qualified or specially trained personnel and, thus, are impractical as a performance measure, except for specialized applications.
Introduction
Many buildings claim to be “green” or “high performance”; however, it is hard to tell how the building managers justify these claims and whether or not they are really true (ASHRAE Citation2010). ASHRAE’s Performance Measurement Protocols for Commercial Buildings (PMP; ASHRAE Citation2010) standardizes the assessment method of building performance and utilizes measurements and benchmarks outlined by various standards, guidelines, handbooks, and research studies. The PMP identifies what to measure, how it is to be measured (instrumentation and spatial resolution), and how often it is to be measured for inclusion in the building’s operation and maintenance plan (ASHRAE Citation2012).
The PMP was the first ever attempt by ASHRAE to document a standardized measurement approach to the technical elements of building performance assessment at a three-level, integrated set of measurement choices (basic, intermediate, and advanced). It covers six measurement categories including energy, water, thermal comfort, indoor air quality, lighting, and acoustics at the three levels. For each category and level, performance measures are discussed in terms of (a) measurement methods, (b) metrics, and (c) performance evaluation/benchmarking. The PMP has been field tested and evaluated through case studies of a few office buildings (Kim and Haberl Citation2017a, Citation2017b, Citation2012a, Citation2012b; Goins Citation2011; Heinzerling Citation2012. Many important issues associated with the current version of PMP—such as “the perceived energy performance of the case-study buildings is highly dependent on which benchmark the user utilizes” and “… spot measurements are optional for thermal comfort but required for indoor air quality, lighting, and acoustics …”—were identified. The feedback and recommendations for identified issues and modified approaches were proposed through case studies for the improvement of the protocols. However, these critiques were limited because previous PMP case studies focus on office buildings only. In addition, the advanced-level protocols in some measurement categories were not fully explored in previous studies. This research study complements the previous studies and thoroughly addresses the full range of measurement categories and levels.
In this research project, we conducted case studies for various types of buildings in three different climates. Furthermore, we performed comprehensive assessments of the PMP in six categories at the three levels. We made recommendations for future editions of the PMP based on experiences through these extensive case studies.
The three levels of PMP serve to gain an understanding of the building’s operations and maintenance to identify areas of improvement to reduce the use of energy and water and improve indoor environmental quality within the building. The basic level is described as indicative, the intermediate level is described as diagnostic, and the advanced level is described as investigative (ASHRAE Citation2010). With each level, detail and complexity of measurement and analysis increase.
Assessment methodology
ASHRAE Research Project 1702 involved implementing the PMP in five different buildings in various climates, of various ages, and with different occupant uses. The PMP assessment framework was built upon the criteria developed by Kim and Haberl (Citation2017a, Citation2017b, Citation2012a, Citation2012b) in their case study for an office building located in College Station, Texas.
In the context of PMP analysis, validity is defined as the legitimacy of metrics and benchmarking criteria recommended by the PMP. Questions that were addressed include whether or not the suggested metrics can be used to measure appropriate performance parameters and what the benchmarking criteria are. Also assessed was whether the referred standards and criteria in the PMP were out of date. Updated versions of the standards and criteria are included in the analysis.
Reliability deals with the accuracy and repeatability of the measurement methods recommended in the PMP. Questions addressed for this trait include whether the prescribed procedures yield accurate results and whether these methods are repeatable. Also addressed is the clarity and ease of understanding the current PMP text. If a procedure or description is unclear, clarification was suggested in the analysis of that section.
Practicality concerns the cost, feasibility, and ease of the measurements required by the PMP. Questions addressed for this value include the cost or financial burden of each measurement and/or analysis. If costs are high, suggestions for lowering costs may be included in the analysis. Ease of implementation is also important, and challenges faced through the implementation of PMP measurement and evaluation procedure are addressed in the analysis. Finally, the ability of each measurement to identify issues in the proper building performance category is also assessed.
A summary of findings and recommendations is presented, categorized by measurement methods, metrics, and performance evaluation/benchmarking.
Building descriptions
Diversity of selected case study buildings was a primary focus of the team in this research. We selected five buildings with a wide range of building types, space uses, HVAC systems, climates, and the years built.
Building A is a two-story state government office building located in Des Moines, Iowa, with 44,640 ft2 of gross area. The construction process started in 2008, and the building was officially occupied in 2011 with approximately 90 occupants. The building’s normal operating hours are Monday through Friday from 7:00 am to 6:00 pm, and the building is not open on weekends and national holidays. The high building energy efficiency was mainly due to the integrated design process that incorporated multiple energy efficiency measures. These include a high-performance building envelope, skylights for daylight-harvesting, sunscreens to block summer solar heat gain while allowing passive heating, a geothermal heat pump system with 42 water-to-air units, two water-to-water units for radiant heating, an energy recovery ventilator, and a roof-mounted 45 kW photovoltaic array. This building has private and open offices, conference rooms, copy rooms, a break room, a hearing room, and two records rooms. The building was awarded a LEED Platinum label in December 2012, with the ENERGY STAR® score of 100 in the same year.
Building B, located in Laramie, Wyoming, was constructed in 1960, although it has gone through some renovations with the last being in 2012. The building, with about 126 occupants, is a typical office building, containing both open and closed offices and conference rooms, and most spaces operate regular business hours (8:00 am–5:00 pm), Monday through Friday, except the second-floor open office area, which has varying hours seven days a week. The building is 28,400 ft2 in area on split levels, with one floor completely above grade, a one-floor section at grade, and one floor partially below grade. This office building is served by two air handler units (AHUs), one rooftop unit with DX cooling and electric heating, and three split systems. Two natural gas hot water boilers provide heating hot water to the heating coils in the AHUs on site.
Building C is also located in Laramie, Wyoming, and was completed in January of 2009 with approximately 120 occupants. The building contains both offices and a data center, as well as many student and staff support spaces, including a computer lab, instruction rooms, a help desk/repair shop, and a sales shop. Most spaces operate on regular business hours (8:00 am–5:00 pm), except the data center and open computer lab, which operate 24/7. The data center electricity is metered separately, but the computer lab is not. The building total is 86,664 ft2 in area and is three stories high with a basement and a fourth-floor penthouse for mechanical systems. There are two single-duct variable air volume (VAV) systems with heating hot water and chilled water for this building. Both chilled water and heating hot water are supplied by the central campus plant. In addition, there are six computer room air handlers providing cooling for the data center, and a 125-ton chiller serves as backup for cooling of the IT building.
Building D is located on the campus of the University of Alabama, in Tuscaloosa, Alabama. This building was opened in 2012 and has a total floor area of 175,000 ft2 with three floors. The building mainly consists of research and teaching laboratories, classrooms, conference rooms, and faculty offices. In addition, there are assembly areas, kitchens, team rooms, copy/print rooms, and graduate student offices. The number of occupants is about 80 in office areas, but the number of occupants in classrooms and laboratories varies. This building operates 24 hours per day seven days per week except offices, which operate regular business hours (8:00 am- 5:00 pm) Monday through Friday. AHUs equipped with energy recovery units supply 100% outside air to the laboratory spaces through terminal VAV boxes. Chilled water and hot water are delivered from the campus central energy plant. There are 10 AHUs and more than 230 VAV terminal boxes. Meters (electrical and thermal) and sensor data from the building automation system have been trended and collected. An on-site weather station was installed for real-time weather information.
Building E, also located in Tuscaloosa, Alabama, was built in 2000. The 62,600 ft2 four-story facility includes residential space for students, faculty offices, a reading room, and a computer room. In addition, there are assembly area and team rooms. There are about 200 occupants in this building. This building operates 24 hours per day and seven days per week for the Spring and Fall semesters. The operation schedule in the summer and winter break is varied. One air-cooled chiller is used to provide the cooling to the spaces, while the heating is provided by the campus central energy plant. There six AHUs serving multiple fan coil units in the spaces.
Performance measurement plan
A performance measurement plan was created for each selected building. The performance measurement plan for Building A is presented in through 3 as an example. Specific tasks for each level of the PMP were selected for implementation. through 3 summarize the selected tasks for the basic, intermediate, and advanced levels, respectively, for Building A. Plans for the other buildings are documented in the final report for ASHRAE Research Project 1702 (Wang et al. Citation2018).
Table 1. Building a performance measurement plan: basic level.
Table 2. Building a performance measurement plan: intermediate level.
Table 3. Building a performance measurement plan: advanced level.
Assessment of validity, reliability, and practicality
Selected results of performance measurement tasks from this research project are presented in this section, along with commentary on the assessment criteria. The commentary includes both the positive and more challenging aspects of the team’s experiences. Complete results for all categories and levels are given in the final report for ASHRAE Research Project 1702 (Wang et al. Citation2018).
Energy/intermediate level/end-use breakdown
Building A
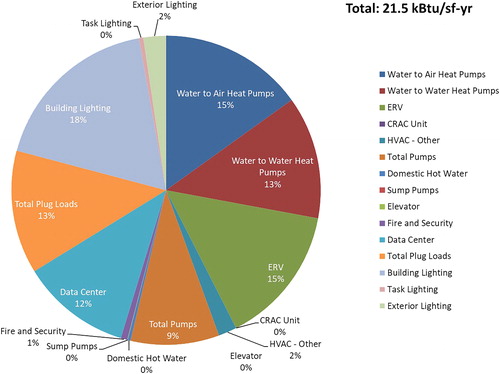
As shown in , the HVAC system consumed the most energy, accounting for 54% of the total energy consumed by the building. Lighting accounted for 21% of the total, the plug load composed 13%, and the data center, domestic hot water, fire and security, and elevator made up the remaining 13%. These end uses were obtained from submetered data.
Fig. 1. Building A electrical use profile.
Building C
Major end uses were evaluated in Building C through submetering, including the building mechanical system electricity and the data center electricity (both for mechanical systems and for equipment). These end uses can be compared to total building electricity use, and a breakdown of electricity end-uses can be evaluated.
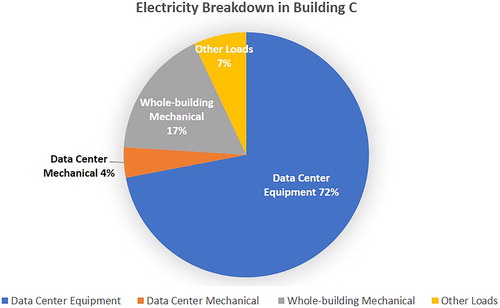
All three energy uses, whole-building electricity, data center electricity, and mechanical system electricity were monitored simultaneously from March 2017 to June 2017. shows the electricity use breakdown during the monitoring period in the building. The percentage breakdown was as follows: data center equipment, 72%; data center mechanical, 4%; whole-building mechanical, 17%; and other including lighting and miscellaneous electric loads, 7%.
Fig. 2. Building C electrical use profile.
Assessment
Validity
Building end-use breakdown is required in the intermediate level of the PMP energy section. Understanding the distribution of energy (end uses) within a building is important in making decisions and suggestions for improvement. The end-use breakdown is a valid indicator of building subsystem performances and may vary in the level of details. However, no benchmarking is provided for end-use analysis in the PMP. A building simulation model representing design intent, if available, can be used to benchmark end-use breakdowns against its design intent.
Reliability
There is no one standardized way to measure end uses and calculate the end-use breakdown for a building. The process of submetering end uses could be significantly different for each building depending on system and building design and may have a different number of end uses that require different types and/or numbers of submeters. Submetering 95% of the end uses is feasible if designed properly, but this would be cost-prohibitive if submetering was not planned in the design stage. Building A was heavily submetered as part of the design for new construction. This intensive level of detail in submetering is highly unusual. The level of submetering for Buildings C is typical.
The only way to truly assess building energy end uses is to monitor all major end uses simultaneously for a set period. If significant changes in occupancy, equipment loads, or operations occur after assessment, original end-use breakdown numbers may not be reliable.
Practicality
In many cases, it may not be possible to submeter all end uses due to the cost of submetering or electrical system design. For Building C, a whole-building electricity meter and two data center meters for equipment loads and mechanical systems were installed as part of the design. Electricity use for HVAC systems serving the building area excluding the data center was not metered by design. During this case study, a submeter for monitoring the HVAC systems electricity usage was installed. The cost of this submeter including installation was ∼ $1,800. The cost of submeters may be prohibitive for many facilities. Unless submeters for all end uses were already installed, significant additional costs may be needed to submeter all end uses. It is recommended to move the submetering requirement to the advanced level if submeters are not readily available.
Energy/advanced level/whole-building inverse energy use models
Building A
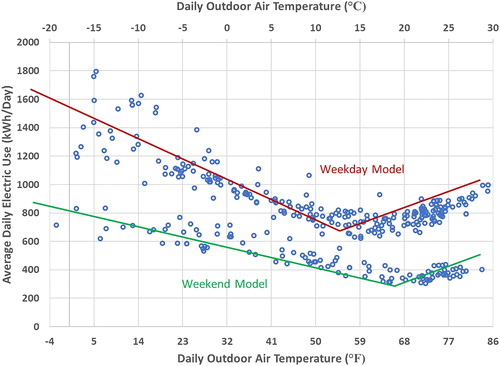
More than 1,000 HVAC and building energy data points, including all circuit-level electric submeter power and energy data, were collected using the building automation system since April 2012. The HVAC and energy data collection was part of Building A’s LEED application effort and sensors and instruments were carefully selected and checked. Power meter data were recorded in 15-minute intervals, and the HVAC data were recorded in 5-minute intervals. All raw data sets were been processed using MATLAB software into the hourly, daily, monthly, and annual formats. The hourly data were used for calibrating the building energy simulation model and the daily data were used to create the advanced-level building inverse energy use models. A four-parameter (4-P) change-point linear regression model incorporating average daily outside air temperatures for 2013 is illustrated in .
Fig. 3. Building A daily electric energy use vs. outside air temperature.
The output parameters for the best curve fit for the model are given in . The goodness-of-fit for the 4-P models can be judged based on the R-squared values. A value of 1.00 means a perfect fit, and values above 0.80 are typically a very good fit.
Table 4. Building 4-parameter change-point linear model parameters.
Assessment
Validity
The overall whole-building energy use inverse model approach is valid. The building energy use profile can be simplified by applying a regression model for the measured data. These whole-building inverse models can be used to predict energy usage at certain temperatures (or other environmental parameters) or to evaluate the effect of energy conservation/efficiency measures on the building energy usage after implementation. This method creates a simplified model that does not account for all the parameters that may influence a building’s energy use, but it can show seasonal and weekday/weekend data that are quite useful in assessing energy use patterns and trends.
Moreover, with the rapid development of machine learning and information science in the last decade, many sophisticated data-driven algorithms, such as decision tree, ensemble learning, graphic network, and deep learning, are applied in the field of building energy estimation. Some inverse data-driven modeling approaches could be considered as alternatives for inverse change-point models.
Reliability
Whole-building inverse models can be developed for any time period for which energy use and environmental parameters are available. A higher frequency of data will produce a more reliable model. If the data are available, models can be applied for any energy type (e.g., electricity or whole-building) and any environmental parameters (e.g., temperature or humidity) and is, thus, repeatable and widely applicable, depending on the quality of data available and the building’s characteristics.
Practicality
Energy use was plotted against environmental parameters (most often outdoor air temperature), and then ASHRAE’s Inverse Model Toolkit (IMT; Kissock et al. Citation2004) can be used to generate the inverse model. Once the IMT program’s process is understood, generating a model for application to a dataset is simple. The model can then be used to predict energy use according to environmental parameters or be used to compare energy use to future energy use.
ASHRAE’s IMT program uses FORTRAN as a computer programming language, which should be updated. For Building A’s inverse model, the software “R” was used, which is a free software environment for statistical computing and graphics. Other software such as MATLAB is also capable. A new computer program had to be developed to process the data in Microsoft Excel format to determine the best-fit parameters for the whole-building energy inverse model. The software used to calculate the parameters for these models accurately may vary depending on the engineer’s background, understanding of the models, and familiarity with certain statistical software’s capability to generate correct model parameters.
Water/basic level/water use indices
Building C
Water use indices (WUIs) by square footage and by occupant were calculated for each year of available data. shows Building C’s water metrics in respect to square footage and shows the water metrics in respect to the number of building occupants. Water costs were not available for this building.
Table 5. Building C WUI calculations.
Table 6. Building C water/occupant calculations.
The DOE FEMP Water Use Indices (Citation2009) table suggests that an office building’s minimum consumption of water would be 15 gallons per employee, per day. There are 120 full-time employees in Building C. Since the building has student computer labs, training rooms, and conference rooms, the actual number of occupants may be larger than 120. It is assumed that Building C has 120 occupants for water usage assessment. The average water use per occupant per day for Building C is 7.0 gallons. Building C has performed much better than this benchmark. If the estimate of 120 occupants is too low, a higher occupancy would yield a WUI lower than 7 gallons/person/day. CIBSE’s Water Use Indices (Citation2004) indicate that an office facility without canteen facilities should use 10.57 gallons of water per employee, per day. Building C performs much better than this benchmark for the year June 2016 to 2017.
Assessment
Validity
Calculating water use index (WUI) and water cost index (WCI) for a building is the main outcome of the utility bill analysis of the basic level water PMP section. Converting water usage data to a WUI or WCI basis enables the team to evaluate water use over time in a simplified metric. The team can assess current and historical building water use on a total building level.
Reliability
The PMP requires that water utility bills should be collected for the building, as it is the least expensive and easiest way of knowing a facility’s water use. The annual or monthly data are then converted into WUI and WCI. WUI or WCI calculations simply require that water use (or cost) is divided by building square footage or the number of building occupants. The number of occupants is required in the assessment for building water usage. The occupancy can be obtained based on counting working stations or on actual number of employees. However, the real-time occupancy varies and is hard to measure. The uncertainties in the number of occupants in buildings will affect the accuracy of building’s WUI and WCI calculations.
DOE FEMP Water Use Indices (2009) and CIBSE Water Use Indices (Citation2004) are different for the same type of buildings. In general, WUIs in DOE FEMP are higher than those in CIBSE for the same building types; however, DOE FEMP provides a few more building types than CIBSE.
Practicality
The process of collecting and analyzing utility data is simple if the building managers keep good records of the utility bills. The calculation itself is a division of water use and water cost over building square footage or building occupancy. The team did not face any trouble performing this calculation.
The team did, however, face challenges in Building C, as domestic water use is not recorded from the meter on a monthly basis (or on any time period). This caused difficulty in calculating WUI and WCI for this building, and eventually, the facility managers had to begin recording the meter data manually each month. When one year’s worth of data were available, the team could calculate WUI, but not WCI (cost data not available).
Thermal comfort/basic level/occupant survey
Building A
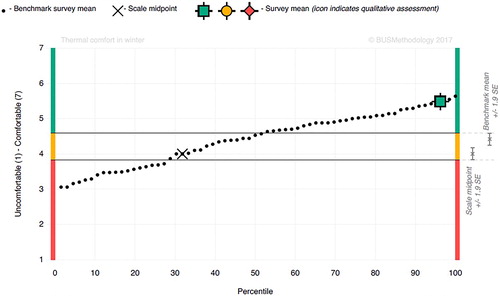
A web-based building occupant BUS survey (BUS Citationn.d.) was conducted in November 2016 for Building A to assess the basic-level indoor environmental quality including thermal comfort, indoor air quality, lighting/daylighting, and acoustics. The survey responses were collected over a three-week period. A total of 38 responses (out of 78 occupants) were received, resulting in about 48% occupant response rate. The survey results for thermal comfort during the summer and winter seasons are shown in and , respectively. The benchmark surveys to analyze the collected data are shown in for summer and in for winter. Our survey results on thermal comfort were compared to the BUS survey database, which is based on buildings in the United Kingdom, for both summer and winter. The survey mean for Building A is 3.6 for summer and 5.43 for winter, with thermal comfort survey scale of 1 through 7 (1 = uncomfortable and 7 = comfortable). The survey mean for summer is within the range of 1.9 standard error of the BUS benchmark mean. The survey mean for winter is well above the BUS benchmark, meaning that occupants in Building A felt more comfortable in winter than most occupants in buildings in the United Kingdom.
Fig. 4. Building A BUS survey result: thermal comfort in summer.
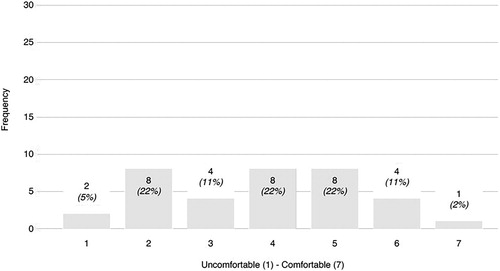
Fig. 5. Building A BUS survey result: thermal comfort in winter.
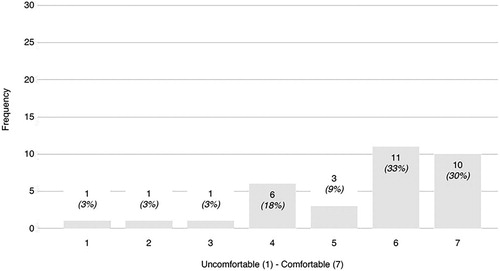
Fig. 6. Building A BUS survey benchmarking: temperature comfort in summer.
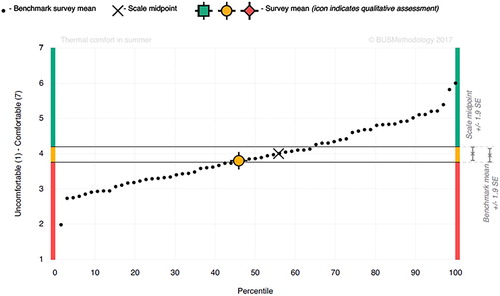
Fig. 7. Building A BUS survey benchmarking: temperature comfort in winter.
Assessment
Validity
The BUS survey (BUS Citationn.d.) has benchmark sets for UK domestic buildings and for nondomestic buildings in the United Kingdom, New Zealand, Australia, and Canada and an international benchmark set. Therefore, this survey should be used for buildings in these regions.
The BUS Methodology (BUS Citationn.d.) is delivered through the partner network. These organizations receive training and attend quarterly meetings where best practices are shared and discussed. It is recommended the benchmarking of the BUS survey should be done through the qualified and authorized partner network.
CBE surveys have been conducted for the other four case study buildings of the project (CBE Citation2008). The CBE survey is a valid method of assessing occupant opinions on indoor environmental quality parameters. The seven questions relating to thermal comfort adequately address potential issues within the building and invite occupants to specify other issues that may not have been addressed by the questions.
Reliability
It was determined that survey results and building maintenance log analyses generally correlate, as both are examined over a period. Surveys ask for an occupant’s opinion as developed over time in the workspace and log analyses are also over a longer period (not instantaneous). This method of survey is repeatable and applicable to many applications, although the overall surveys for both CBE and BUS are heavily geared toward traditional office buildings.
The main advantage of a paper survey is relatively high response rates. Typically, a surveyor might hand questionnaires out in the morning (on colored paper, so they are easy to identify) and then collect them in the afternoon. One person can administer about 200 questionnaires in a day in an open plan office environment. Additional benefits of the paper survey are that comment data will usually be of higher quality, with more comments and fuller responses. The major disadvantage of this approach is the time it takes to enter the data for processing.
The main advantage of an online survey is a short time to distribute the survey and the ease of data input. A link to online BUS survey is available to be distributed to the building occupants, and data are automatically collected at the server hosting the survey as occupants complete the questionnaire. The main disadvantage is the lower response rate. The following things could help: an e-mail introducing the survey from a very senior/most senior member of staff, a prize draw, or other incentives. Even with these incentives, some organizations have still struggled to get good response rates. Online surveys often yield far fewer comment responses or single-word/abbreviated comments. It is recommended keeping the online survey open for two to three weeks, with periodic e-mail reminders.
Practicality
The PMP set a minimum of 40% survey response rate threshold as an appropriate level for survey analysis. For Building A, the BUS survey was conducted using the online survey format and the data collection period was three weeks. About a 48% response rate was achieved. For Building D, a CBE survey based on the paper-based survey template was distributed to occupants through e-mails first. In addition, an online web survey using the CBE template was created and shared with all occupants four times during the two-month survey period. Only 16 of 80 occupants took the survey, resulting in a poor response rate of 20%. Most of the occupants in Building D are faculty and graduate students. Their working hours are flexible; therefore, it is difficult to directly hand out the paper-based questionnaires to them. It is also noted that the information describing the BUS survey in the PMP is insufficiently detailed or is outdated.
Thermal comfort/advanced level/occupant comfort
Building C
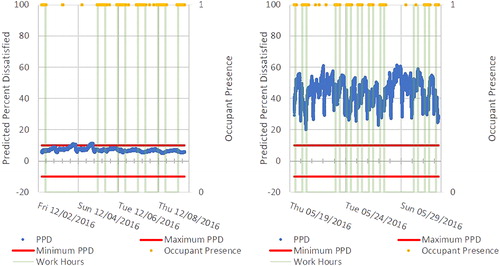
The advanced level requires continuous measurement of thermal comfort parameters, including temperature, humidity, and mean radiant temperature. These parameters are then used to calculate predicted mean vote (PMV) and predicted percentage dissatisfied (PPD; ASHRAE Citation2013a).
A MATLAB code was created to calculate PMV and PPD for each minute of data collected for each of Building C’s locations. These calculations are presented graphically in and for a break room in Building C.
Fig. 8. Predicted mean vote (a) winter and (b) summer for the break room.
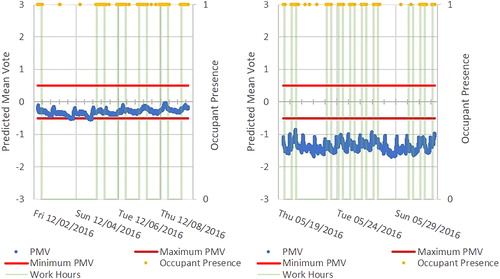
Fig. 9. Predicted percentage dissatisfied (a) winter and (b) summer for the break room.
PMV remained outside the limits of thermal comfort for the entire summer season; however, during the winter season, PMV results were within limits for nearly the entire measurement period.
PPD varied more widely in the summer season of measurement and remained above the 10% PPD limit for the entirety of the measurement period. This indicates that most occupants would be dissatisfied with the thermal comfort of the room during the summer. In contrast, results during the winter period generally remained within PPD limits and vary less widely.
Assessment
Validity
PMV and PPD are widely accepted standard metrics of thermal comfort. Temperature, globe temperature, relative humidity, and air velocity, along with clothing level and metabolic rate, are used to calculate these metrics. According to ASHRAE Standard 55 (2013a), PMV values between −0.5 and +0.5 are acceptable and PPD values between −10% and +10% are acceptable.
Reliability
With quality data, PMV and PPD data are repeatable for any instant of time. However, the “Models, analysis, and reporting” section in the “Measurement methods” in the PMP does not really address how the advanced-level field measurement should be done. Most of the text in this section should be in the “Measurement methods” section. In this case, PMV and PPD were calculated for each minute of collected measurements (averaged).
Practicality
PMV and PPD calculations are relatively complex. In this project, the team created a MATLAB code based on the FORTRAN code in the normative Appendix C of ASHRAE Standard 55 (2013a) to convert the six changing parameters (temperature, globe temperature, relative humidity, air velocity, clothing level, and metabolic rate) into PMV and PPD. Values for each minute of data were then graphed and compared against ASHRAE Standard 55 comfort zones. An expert user is required to properly conduct this analysis.
Indoor air quality/intermediate level/CO2 level measurement
Building D
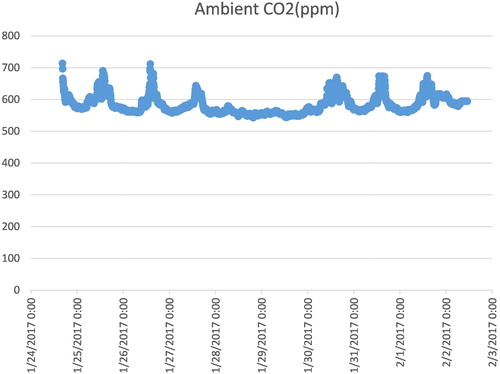
Return air CO2 levels were measured in Building D. A “Right Now” survey was taken by an occupant in a research lab, on April 15, 2016. Based on the survey result, he did not feel uncomfortable about indoor air quality. A CO2 sensor was placed in a research lab return air grille to measure the CO2 level of return air for a week. Because the ceiling is very high, duct tape was used to secure the CO2 sensor. The return air grille location is shown in . Results show stable CO2 levels between 550 and 700 ppm. One-week measurement of the CO2 level in the return air grille is summarized in .
Fig 10. Return air grille location in research lab.
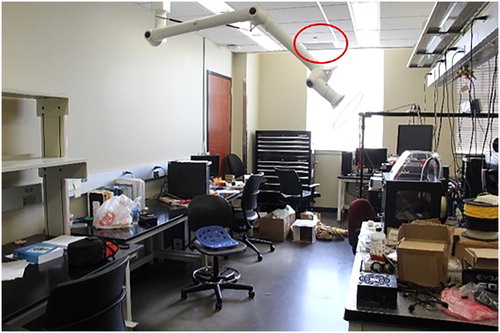
Fig. 11. One-week measurement of return air CO2 level, building D.
Building C
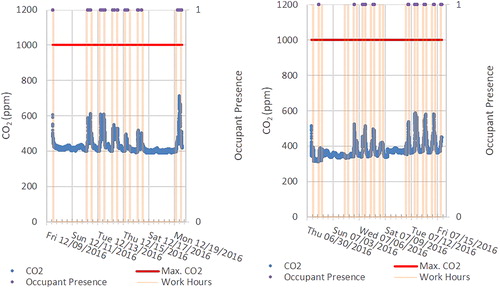
Continuous measurements of various indoor air quality parameters were taken for at least one week within a season for each of the rooms studied in Building C. CO2 concentration was measured and recorded for each second. The CO2 concentrations during the week vary dynamically with occupancy. The CO2 concentrations peaked during occupied hours while they were generally flat during unoccupied time periods. Data were then processed and are summarized below.
Results for Building C’s conference room are found in . CO2 levels remained well below 1000 ppm in both winter and summer measurement periods. ASHRAE Standard 62.1 (Citation2013b) recommends that indoor CO2 concentration should not be greater than 700 ppm above outdoor air level. Outdoor CO2 concentration ranges from 300 to 500 ppm. Thus, 1000 ppm was used as the benchmark for indoor CO2 level assessment.
Fig. 12. CO2 concentrations, (a) winter and (b) summer in the conference room.
Assessment
Validity
CO2 is a commonly measured air quality parameter used as a surrogate for proper ventilation for human respiration and is recommended for continuous measurement at the intermediate level of the PMP. The continuous monitoring can help the team figure out when a parameter may go outside the suggested range, indicating inadequate ventilation or becoming potentially dangerous.
Reliability
Continuous measurement of various air quality parameters is required at the intermediate/advanced level of the PMP. For Building C, the team utilized sensors or meters built within an indoor environmental quality (IEQ) toolbox to continuously monitor temperature, vertical and horizontal daylighting, CO2, volatile organic compound (VOC), air velocity, relative humidity, particulates, and occupancy. Each of these sensors require calibration, which was done either by the manufacturer or using a known value for comparison. The CO2 meter with an accuracy of ± 30 ppm was used in Building D measurements. The only issue encountered was that the Building D return air grille is mounted on the ceiling of the space. It was not easy to directly place the CO2 meter into the desired position, so duct tape was used to support the CO2 meter, which may slightly affect the measurement result. In addition, in the PMP “Measurement methods” section, it is not clear what instruments and tools are needed for indoor air quality (IAQ) pollutant measurements.
Practicality
Continuous monitoring of CO2 requires that either a single continuous monitoring sensor is used or an IEQ toolbox is constructed. For Building C, the team constructed the IEQ toolbox incorporating sensors for continuous measurement. The construction of an IEQ toolbox can be costly and complex, making continuous monitoring without a detailed building control system a challenge, but it allows for placing the instruments at multiple locations.
In Building D, a handheld CO2 meter was taped at the air return duct with duct tape. The CO2 sensor was placed as close as possible to the air return grille. The CO2 concentration was monitored every 5 minutes for one week. It was difficult to continuously measure CO2 level near the return air grille using the portable instrument (IAQ meter or CO2 meter). The portable instrument cable was not long enough, and there was not a good location to support the instrument reliably. In most buildings, the return air grilles are located on the ceiling, making placement of this sensor difficult.
Lighting/advanced level/HDR image luminance and luminance ratios
Building A
Several high-resolution images at different locations were taken in a private office and an open office in Building A at a range of exposures. The software package Photosphere was then used to combine and convert these images to .hdr format and obtain the luminance values at specified work point locations. A luminance meter was also used to directly measure luminance levels at the same locations for comparison purposes. and list these values for the private office and open office, respectively.
Table 7. Building A luminance comparison for the private office.
Table 8. Building A luminance comparison for the open office.
Comparing the two sets of data for the open office and the private office, the values calculated using HDR image and Photosphere software are fairly close to those measured using a luminance meter in most cases, especially when lights are mostly diffuse (in the private office). Bigger discrepancies did occur at special surfaces such as windows, computer screens, shades, and blinds or in locations with a lot of direct/reflected/redirected solar and electric lights (in the open office).
The luminance ratios were calculated using the Photosphere software for the two offices and are shown in . Comparing with luminance ratios obtained using the luminance meter, these values were of the same magnitude. A similar conclusion could be made: Two values out of three exceeded the maximums for the open office, but ratios are generally acceptable for the private office. This is consistent with the design intent that the open office fully utilizes daylighting. However, visual comfort may be compromised in this space.
Table 9. Building A luminance ratio using HDR images.
Assessment
Validity
HDR photography is a relatively new method for evaluating a space’s lighting levels, including relative luminance and glare. These images allowed the team to assess the space’s light level acceptability and where, if present, issues occur. Camera technology and HDR analysis software are becoming more advanced and useful in analyzing a space’s lighting metrics.
The luminance ratios calculated using HDR images show that the open office in Building A had glare issues overall, which is consistent with the direct measurements from the intermediate level.
Comparing the luminance values obtained using Photosphere software, based on HDR images, with the measured values using a calibrated luminance meter, it was observed that in most cases, the two methods generated close enough results when the space had a low luminance ratio and less contrast. Large differences were observed for high luminance levels, as well as complex lighting situations where a lot of direct/reflected/redirected solar and electric lights are combined. Therefore, it is recommended that the HDR photography method can be a valid means of determining unacceptable glare as a performance indicator in normal situations, but the method should be used with caution when lots of daylighting and complex lighting situations are involved.
Reliability
HDR image processing can be challenging to learn if the team is not already familiar with the process and associated software. The process of taking HDR photographs is not clearly addressed within the PMP; however, references are provided for further information. HDR photographs are highly dependent on the quality of the camera used and the camera setup. A camera should remain completely still between photographs to assure that the images can be combined accurately.
Differences in cameras will affect the ease with which HDR images are created. Some modern cameras have HDR imaging built into the camera’s programming, and others require the use of the manual camera settings to take a series of photos. Regardless of camera technology, it is important to understand the complete HDR process prior to photographing the space in question.
Practicality
When using HDR photography to obtain lighting-related parameters, it was not clear how the raw images (used to convert to HDR images) should be taken. Information or guidelines on the number of raw images, raw image format, various camera settings (aperture, shutter speed, film ISO level, and "exposure value," etc.), and their relationships should be provided and only a qualified photographic specialist should take these measurements.
Acoustics/intermediate level/reverberation time calculations
Building C
Reverberation time, the time (in seconds) that it takes for a loud noise to decay 60 dB, was measured at the intermediate level for acoustic performance. There are two methods to measure reverberation time in a room: the impulse excitation method and the interrupted noise method. Our measurements were performed according to the impulse excitation method, using the popping of a balloon as the impulse. A sound level meter recorded the reverberation time measurements for each one-third octave band between frequencies of 250 Hz and 4,000 Hz. We presented measurement results of reverberation time taken in one of the conference rooms in Building C (). The conference room yielded a reverberation time of 0.53 seconds. This complies with the recommended sound criteria for conference rooms within office buildings, which is less than 0.6 seconds. shows the reverberation time measurements within a conference room in Building C.
Fig. 13. Reverberation time measurement locations for the conference room (locations: “m” = measurement location; “pos.” = locations where balloons were popped).
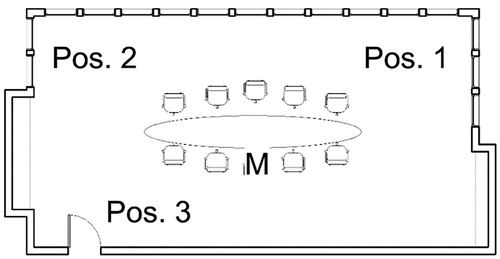
Table 10. Reverberation time results for the conference room.
Assessment
Validity
There are two methods to measure reverberation time in a room: the impulse excitation method and the interrupted noise method. Each method will allow you to calculate the reverberation time, or the time it takes for a sound to drop 60 dB in a room. What differs is your measurement setup and a noise generator. Both methods are valid.
Reliability
The PMP recommends that intermediate acoustic measurements should be taken by an acoustical consultant or someone with training in acoustic measurement tests. In addition, the level of skill that the acoustic tester may have influenced the accuracy of the measured results.
When the team measured reverberation time in a variety of space types, the sound pressure level meter continuously gave errors stating that background noise was too high in the room when reverberation time tests were performed. This leads to reverberation time results that may be inaccurate; however, there is no way to reduce the background noise in these spaces. Particularly, the open computer lab space adjoins other noisy spaces (reception, hallways, etc.) and contained some occupants who continued typing, etc. while measurements were taken.
Practicality
The impulse excitation method requires at least two individuals, one to hold the sound pressure level meter and start the reverberation time program and one to pop a balloon at a location within the room.
Conclusions and recommendations
Based on building case studies from the ASHRAE research project 1702, we proposed detailed recommendations as a basis for updates to the 2010 ASHRAE PMP. Some of the key recommendations are discussed in this paper. We first present general recommendations and then specific recommendations for each category, followed by conclusions and future work.
Summary of findings and recommendations
summarizes the high-level findings from our case studies and recommendations for the future edition of the PMP. The team identified the pros and cons of each measurement method, metrics, and benchmarking using an “assessment score” ranging from 1 to 4 as described:
Table 11. Summary of findings.
1 = The measurement does what it is intended to do at this level and was readily implemented.
2 = The measurement does what it is intended to do at this level to a large extent and was nearly readily implemented.
3 = The measurement needs some significant revision, but most of the issues can be addressed and clarified. The measurement can be implemented after the revision.
4 = The measurement does not adequately indicate performance at this level, was difficult if not impossible to implement, and/or can be done but is of insignificant value.
Expanded discussion of findings and recommendations
Key findings and recommendations are given here to illustrate the range and diversity of our results.
General recommendations
M-1. Provide a general information category
The PMP basic level energy section requires that basic building characteristics are collected. Basic building characteristics are used for all six PMP categories and, thus, a general information or seventh PMP category should be created. Building operations information, as well as building operator interview results, should be included in this category.
M-2. Technicality and complexity of advanced-level measurements
Some advanced-level methodologies or procedures essentially are based on U.S. DOE national lab level research projects, which are very difficult for a normal building/HVAC consultant to implement due to the high cost of instruments and areas of expertise that are beyond just mechanical/HVAC, thermal comfort, and indoor air quality. For example, lighting/daylighting and acoustics are very specialized, and the intermediate- and advanced-level measurement and testing should only be conducted by professionals in those research areas.
Energy
E-1. Seek building owner and facility management support
The PMP should emphasize that it is highly recommended that the implementer should seek full support from the building owners and the facility managers at the beginning of the project. The implementer should communicate with them the measurement plan, timeline, and tasks that need their help and collaboration. This is extremely critical for a successful project, as key design and build documents, occupant survey, building operator interview, data trending and collection, site visit, and facility operations support will all be needed.
E-2. Clarify procedures for analyzing energy-intensive spaces
The inverse modeling method may not be effective in analyzing spaces with a very high electricity load. Electricity uses within such spaces are more or less constant as the outdoor temperature changes. Therefore, it is difficult to compare changes in energy use or the feasibility of energy efficiency measure implementations. Either a calibrated energy model should be used, or the building can be broken down into energy-intensive and non-energy-intensive spaces to analyze changes in energy use over time separately.
E-3. Recommendations for the whole-building calibrated simulation approach section
It is highly recommended that the calibrated simulation model be adjusted based on the original building simulation model during the design phase, and the energy modeler should be already familiar with all aspects of the building design and operations. Only highly qualified professional building energy modelers who are familiar with ASHRAE Guideline 14 are recommended to use this approach.
E-4. Provide detailed procedure on how to determine whole-building inverse energy use model types and parameters
A new computer program needs to be developed to process the data in Microsoft Excel format and find out the best-fit parameters for the whole-building energy inverse model. The original software written in FORTRAN is obsolete and could only process text data file. Knowledge of statistics and curve fitting are needed to understand and find out the best-fit parameters given a form of the inverse model.
Water
W-1. Add water meter resolution requirements
It is recommended that the water main meter or submeter used in the measurement and verification (M&V) project should have adequate resolution.
W-2. Add procedures for the measurement of a centralized landscaping water system
Based on our case study experience, monitoring landscape water for a building served by a centralized landscape water system is rather complicated. It is recommended to move submeter installation to the advanced level of water use performance measurement if no independent landscape water meter is available for use.
Thermal comfort
T-1. Include both optional and mandatory measurements
The basic level thermal comfort suggests that spot measurements of parameters relating to thermal comfort are optional. Measurements of these parameters can be very beneficial in identifying what type of issues are occurring in the building and where in the building they are occurring. It is suggested that spot measurements of temperature, humidity, mean radiant temperature, and air velocity be required, as these are essential in calculating occupant comfort levels through predicted mean vote and predicted percent dissatisfied values. These indicators may help identify problem areas within the building. The measurements with an infrared camera, a fish-eye camera device for sun path prediction, or pyranometer for solar radiation can be optional at the basic level.
T-2. Add BUS survey information
There is a lack of information on the BUS survey and its benchmarking in the current PMP. It is recommended to add these detailed based on information from the “Building A Case Study Report” (Zhou et al. Citation2018)
T-3. Clarify differences in measurement method results
CBE “Right Now” survey distribution method.
The PMP mentions two methods of distributing “Right Now” surveys: self-initiation and solicited response. The PMP also mentions that survey results will differ between measurement methods, stating that the self-initiation method will yield more unsatisfactory results, since occupants often feel motivated to record issues when they occur when they have control over when they take the survey. The results could be very different, and how to assess the results according to their distribution method should be clarified.
T-4. Provide more information on the ASHRAE and SCTs databases for benchmarking
The PMP does not describe the details of the ASHRAE and SCTs databases and the procedure to benchmark building performance using data/survey responses collected for the intermediate level. The research papers and database are more than 15 years old and cannot be easily obtained.
Indoor Air Quality
I-1. Outdoor air flowrate measurement
It is recommended that the PMP provide additional information on outdoor airflow measurements. Directly measuring outdoor air flow rates by traversing a duct may need building owner and facility management’s consent if holes must be drilled into existing ductwork. Care needs to be taken when selecting locations for the measurement. The air velocity meter used in sampling air velocities in the duct needs to be calibrated within one year.
I-2. Locations for zone CO2 measurement
In some cases, it is difficult to continuously measure CO2 level near the return grille using the portable instrument (IAQ meter or CO2 meter.) The return air grille locations may be too high and there is no support for holding the instrumentation. It is recommended to add procedures to monitor CO2 concentration near return grilles.
Describe tools needed for measuring CoCs
The tools/multi-sensors to measure selected contaminants of concern (COC) such as formaldehyde, lead, nitrogen dioxide, odors, ozone, SO2, and radon are not clearly described in the PMP (pp. 138–142). The cost for a comprehensive advanced-level IAQ measurement evaluation may be prohibitively high, since these measurements must be done by an IAQ specialist/contractor with skills and experience in this type of measurement. VOCs measured by different sensors can be very different because the sensors may be sensitive to different types of gases. Since there is no common definition as to which gases are to be included, this is an inherently unreliable IAQ performance measurement.
Lighting
L-1. Address influences that affect measurement results
Influence of weather conditions
Measurements of luminance and illuminance are highly dependent on outside weather conditions. While the PMP states that weather conditions must be stated in the report, it is hard to compare measurements to recommended lighting levels with much accuracy (e.g., if it is cloudy on measurement day, you may assume that measurements would be slightly higher on a sunny day, but how much higher and what will be considered acceptable?).
Influence of time of day
Like weather conditions, time of day also influences results from lighting measurements. Measurements at noon will be different than those at 4:00 pm and those at 9:00 pm. Perhaps lighting measurements should be made at different times of day in order to compare results to each other and to the recommended lighting levels. This is especially important for buildings that are used both during the day and at night.
L-2. Update the latest software information on calculating various glare indices
PMP needs to provide detailed information on commercially available software that can calculate these glare indices. The software needs to be robust, be easy to use, and have detailed documentation on installation, modeling, and executing. The person who provides the M&V needs certain skills and qualifications.
L-3. Provide basic instructions for HDR photography and HDR image processing
Creating HDR images can be a difficult process, especially if the team is not familiar with cameras, photography, and image software. It would be beneficial to include information on the process and equipment needed to create these images before post-processing.
Commercial software with full technical support for HDR image processing is hard to find. The PMP suggests that Photosphere is used to process HDR images. The team utilized Photosphere to combine images into an HDR image but did not explore the analysis capabilities of the software. HDRScope was found to be useful software for finding luminance and luminance ratios and performing glare analysis for the images taken in Building C. It would be useful to include a general step-by-step process for analyzing HDR photographs in common software.
Acoustics
A-1. Address influences that affect measurement results
The height of microphone versus resultant accuracy when compared to standard criteria
The PMP states that sound pressure level measurements should be taken at a height that you would typically find an occupant’s ear. In many different buildings and different space types, this height can vary greatly. For example, many modern office buildings contain desks that are adjustable to sitting or standing heights and depending on occupant preferences, results may be very different. In addition, space types such as corridors, lobbies/reception spaces, and gym/exercise spaces can vary in the height of occupant's ears, and there is no “typical” ear height. Results may vary depending on these heights, and when compared to the same standard criteria, as instructed by the PMP, there is the possibility that one measurement may yield an unsatisfactory result while another may yield a satisfactory one. This phenomenon was not explored.
Type of microphone setup versus resultant accuracy when compared to standard criteria
Four measurement setups for microphones are mentioned: a handheld microphone, tripod-mounted microphone, a moving microphone, and a handheld moving microphone. It is unclear how the differences in setup type may affect results. The PMP states some pros and cons of some setups, but all setups, whether accurate or not, are compared to the same standard. Because of this, there is the possibility that one setup could yield an unsatisfactory result while another may yield a satisfactory one. This phenomenon was not explored.
A-2. Conduct acoustic measurements at specific times
Spot measurements only represent one instant in time. It is recommended to repeat spot measurements for acoustics at several specific times during the day or week for both occupied and unoccupied hours.
A-3. Needs definition for “acoustical consultant” or “personnel with training in acoustic testing”
The “Measurement methods” section recommends that intermediate- and advanced-level acoustic testing be done by “an acoustical consultant or personnel with training in acoustic testing.” However, it is not clear who is qualified to be “an acoustical consultant or personnel with training in acoustic testing.” Qualified acoustical consultants may be difficult to find locally, especially in cities in the Midwest states. To hire qualified acoustic consultants, detailed bids need to be carefully reviewed and compared to make sure PMP requirements are fully met in the bid documents.
A-4. Specify or provide standard criteria for all measurement methods suggested
The various standards specified for different types of measurement scenarios yield various result metrics, most of which cannot be clearly compared to each other. For example, measurements in the field yield noise reduction results, which are then converted into noise isolation class ratings; façade measurements yield outdoor-indoor level reduction and outdoor-indoor transmission loss results; ceiling measurements yield ceiling attenuation class results; and other standards yield results of sound transmission class. With all the various result types, it is not clear which ratings or values are considered acceptable and which ones are unacceptable. There are no apparent sources for comparing measurement results to acceptability. Future editions of the PMP should include a scale of each result type, stating at which point on the scale a result becomes acceptable/unacceptable.
Conclusion
At the basic level, most of the performance measurement protocols are reliable, practical, and valid, even though some of the suggested metrics and benchmarking criteria may need clarifications and/or additional information. At the intermediate level, the required measurement protocols are only somewhat reliable and some of them are impractical. The benchmarking criteria for some categories at this level are not clearly defined. At the advanced level, most measurement protocols are complex and need to be performed by qualified or specially trained personnel. The benchmarking criteria are often missing for the required measurements. Because many of the measurement protocols at this level were based on ongoing research, some tools and software used were not widely available within or fully supported by the industry. These factors made protocols at this level very difficult to be implemented by industry practitioners in real buildings; thus, they should be used only in specialized building applications.
Future work is needed to create an updated, more consistent version of the ASHRAE PMP. Many of the challenges in validity, reliability, and practicality should be addressed. More research on building performance evaluation should be conducted. The focus of future work should be on shifting from challenging and impractical intermediate- and advanced-level protocols to methods and resources to those that are more accessible and practical for the typical building managers, energy auditors, and commissioning agents and are more widely accepted within industry. In addition to necessary clarifications in all PMP sections to ensure the ease of understanding for various procedures, the protocol should be accompanied with accessible and practical measurement methods. For example, effort should be made so that both a facility manager for a single small building or a large campus or network of buildings, can understand and implement PMP measurement methods. Outdated resources and software should be replaced with newer, more user-friendly software. For example, a new program for generating inverse models should be developed to replace the current IMT software.
In addition, research on alternative methods of measurements that are not mentioned in the current PMP should be explored. Many methods mentioned within the current (2010) PMP were innovative but are now outdated or not widely used in industry. There are also additional widely accepted metrics for some of the categories that should be explored for possible inclusion in future editions of the PMP. There are also alternative methods for evaluating performance and acceptability of various acoustic parameters that should also be further explored.
Acknowledgments
This research was supported by ASHRAE through ASHRAE Research Project 1702. The authors would like to thank ASHRAE for financial support. The authors appreciate the Project Monitoring Subcommittee for their advice on this research project. The project also received support from the Iowa Department of Administrative Services facilities management team, Iowa Utilities Board, Iowa Office of Consumer Advocates, Facilities and Ground Operations at the University of Alabama, and Physical Plant (special thanks to Mr. Forrest Selmer, Mr. Steven Fletcher, and Mr. Jerome Lindsey) at the University of Wyoming.
References
- ASHRAE. 2010. Performance Measurement Protocols for Commercial Buildings. Atlanta: ASHRAE.
- ASHRAE. 2012. Performance Measurement Protocols for Commercial Buildings: Best Practices Guide. Atlanta: ASHRAE.
- ASHRAE. 2013a. ANSI/ASHRAE Standard 55-2013, Thermal Environmental Conditions for Human Occupancy. Atlanta: ASHRAE.
- ASHRAE. 2013b. ANSI/ASHRAE Standard 62.1-2013, Ventilation for Acceptable Indoor Air Quality. Atlanta: ASHRAE.
- BUS. n.d. Occupant Satisfaction Evaluation. https://www.busmethodology.org.uk/.
- CBE. 2008. Occupant Indoor Environmental Quality (IEQ) Survey. http://www.cbe.berkeley.edu/research/survey.htm.
- CIBSE. 2004. CIBSE Guide G, Public Health and Plumbing Engineering. London: The Chartered Institution of Building Services Engineers.
- FEMP. 2009. Federal Water Use Indices. http://energy.gov/eere/femp/federal-water-use-indices.
- Goins, J. 2011. Case Study of Kresge Foundation Office Complex Troy, Michigan. __________: Center for the Built Environment, University of California.
- Heinzerling, D. 2012. Commercial Building Indoor Environmental Quality Evaluation: Methods and Tools, in Department of Architecture. Berkeley, CA: University of California, Berkeley.
- Kim, H., and J. Haberl. 2012a. Field test of the new ASHRAE/CIBSE/USGBC performance measurement protocols for commercial buildings: Basic level. ASHRAE Winter Meeting, Chicago, IL, January.
- Kim, H., and J. Haberl. 2012b. Field test of the new ASHRAE/CIBSE/USGBC performance measurement protocols for commercial buildings: Intermediate and advanced level indoor environmental quality protocols. ASHRAE Annual Meeting, San Antonio, TX, June.
- Kim, H., and J. Haberl. 2017a. Field-test of the ASHRAE/CIBSE/USGBC performance measurement protocols: Part I intermediate level energy protocols. Science and Technology for the Built Environment 24(3):281–297.
- Kim, H. and J. Haberl. 2017b. Field-test of the ASHRAE/CIBSE/USGBC performance measurement protocols: Part II advanced level energy protocols. Science and Technology for the Built Environment 24(3):298–315.
- Kissock, J., J.S. Haberl, and D.E. Claridge. 2004. RP-1050–Development of a Toolkit for Calculating Linear, Change-Point Linear and Multiple-Linear Inverse Building Energy Analysis Models, 2004. Atlanta: ASHRAE.
- Wang, L., G. McMorrow, X. Zhou, Y. Li, G.H. Krishnan, Z. O'Neill, F. Niu, and Z. Hao. 2018. RP-1702–Assessing the Validity, Reliability, and Practicality of ASHRAE's Performance Measurement Protocol. Atlanta: ASHRAE.
- Zhou, X.,Y. Li, Y. Liu, and G.H. Krishnan. 2018. Performance Measurement Protocol Case Study Building A. Atlanta: ASHRAE.