
 ?Mathematical formulae have been encoded as MathML and are displayed in this HTML version using MathJax in order to improve their display. Uncheck the box to turn MathJax off. This feature requires Javascript. Click on a formula to zoom.
Abstract
In 2021, COVID-19 has been widely spread worldwide. Few studies focused on infection risk in the different confined spaces on university campuses. However, obtaining the quanta value of SARS-CoV-2 using the conventional method is not identical. Therefore, in our study, the estimation method of the quanta value was improved via statistically analyzing the viral load of the infectors and fitting the droplet number concentration of different particle sizes. Moreover, the infection risk and efficacy of typical engineering control measures in confined spaces such as dormitories, classrooms, gyms, libraries, and refectories were evaluated using the improved Wells-Riley equation. The results demonstrated that: (1) the quanta value range of SARS-CoV-2 was 20.49 ∼ 454.87 quanta/h, which was confirmed by the existing literature; (2) the infection risk in dormitories and classrooms was 100% (exposure time was eight hours) and 5% (exposure time was 1.5 h), respectively, while basic reproduction numbers were both 2.8; (3) The combined control measures mainly based on engineering measures such as ventilation, high efficiency particle air (HEPA) filter, ultraviolet germicidal irradiation (UVGI), partially based on surgical masks were recommended. The findings could provide suggestions for universities to scientifically formulate intervention measures and self-protection means for students.
Highlight
The estimation method of the quanta generation rate was improved.
Statistically analyzed the distribution of viral load based on published data.
The droplet number of different particle sizes was determined.
The quanta generation rate was found to be substantially influenced by the respiratory intensity and activity level.
Infection risks in the dormitories and classrooms were the highest.
Introduction
By June 2021, the COVID-19 pandemic has caused 1.7 hundred million infections and more than 3.5 million deaths (Jin et al. Citation2020; JHU Citation2021). In response to the outbreak, over 133 US colleges and universities closed the campus temporarily and bore a burden to implement a reopen plan (CDC 2021a). Particularly, university students seem to be uncontrollable due to the free activity. In 2019, the number of Chinese university students exceeded 30 million (NBS Citation2019). The Chinese government has issued the Technical Plan for the Prevention and Control of COVID-19 Epidemics in Colleges and Universities in Autumn and Winter. The students have returned to their campuses in the 2020–2021 academic year (MOE Citation2020). How should they protect themselves after returning to school? Which confined space has the greater infection risk? These questions must be answered to prevent the SARS-CoV-2 from spreading among colleges and universities.
A university campus can be regarded as a small community, including functional buildings, such as libraries, classrooms, dining halls, dormitories, gyms, and offices (Xu, Gang, and Peng Citation2006). The lifestyles, social activities, and contact behavior of university students are significantly different from those of K-12 school students. Undergraduates may spend more time in dormitories and classrooms, while postgraduates are primarily in laboratories, offices, or dormitories. Moreover, the activity level and respiratory intensity in different functional buildings are inconsistent, which causes differences in SARS-CoV-2 transmission. Consequently, it is necessary to research the infection risk of different confined spaces on university campuses separately.
Knowing the SARS-CoV-2 transmission route is the basis for studying infection risks and formulating epidemic prevention measures. The WHO identified four modes existed: contact and droplet transmission, airborne transmission, and fomite transmission (WHO Citation2020a, Citation2020b). The American Society of Heating, Refrigerating and Air-Conditioning Engineers (ASHRAE) and the Federation of European Heating and Air-Conditioning Associations (REHVA) respectively emphasized the possibility of long-range transmission and fecal aerosol transmission (Schoen Citation2020; REHVA 2020). The COVID-19 Diagnosis and Treatment Plan (Trial Eighth Edition) issued by the Chinese National Health Commission figured out that droplets and contact transmission were the major transmission route (NHC. Citation2020). Currently, the epidemic prevention measures of Chinese universities contain access control, social distancing, temperature testing. However, those measures do not distinguish between the different confined spaces. Moreover, some universities no longer maintain closed-off management attributable to normalized epidemic prevention. Therefore, exploring the transmission risk based on different physical buildings is crucial.
The Wells-Riley equation is most commonly used for assessing the infection risk of respiratory diseases (To and Chao Citation2010). Wells proposed the quanta concept in 1955 (Wells Citation1955), and (Riley, Murphy, and Riley Citation1978) improved this concept to form the Wells-Riley equation. So far, applications of the Wells-Riley equation in confined spaces, such as medical buildings (Furuya Citation2013), schools (Gao et al. Citation2012), prisons (Mushayabasa Citation2013), and public transport (Yan et al. Citation2017), have been reported. Regarding the infection risk of respiratory disease in schools, (Riley, Murphy, and Riley Citation1978) first adopted the Wells-Riley equation to research a measles outbreak in a US suburban elementary school. (Taylor et al. Citation2016) predicted an annual tuberculosis infection rate of 18.58% in a South African rural school. (Hella et al. Citation2017) discovered that the annual tuberculosis transmission risk in a 50-person class of a Tanzanian school was 4.02% at an average CO2 concentration of 655 ppm. (Gao et al. Citation2012) conducted statistical analysis of schools at different levels in Hong Kong and explored the impact of different infection prevention precautions, including ventilation, on reducing influenza infectors. Moreover, systematic studies of respiratory disease control strategies that integrated schools as a community or part of the city have been proposed (Gao, Wei, Cowling, et al. Citation2016; Gao, Wei, Lei, et al. Citation2016; Zhang et al. Citation2018). Research on campus respiratory disease aimed at primary and secondary schools and university campuses still needs more attention.
At the other end of the spectrum, the infection risk is closely related to the indoor air environment of university campus buildings. (Shen et al. Citation2021) proposed a systematic approach to evaluating the effectiveness of IAQ strategies for reducing the SARS-CoV-2 airborne infection risk. (Liu, Liu, and Liu 2020) surveyed the physical symptoms of 399 students in Sichuan Province through the questionnaire. The results showed that the physical discomfort incidence was 34.85% (mild 26.26%; moderate 8.59%). (Zhao et al. 2020) employed the improved SEIR model to simulate the COVID-19 epidemiology in a US university with 38000 participants, which provided advice on reopening the campus. Various studies explored the relationship between the indoor environmental improvement measures and the infection risk reduction, and the results showed that enhanced ventilation played an essential role in the reduction of influenza and tuberculosis (Nardell et al. Citation1991; Fennelly and Nardell Citation1998; Escombe et al. Citation2007; Li et al. Citation2007). Although ASHRAE and REHVA guidelines recommend the integration of UVGI of the ventilation system to inactivate SARS-COV-2, and multiple studies have also underlined the contributions of ventilation to fight SARS-COV-2 in different scenarios (Zhang Citation2020; Dai and Zhao Citation2020; Rothamer et al. Citation2021; Blocken et al. Citation2021; Stabile et al. Citation2021; Buonanno, Stabile, et al. Citation2020), how indoor environment improvement helps reduce the transmission risk of SARS-COV-2 should be clarified furthermore.
The scope of this paper is to evaluate the infection risk of SARS-CoV-2 transmission in different university confined spaces. Five confined spaces and specific exposure scenarios of a dormitory, classroom, library, gymnasium, and dining hall were considered. The viral load distribution and droplet concentration fitted curve were obtained based on the peer-reviewed literature. The quanta generation rates were estimated using the forward calculation method according to viral load conservation. The infection risk was quantified using the improved Wells-Riley equation. The efficacy of infection prevention precautions in different exposure scenarios was discussed. The results could provide suggestions for the students’ self-protection and in formulating intervention measures for universities.
Methodology
Prospective objects
Confined spaces
We selected a university campus in China for the research. Considering the daily routines, the learning needs, and the breathing intensity of students, we constructed five specific exposure scenarios: the dormitory, classroom, library, gym, and dining hall. Complex buildings such as teaching buildings, libraries, and gyms usually install central - air conditioning systems, and rooms of different sizes can independently regulate the air supply volume (Xu, Gang, and Peng Citation2006; Li and Luo Citation2011; Liu Hua and De Ying Citation2017). Therefore, we simply studied the common confined spaces of different buildings. Among them, a medium-sized classroom in the teaching building with a volume of 296 m3 and a large space study room in the library with a height of 16 m was selected, respectively. For the gym, the competition hall (MOHURD and GASC Citation2003) with a floor height of 19.5 m was considered. The air change rates referred to Design Code for Heating Ventilation and Air Conditioning of Civil Buildings (GB50736-2012) (MOHURD Citation2012). In particular, the dormitory utilized natural ventilation with an air change rate of 0.5 ACH, while other scenarios all adopted mechanical ventilation. At present, almost all Chinese universities strictly adopt control measures such as temperature testing and social distancing. Hence, the number of infectors in each scenario was 1. Moreover, we assumed that a student who was playing basketball was the infector in the gym. The detailed design parameters were shown in .
Table 1. Descriptions of the confined spaces.
Exposed scenarios
The transmission of respiratory diseases starts with self-respiratory activity, and the respiratory intensity may cause substantial differences in the disease infectiousness from the source. Since determining the activity level and breathing intensity in different confined spaces is impossible, we designed and classified the exposure scenarios in a statistical sense, as shown in . We considered the infector activities in the dormitory, classroom, gym library was talking and sleeping, studying and talking, playing basketball, studying and whispering, respectively. The breathing rate was estimated based on the preset activity type (Adams Citation1993; Buonanno, Stabile, et al. Citation2020). While the flow and individual behavior of susceptible people in the dining hall were highly random. The stay time of susceptible people was significantly lower than that of other scenarios. We assumed that “no talking” was strictly implemented, so the pulmonary rate was 1.38 m3/h. The susceptible number was equal to the designed seat number.
Table 2. Detailed information of the exposure scenarios.
Estimation of quanta generation rate
Estimation method and steps
We employed the Wells-Riley equation for quantifying the infection risk of the exposure scenarios. However, a significant problem with applications of the Wells-Riley equation is the selection of the quanta value, which was the only statistically based parameter that implied virus infectivity (To and Chao Citation2010). summarizes the quanta values of common respiratory viruses other than SARS-CoV-2. In , LN presents the lognormal distribution. Scholars usually conducted backward calculations from an outbreak case or directly estimated it based on the previous studies to obtain the appropriate quanta value. Theoretically, except for the calculation parameters in the Wells-Riley equation, the quanta value depends on many reasons. No uniform determining standard has been acknowledged. The COVID-19 pandemic was still raging. (Dai and Zhao Citation2020) studied the quanta value by fitting the values of MERS, influenza TB, SARS. The results did not distinguish different exposure scenarios. Based on the assumption that the viral load was conserved, (Buonanno, Stabile, et al. Citation2020; Buonanno, Morawska, et al. Citation2020) forward calculated the estimated quanta generation rate under different activity levels.
Table 3. The quanta values of common airborne pathogen.
According to the viral load in exhaled droplets of different sizes, we adopted an estimation method to calculate the quanta generation rate. The expression is shown in EquationEquation (1)(1)
(1) (Chen et al. Citation2020).
(1)
(1)
where:
is the estimated quanta generation rate, quanta/h;
is the viral load, RNA copies/mL;
is the conversion factor, and we consider the worst case and set this value to 0.1 (Buonanno, Stabile, et al. Citation2020);
is the pulmonary ventilation rate, as summarized in , m3/h;
is the volume of the total droplets, m3.
In EquationEquation (1)(1)
(1) , Only
and
were unknown. Hence, the following steps were made:
We statistically analyzed the distribution of viral load based on the published peer-reviewed literature.
We fitted the particle size distribution of respiratory particles in different scenarios.
We calculated the quanta generation rate using the Monte-Carlo method. Detailed information of
and
Viral load
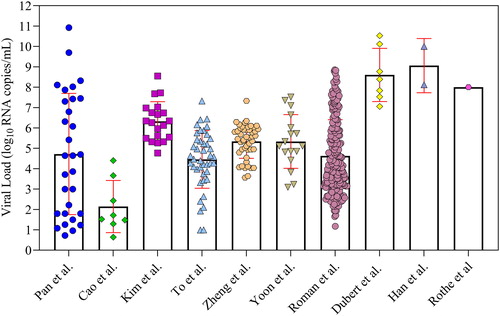
How to ascertain the viral load in the exhaled droplets was an unresolved problem. Theoretically, viruses that entered the upper respiratory tract may be released into the air during respiratory activities and cause infection. (Walsh et al. Citation2020) investigated the viral load in nearly 50 studies. The results showed that the viral load was almost the same between pre-symptomatic, asymptomatic, and symptomatic subjects, and the viral load of saliva was higher than that of other parts, reaching a peak within a few days after infection. As the infector viral load varied with the time after infection, we counted the viral load of throat swabs and saliva swabs reported by (Zheng et al. Citation2020), (Rothe et al. Citation2020), (To et al. Citation2020), (Kim et al. Citation2020), (Pan et al. Citation2020), (Wölfel et al. Citation2020), (Cao et al. Citation2020), (Yoon et al. Citation2020), (Dubert et al. Citation2020) and (Han et al. Citation2020). The logarithmic results are shown in . There were significant differences in viral load reported in different studies. (Kim et al. Citation2020), (To et al. Citation2020), (Zheng et al. Citation2020), (Yoon et al. Citation2020), and (Wölfel et al. Citation2020) showed a median of RNA copies/mL, (Dubert et al. Citation2020), (Han et al. Citation2020), and (Rothe et al. Citation2020) showed a higher median of
RNA copies/mL, while (Pan et al. Citation2020) and (Cao et al. Citation2020) showed a median of less than
RNA copies/mL. The viral load of different infectors in the same studies was also remarkably different. Considering the viral load distribution in the above literature is a better approach to reflect the true viral load.
Fig. 1. Viral load in different specimens.
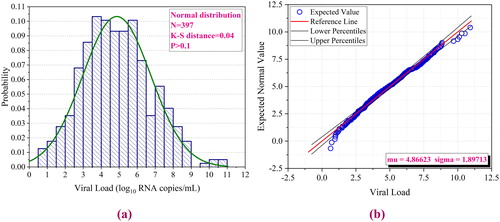
We fitted a total of 397 data points from the above literature using the Monte Carlo method and performed Kolmogorov-Smirnov (KS) goodness of fit testing. As shown in , the results had a normal distribution with a median value of 4.87 and a standard deviation of 1.90. The P-value was greater than 0.1, indicating that the fitting results were reliable.
Fig. 2. Viral load distribution: (a) Histogram and Fitting Curve; (b) Normal Q-Q Plot.
Respiratory particles
According to EquationEquation (1)(1)
(1) , the estimated quanta generation rate was also influenced by the exhaled droplets. It was calculated by EquationEquation (2)
(2)
(2) .
(2)
(2)
where
is the droplet number concentration,
is the volume of a single droplet, as shown in EquationEquation (3)
(3)
(3) .
is the maximum aerodynamic diameter of the exhaled droplet,
with a value of 20.
(3)
(3)
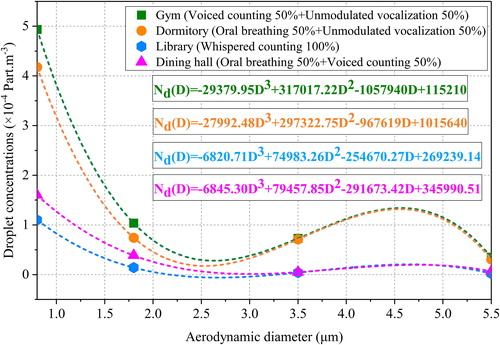
Some scholars have carried out experimental testing and simulation studies with respect to (Duguid Citation1946; Lindsley et al. Citation2012; Lindsley et al. Citation2016; Morawska et al. Citation2009; Chen et al. Citation2020; Mao et al. Citation2020; Alsved et al. Citation2020). The aforementioned literature mainly focused on the number of droplets with different particle sizes during coughing, speaking, and breathing. Furthermore, the experimental results were subject to individual differences and contingencies. Even for the same study, the results varied from person to person. (Morawska et al. Citation2009) experimentally measured the droplets number concentration in different respiratory activities. To reduce the contingency, we assigned different weights to the designed exposure scenarios for fitting, based on the results. For example, students studying quietly in the library, the weight is 100% whispered counting. The droplet number concentration after weight allocation and the curve after fitting are shown in . However, it was still unknown that what kind of fitting type should be employed. Since there were only four test values, we applied cubic polynomial, and
was 1 (Burden, Burden, and Faires Citation2016). The fitting formula is expressed in EquationEquation (4)
(4)
(4) .
(4)
(4)
where
and
are cubic term, quadratic term, primary term, and constant term coefficient, respectively. The fitted results are also shown in .
Fig. 3. Droplet concentrations fitting curve.
Calculating tool and accuracy
To characterize the uncertainty and variability, we employed Monte Carlo simulation to quantify the uncertainty with regard to the quanta generation rate based on the fitted viral load distribution and droplet number concentration curves. We used K-S statistics to optimize the goodness of fit of the distributions. We adopted Crystal Ball software (Version 2000.2, Decisioneering, Inc., Denver, CO, USA) to analyze the data and estimate the distribution parameters. The number of iterations was 10,000 to ensure the stability of the results.
The transmission model
The Wells-Riley equation
We quantified the infection risk of the five exposure scenarios based on the Wells-Riley equation. However, the Wells-Riley equation fails to reflect the change of quanta concentration over time, resulting in a slightly higher risk result (Beggs et al. Citation2003). Therefore, we further refined it according to the improved equation proposed by (Gammaitoni and Nucci Citation1997), taking into account respiration protection and various engineering measures. The following assumptions were made: (1) The quanta generation rate varied with time; (2) The incubation period of the disease was longer than the time scale of the model; (3) The droplets were distributed uniformly and instantaneously in the room. The number of susceptible individuals and the indoor quanta concentration conformed to differential Equationequations (5)(5)
(5) and Equation(6)
(6)
(6) :
(5)
(5)
(6)
(6)
where
is the number of susceptible individuals, when
is the initial number of susceptible individuals
is the respiratory protective efficiency, %, if no respiratory protection was taken,
is the volume of confined space, m3;
is the quanta concentration of confined space, quanta/m3;
is the infection virus removal rate,
After solving the differential Equationequations (5)(5)
(5) and Equation(6)
(6)
(6) , the change of quanta concentration with time is shown in EquationEquation (7)
(7)
(7) .
(7)
(7)
where
is the initial quanta concentration of the confined space, quanta/m3.
consists of four contributions: ventilation, particle deposition, viral inactivity, and engineering control measures such as UVGI and HEPA. Consequently,
is given by EquationEquation (8)
(8)
(8) .
(8)
(8)
where
is the air exchange rate via ventilation,
is the rate coefficient of viral activity,
with a value of 0.64 (van Doremalen et al. Citation2020);
is the particle deposition rate,
with a value of 0.24 (Chatoutsidou and Lazaridis 2019);
is the rate coefficient of inactivation by ultraviolet irradiation,
is the equivalent virus removal rate of the filter,
is the filtration efficiency, %.
If the infector leaves the confined space, and
is expressed as EquationEquation (9)
(9)
(9) .
(9)
(9)
The integral of quanta concentration over time was substituted into the Wells-Riley equation to obtain the infection risk of a susceptible individual from time to time
as shown in EquationEquation (10)
(10)
(10) .
(10)
(10)
where:
is the infection risk of a susceptible individual.
Assuming that the infector stays in the confined space from time to
and
is given by EquationEquation (11)
(11)
(11) .
(11)
(11)
The calculation formula of can be obtained by substituting EquationEquation (11)
(11)
(11) into EquationEquation (10)
(10)
(10) , leading to EquationEquation (12)
(12)
(12) .
(12)
(12)
Basic reproduction number
The value can only embody the individual risk of infection. From an epidemiological and public risk prevention perspective, the basic reproduction number
should also be studied.
is a vitally important quantity when exploring the spreading of a respiratory disease, which represents the number of new cases generated directly by one infector with a specific pandemic (Al-Raeei Citation2021). Currently, the
can be derived directly from a mathematical model (Zhao et al. 2020) or be estimated by building a transmission model through retrospective data (Wu, Leung, and Leung Citation2020). In this paper, the
was prospective rather than retrospective. The former method was adopted (Beggs et al. Citation2003; Buonanno, Stabile, et al. Citation2020; Buonanno, Morawska, et al. Citation2020), as EquationEquation (13)
(13)
(13) shows.
(13)
(13)
where
is the basic reproduction number.
Results
Estimated quanta generation rate
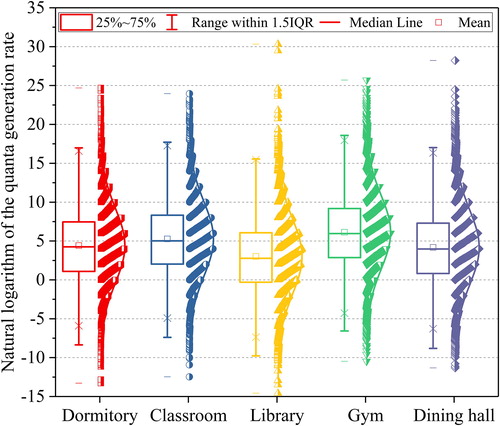
The estimated quanta generation rate of all the exposure scenarios followed a lognormal distribution. illustrates the natural logarithmic results and distribution curves. The infector (athlete) in the gym had a high activity level and respiratory intensity. Therefore, the quanta generation of the gym was the highest, with a median value of 454.87 quanta/h. The median value of the classroom was 194.4 (
) quanta/h. Although it was assumed that the droplet number concentration exhaled by the infector in the dormitory and classroom was the same, the inhalation rate of the infector in the classroom was higher. Therefore, the median value of the dormitory was only 83.10 (
) quanta/h. The inhalation rate and droplet concentration in the library and dining hall were lower than those in the gym, and the median values were 20.49 (
) quanta/h and 65.37 (
) quanta/h, respectively.
Fig. 4. Natural logarithm of the quanta generation rate under exposure scenarios.
Infection risk of the exposure scenarios
Quanta concentration andinfection risk
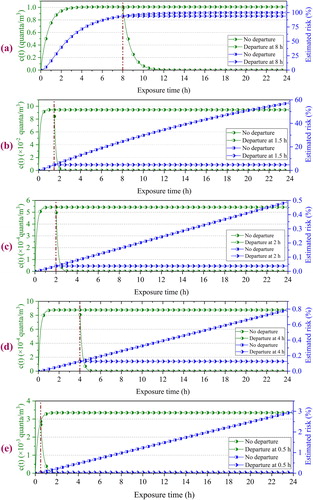
presents the quanta concentration and infection risk variations with exposure time under different exposure scenarios. For comparison, also shows the results for the quanta condition lasting up to 24 h. When the infector left the confined space, the quanta concentration sharply dropped to zero. In the dormitory, it took about two hours for the quanta concentration to decline to zero, while in other scenarios, it was less than one hour. Accordingly, the infection risk was almost no longer increased. The dormitory volume was only 60 m3, and the ventilation rate was only 0.5 ACH. Therefore, the quanta concentration reached a stable peak of 1.0 quanta/m3 after about 3.5 h, and no significant increase was observed. Due to the high ventilation rate, the quanta concentration of the other four scenarios reached a stable peak value within one hour, and they were much smaller than that of the dormitory. The infection risk in the dormitory was also the highest. When a susceptible individual was exposed for four hours and eight hours, the infection risk was about 75% and 100%, respectively. The classroom was of a middle size (296 m3) but with a high ventilation rate (6.08 ACH), so the infection risk was about 5.0% at the end of a class period (1.5 h). The infection risk was less than 0.4% when the student watched a match in the gym for two hours. In the library, the risk still did not exceed 0.15%. Even after 30 minutes of exposure in the dining hall, the risk was only 0.3%. The dominant reasons were that the gym, library, and dining hall had larger volumes and higher ventilation rates. Consequently, the infection risk of the dormitory and the classroom was the highest.
Fig. 5. The variations of and
(a) Dormitory; (b) Classroom; (c) Gym; (d) Library; (e) Dining hall.
Basic reproduction number
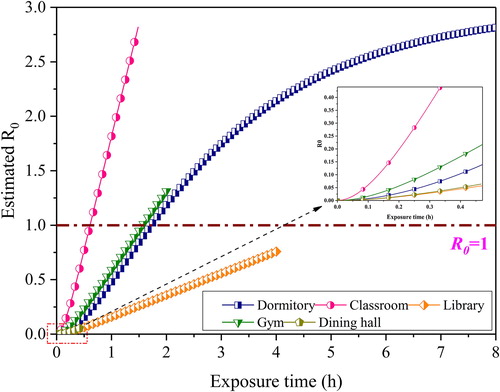
shows the variations of with exposure time under different scenarios. Due to many spectators, although the individual infection risk in the gym was low,
still increased rapidly and reached 1.3 after two hours. Although four roommates were always in the dormitory and the people mobility characteristic was not considered, the infection risk in the dormitory was much higher than that of the other confined spaces. Thus, the
was as high as 2.8 if the exposure time reached eight hours. As for the classroom, the increased rate of
was the highest in all confined spaces. After 1.5 h exposure,
was 2.8. Due to the low quanta generation rate and high ventilation rate in the dining hall and library, the
after designed exposure time was 0.06 and 0.76, respectively. The above analysis demonstrated that the transmission rate of different confined spaces had apparent differences. If the
value could be controlled below a particular threshold value, it means the infected population will decrease gradually. Moreover, most retrospective studies set 1 as the threshold value (Buonanno, Morawska, et al. Citation2020). Only the dormitory and classroom were below one during the designed exposure time.
Fig. 6. Estimated with exposure time for the exposure scenarios.
Impact of engineering control measures
Enhance ventilation
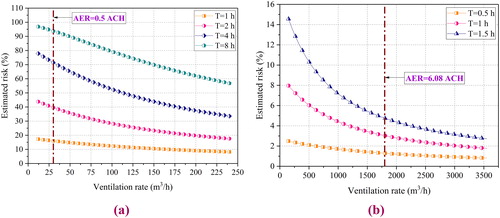
The nature of the Wells-Riley equation reveals that the infection risk decreases with the ventilation rate. However, enhanced ventilation may also cause more energy consumption. Although the risk control cost and energy consumption were not the focus of our study, clarifying the relationship between infection risk and ventilation rate is still exceptionally significant for preventing SARS-CoV-2 transmission. In Section “Infection risk of the exposure scenarios”, we pointed out that the dormitory and classroom were the critical places for risk control on university campuses. illustrates the changes in the dormitory and classroom infection risk with the ventilation rate at different exposure times. Concerning the dormitory, when the exposure time was one hour, the effect of enhanced ventilation was not noticeable. Even if the ventilation rate increased from 30 m3/h to 240 m3/h (AER increased from 0.5 ACH to 4 ACH), the infection risk was reduced by less than 10%. The shorter the exposure, the lower the risk. When the exposure time increased to eight hours, the difference could reach 40%. Furthermore, when the exposure time exceeded four hours, the infection risk tended to decrease linearly. As the exposure time increased for the classroom, a slight increase in the ventilation rate was more effective in reducing the infection risk. For example, if the ventilation rate increased from 150 m3/h to 1000 m3/h (T = 1.5 h), the risk reduction value was 7%. Although enhanced ventilation can reduce the risks, there were significant differences in the effects for different confined spaces.
Fig. 7. The variations of estimated infection risk with ventilation rate: (a) Dormitory; (b) Classroom.
Susceptible flow control
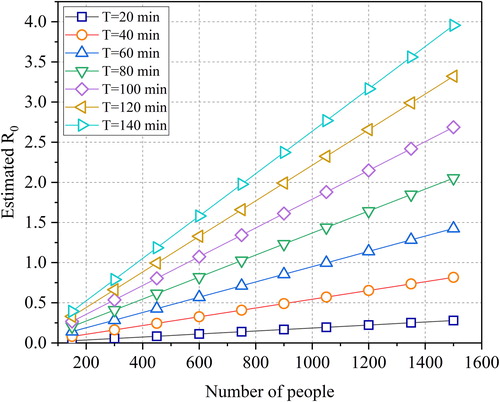
As we mentioned before, the dining hall is a unique confined space with a high crow flow rate. In this section, we explored the relationship between reducing the transmission risk and the susceptible number. shows the variation of the with the susceptible number and the stay time (exposure time). Similarly, the nature of the Wells-Riley equation determines that the
will increase with the susceptible number and the stay time. If taking one as the threshold value, even if the number of people always present was expanded to 1500,
was only 0.28 (T = 20 minutes). If the stay time reached 60 minutes, the susceptible numbers should be controlled at 1050, with
precisely equal to 1. If the stay time was allowed to be two hours, the susceptible number should be controlled to 450 to ensure
Fig. 8. with the different susceptible number and stay time.
Combined engineering measures
In addition to general ventilation (GV), frequently used engineering control measures consist of respiratory protection, ultraviolet germicidal irradiation, and high efficiency particle air (Zhang Citation2020; Feng, Wei, et al. Citation2021). In this section, the efficacy of specific combined engineering measures is discussed. shows the calculation parameters of the surgical mask (M), UVGI, and HEPA. In , LN presents the lognormal distribution. In some university courses, students cannot wear any masks. Therefore, the following six combined measures were analyzed: (1) GV + M; (2) GV + M + UVGI; (3) GV + UVGI; (4) GV + HEPA; (5) GV + M + HEPA; (6) GV + M + UVGI + HEPA.
Table 4. Parameters of the control measures used in the infection risk model.
reveals the variations of and
with exposure time for different combined measures. For comparison, the GV or NV (only dormitory) was also given.
Fig. 9. The variations of estimated and
under combined engineering measures: (a) Dormitory;(b) Classroom; (c) Gym; (d) Library; (e) Dining hall.
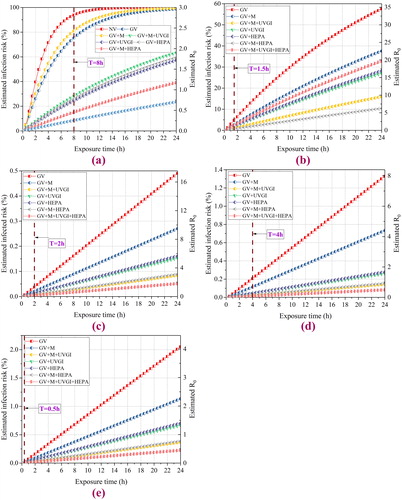
The efficacy was not evident in the dormitory when adopting GV or GV + M due to the air change rate being only two However, if the UVGI or HEPA were used, the infection risk would significantly decrease by 65%. For all scenarios except for the dormitory, the order of average risk was almost the same: GV
GV + M
GV + M + GVUI
GV + HEPA
GV + UVGI
GV + M+HEPA
GV + M+UVGI + HEPA. Nevertheless, there were slight differences. The infection risk of GV + M and GV + UVGI was 35% and 28%, respectively (T = 24 h) for the classroom. While in the gym, library, and dining hall, the other measures were substantially better than the GV or GV + M. Furthermore, the efficacy of the GV + M+UVGI + HEPA was very close to the GV + M+HEPA, especially for the dining hall. The main reason was that the initial infection risk was low. Moreover, the
value should not be ignored. For classrooms and gym, it could reach 30 and 17 respectively. To sum up, only in the infection risk reduction perspective, the combined measures were effective.
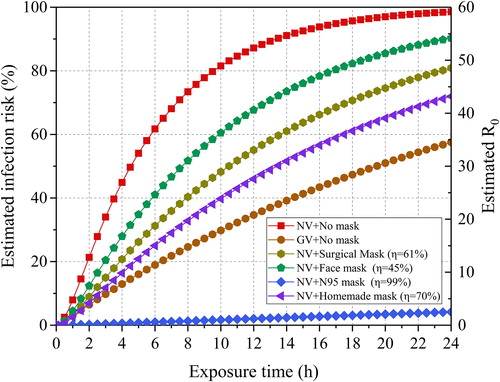
It is necessary to illustrate further the efficacy of wearing a surgical mask on infection risk reduction. presents the variations of estimated and
under typical masks with different respiratory efficiencies in the classroom. For comparison, the circumstance of the only NV with an air change rate of 0.5
was also given. Compared with NV, the infection risk was significantly reduced by 55% when only adopting GV (T = 8h). When the exposure time was below 1.5 h, the infection risk increased approximately linearly. Meanwhile, with every 10% decrease in respiratory protection efficiency, the reduction in infection risk was approximately unchanged. If the N95 mask was adopted, the infection risk was low. Even if the exposure time was 24 h, the infection risk was below 5%. The nature of the Wells-Riley equation determines that the infection risk decreased with the respiratory protection efficiency.
Fig. 10. The variations of estimated and
under some typical masks in the classroom.
Discussion
The comparison of the quanta values
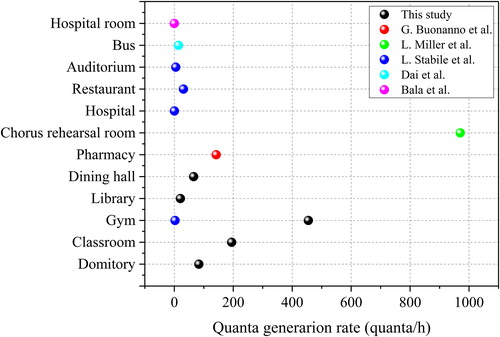
The estimation of quanta generation is vitally important to accurately predict the infection risk of SARS-CoV-2 in different confined spaces. Although the world was still in a pandemic, scholars studied the quanta value of SRAS-CoV-2. demonstrates the comparison between the predicted quanta numbers in previous studies and the results of our study. (Miller et al. Citation2020) calculated quanta values as high as 970 quanta/h for an outbreak case in the United States using the conventional backward calculation method. However, (Hota et al. Citation2020) employed the same method to calculate the quanta value for an outbreak among nurses in a hospital, resulting in only 0.025 quanta/h. Further, (Buonanno, Stabile, et al. Citation2020; Buonanno, Morawska, et al. Citation2020) proposed a forward calculation method to estimate the quanta value of confined spaces such as pharmacies, hospitals, restaurants, and gyms. The results ranged from 1 to 150 quanta/h. On this basis, the actual viral load distribution and the fitted droplets number concentration were both considered in our paper, with results ranging from 20.49 to 454.87 quanta/h. As mentioned in Section “Estimation method and steps”, (Dai and Zhao Citation2020) obtained quanta values in a range of 16 ∼ 48 quanta/h. However, more data on virus characteristics are still needed to research the quanta values further.
Fig. 11. Comparison of quanta generation rate in different scenarios.
The role of the controlling measures
We analyzed the transmission risk of different confined spaces on the university campus from the individual infection risk and public disease prevention perspectives. The infection risk and should be evaluated comprehensively instead of separately. The calculated results showed that for scenarios with small volumes such as dormitory,
was low, but the infection risk was high. As for scenarios with large volumes, the results were the opposite. Usually, as an essential parameter to assessing the epidemic,
was meaningful when the population density was as high as possible (Kermack and McKendrick Citation1927). If
was controlled below a specific threshold value, it meant the epidemic was effectively controlled. We adopted one as the threshold value as most of the studies did. However, if the susceptible number was low, this value may be inappropriate. Only a few studies focused on the
applications for confined spaces from a perspective viewpoint. There are still many problems that need to be solved. Therefore, although the infection risk of both the dormitory and the classroom was highest, all scenarios should be critical places for epidemic prevention and control.
In classrooms and libraries, wearing a mask could effectively prevent SARS-CoV-2 but reduce the learning efficiency and sustained attention. As personal protection equipment, masks are also an essential means of public health intervention, recommended by WHO self-protection guidelines (WHO Citation2020a). The US CDC also suggested wearing masks with low efficiency but N95 masks (CDC 2021b). (Chen et al. Citation2021) studied the efficacy of masks with different efficiencies on public transportation. The results illustrated that wearing homemade masks could reduce the infection risk by 67%. (Wei et al. 2021) discovered that conventional masks with low efficiency have high efficacy. Even if wearing a low-efficiency mask, the susceptible individual also needs to wear it correctly during the exposure time. However, (Feng, Liu, et al. Citation2021) found that only 29.0% of medical students wore masks in enclosed spaces, crowded spaces and, medical establishments. The reasons for not wearing the mask were accessibility (45.6%) and comfort (11.9%). In addition, compliance, violent damage, and improper wearing were also the qualifications. (Liu et al. 2020) discovered that wearing a mask for a long time may increase the discomfort significantly in a warm environment. Therefore, the effectiveness of wearing masks on university campuses needs more research.
The engineering control measures play an essential role in fighting SARS-CoV-2. In hospitals, (Feng, Wei, et al. Citation2021) recommended that UV + Filter and combine ionized electric field and fibrous filter applicated. In classrooms, (Zhang Citation2020) proposed indoor air quality (IAQ) strategies, including source control, ventilation, and air cleaning to reduce the infection risk. (Ding, Yu, and Cao et al. Citation2020) pointed out that the HEPA filter may be effective according to the experimental results conducted by (Park et al. Citation2020). Our calculation results also showed that in all scenarios, the combined engineering control measures were more effective. Moreover, the transmission routes consist of contact transmission, droplet transmission, and airborne transmission (Xu et al. Citation2020). The WHO suggested that droplet transmission is the main route, while some scholars believed that the airborne transmission could not be ignored. We estimated the quanta value based on all the exhaled droplets, which covered part of droplet transmission and airborne transmission (Morawska et al. Citation2020). With regard to transmissions via large droplets ( and contact, the common measures were disinfection and physical distance (Prather et al. Citation2020). The UVGI and the HEPA could also disinfect the surface and move out the virus in the air, respectively. Undoubtfully, adopt a single measure may not be effective. We recommended the control measures mainly based on engineering measures such as ventilation, HEPA UVGI, partially based on surgical masks. However, if we know the equivalent infectious removal rate in our mathematical model, the infection risk could be calculated. Therefore, we did not focus on the type or installation location of the UVGI or HEPA filter. They should be studied furthermore.
The limitations of this study
Due to the lack of SARS-CoV-2 infectivity data, only the worst case was considered. It may cause the result to be worse than the actual value.
Only the infection risk of adopting different measures was analyzed. Issues such as energy consumption, IAQ, noise, initial investment, cost were not involved.
Conclusions
The scope of this paper was to explore the transmission of SARS-CoV-2 in different confined spaces (dormitory, classroom, gym, library, dining hall) on a university campus. Based on previous work, the forward quanta calculation method based on viral load conservation was further refined, and two contributions were considered: one is the viral load distribution based on the cases reported in the literature, the other is to fit the droplets number concentration in consideration of reducing the contingency. Respiratory protection and various engineering control measures were considered and integrated into the improved Wells-Riley equation. The infection risk and the efficacy of the engineering control measure against five exposure scenarios on a university campus were assessed. The findings and recommendations are as follows
The quanta generation rates in the dormitory, classroom, library, gym, and dining hall were 83.10 quanta/h, 194.4 quanta/h, 20.49 quanta/h, 454.87 quanta/h, 20.49 quanta/h, respectively. The quanta generation rate is significantly influenced by the activity level and the respiratory intensity. The forward estimation method based on the conservation of viral load still needs more virus characteristics and epidemic data support.
The infection risk in the dormitory and classroom was obviously higher than in other confined spaces. The infection risk of students staying in the dormitory for more than 8 hours was close to 100%, while it was 5% after finishing a class. The infection risk in other confined spaces after the design exposure time was below 0.5%. The threshold value of
Students should reduce mobility in the dormitory building. Places with high mobility, such as the dining hall, should control the susceptible flow. The susceptible flow should also be controlled in a class, and classes should not be arranged continuously. The transmission risk caused by the random movement of people deserves further study.
On the university campus, engineering measures such as enhanced ventilation, HEPA filter, UVGI should be adopted. Surgical masks could provide additional protection.
| Nomenclature | ||
| = | air exchange rate [h−1] | |
| = | quanta concentration [quanta/m3] | |
| = | conversion factor | |
| = | viral load [RNA copies/mL] | |
| = | Droplet diameter [ | |
| = | maximum droplet diameter [ | |
| = | equivalent virus removal rate of the filter [h-1] | |
| = | Droplet number concentration [part./m3] | |
| = | pulmonary ventilation rate [m3/h] | |
| = | estimated quanta generation rate [quanta/h] | |
| = | virus removal rate [h-1] | |
| = | infection risk [%] | |
| = | basic reproduction number | |
| = | susceptible | |
| = | exposure time [h] | |
| = | total volume of the droplet [m3] | |
| = | volume of confined space [m3] | |
| = | particle size [m3] | |
| = | respiratory protection efficiency [%] | |
| = | rate deposition loss of the infectious particles [h−1] | |
| = | rate coefficient of inactivation by ultraviolet irradiation [h-1] | |
| = | viral inactivation [h-1] | |
| = | filtration efficiency [%] | |
Third-party material statement
I am not using third-party material for which formal permission is required.
Declarations of interest
The author(s) declared no potential conflicts of interest with respect to the research, authorship, and/or publication of this article.
Additional information
Funding
References
- Adams, W. C. 1993. Measurement of breathing rate and volume in routinely performed daily activities [final report]. Adams, WC.
- Al-Raeei, M. 2021. The basic reproduction number of the new coronavirus pandemic with mortality for India, the Syrian Arab Republic, the United States, Yemen, China, France, Nigeria and Russia with different rate of cases. Clinical Epidemiology and Global Health 9:147–9. doi:https://doi.org/10.1016/j.cegh.2020.08.005
- Alsved, M., A. Matamis, R. Bohlin, M. Richter, P. E. Bengtsson, C. J. Fraenkel, P. Medstrand, and J. Löndahl. 2020. Exhaled respiratory particles during singing and talking. Aerosol Science and Technology 54 (11):1245–8. doi:https://doi.org/10.1080/02786826.2020.1812502
- Andrade, A., F. Dominski, M. Pereira, C. Liz, and G. Buonanno. 2018. Infection risk in gyms during physical exercise. Environmental Science and Pollution Research International 25 (20):19675–86. doi:https://doi.org/10.1007/s11356-018-1822-8
- Azimi, P., and B. Stephens. 2013. HVAC filtration for controlling infectious airborne disease transmission in indoor environments: Predicting risk reductions and operational costs. Building and Environment 70:150–60. doi:https://doi.org/10.1016/j.buildenv.2013.08.025
- Basu, S., and A. P. Galvani. 2008. The transmission and control of XDR TB in South Africa: An operations research and mathematical modelling approach. Epidemiology and Infection 136 (12):1585–98. doi:https://doi.org/10.1017/S0950268808000964
- Beggs, C. B., C. J. Noakes, P. A. Sleigh, L. A. Fletcher, and K. Siddiqi. 2003. The transmission of tuberculosis in confined spaces: An analytical review of alternative epidemiological models. The International Journal of Tuberculosis and Lung Disease: The Official Journal of the International Union against Tuberculosis and Lung Disease 7 (11):1015–26.
- Blocken, B., T. van Druenen, A. Ricci, L. Kang, T. van Hooff, P. Qin, L. Xia, C. A. Ruiz, J. H. Arts, J. F. L. Diepens, et al. 2021. Ventilation and air cleaning to limit aerosol particle concentrations in a gym during the COVID-19 pandemic. Building and Environment 193:107659. doi:https://doi.org/10.1016/j.buildenv.2021.107659
- Buonanno, G., L. Morawska, and L. Stabile. 2020. Quantitative assessment of the risk of airborne transmission of SARS-CoV-2 infection: Prospective and retrospective applications. Environment International 145:106112. doi:https://doi.org/10.1016/j.envint.2020.106112
- Buonanno, G., L. Stabile, and L. Morawska. 2020. Estimation of airborne viral emission: Quanta emission rate of SARS-CoV-2 for infection risk assessment. Environment International 141:105794. doi:https://doi.org/10.1016/j.envint.2020.105794
- Burden, A., R. Burden, and J. Faires. 2016. Numerical Analysis, 10th ed. Brooks/Cole.
- Cao, B., Y. Wang, D. Wen, W. Liu, J. Wang, G. Fan, L. Ruan, B. Song, Y. Cai, M. Wei, et al. 2020. A trial of Lopinavir-Ritonavir in adults hospitalized with severe Covid-19. The New England Journal of Medicine 382 (19):1787–99. doi:https://doi.org/10.1056/NEJMoa2001282
- Catanzaro, A. 1982. Nosocomial tuberculosis. The American Review of Respiratory Disease 125 (5):559–62. doi:https://doi.org/10.1164/arrd.1982.125.5.559
- CDC. 2003. Guidelines for environmental infection control in health-care facilities: Recommendations of CDC and the Healthcare Infection Control Practices Advisory Committee (HICPAC). https://www.cdc.gov/infectioncontrol/guidelines/environmental/index.html.
- CDC. 2021a. Considerations for institutions of higher education. https://www.cdc.gov/coronavirus/2019-ncov/community/colleges-universities/considerations.html.
- CDC. 2021b. Guidance for wearing masks. https://www.cdc.gov/coronavirus/2019-ncov/prevent-getting-sick/cloth-face-cover-guidance.html.
- Chatoutsidou, S, & Mihalis, L. 2019. Assessment of the impact of particulate dry deposition on soiling of indoor cultural heritage objects found in churches and museums/libraries. Journal of Cultural Heritage 39:221–8. doi:https://doi.org/10.1016/j.culher.2019.02.017.
- Chen, L., G. Ban, E. Long, G. Kalonji, Z. Cheng, L. Zhang, and S. Guo. 2021. Estimation of the SARS-CoV-2 transmission probability in confined traffic space and evaluation of the mitigation strategies. Environmental Science and Pollution Research 176. doi:https://doi.org/10.1007/s11356-021-13617-y
- Chen, W., N. Zhang, J. Wei, H.-L. Yen, and Y. Li. 2020. Short-range airborne route dominates exposure of respiratory infection during close contact. Building and Environment 176:106859. doi:https://doi.org/10.1016/j.buildenv.2020.106859
- Cooper-Arnold, K., T. Morse, C. Pettigrew, M. Hodgson, R. Wallace, J. Clive, and J. Gasecki. 1999. Occupational tuberculosis among deputy sheriffs in Connecticut: A risk model of transmission. Applied Occupational and Environmental Hygiene 14 (11):768–76. doi:https://doi.org/10.1080/104732299302198
- Dai, H., and B. Zhao. 2020. Association of the infection probability of COVID-19 with ventilation rates in confined spaces. Building Simulation 13 (6):1321–7. doi:https://doi.org/10.1007/s12273-020-0703-5
- Davies, A., K.-A. Thompson, K. Giri, G. Kafatos, J. Walker, and A. Bennett. 2013. Testing the efficacy of homemade masks: Would they protect in an influenza pandemic? Disaster Medicine and Public Health Preparedness 7 (4):413–8. doi:https://doi.org/10.1017/dmp.2013.43
- Ding, J., C. W. Yu, and S.-J. Cao. 2020. HVAC systems for environmental control to minimize the COVID-19 infection. Indoor and Built Environment 29 (9):1195–201. doi:https://doi.org/10.1177/1420326X20951968
- Dubert, M., B. Visseaux, V. Isernia, L. Bouadma, L. Deconinck, J. Patrier, P.-H. Wicky, D. Le Pluart, L. Kramer, C. Rioux, et al. 2020. Case report study of the first five COVID-19 patients treated with remdesivir in France. International Journal of Infectious Diseases : IJID: Official Publication of the International Society for Infectious Diseases 98:290–3. doi:https://doi.org/10.1016/j.ijid.2020.06.093
- Duguid, P. J. 1946. The size and the duration of air-carriage of respiratory droplets and droplet-nuclei. The Journal of Hygiene 44 (6):471–9. doi:https://doi.org/10.1017/S0022172400019288
- Escombe, A. R., C. C. Oeser, R. H. Gilman, M. Navincopa, E. Ticona, W. Pan, C. Martínez, J. Chacaltana, R. Rodríguez, D. A. J. Moore, et al. 2007. Natural ventilation for the prevention of airborne contagion. PLoS Medicine 4 (2):e68. doi:https://doi.org/10.1371/journal.pmed.0040068
- Feng, X., K. Liu, J. Tang, M. Zhang, X. Huang, X. Shi, H. Zhang, S. Yang, and Y. Ren. 2021. Investigation on the use of masks among medical college students in the early stage of COVID-19 epidemic. Journal of Modern Clinical Medicine 47 (1):38–41. +5. doi:https://doi.org/10.11851/j.issn.1673-1557.2021.01.014
- Feng, Z., F. Wei, H. Li, and C. W. Yu. 2021. Evaluation of indoor disinfection technologies for airborne disease control in hospital. Indoor and Built Environment. 30 (6), 727–31. doi:https://doi.org/10.1177/1420326X211002948
- Fennelly, K., and E. Nardell. 1998. The relative efficacy of respirators and room ventilation in preventing occupational tuberculosis. Infection Control and Hospital Epidemiology 19 (10):754–9. doi:https://doi.org/10.2307/30141420
- Furuya, H. 2013. Estimation of environmental control measures for tuberculosis transmission in care facilities for the elderly. The Tokai Journal of Experimental and Clinical Medicine 38 (4):135–41.
- Furuya, H., M. Nagamine, and T. Watanabe. 2009. Use of a mathematical model to estimate tuberculosis transmission risk in an Internet café. Environmental Health and Preventive Medicine 14 (2):96–102. doi:https://doi.org/10.1007/s12199-008-0062-9
- Gammaitoni, L., and M. C. Nucci. 1997. Using a mathematical model to evaluate the efficacy of TB control measures. Emerging Infectious Diseases 3 (3):335–42. doi:https://doi.org/10.3201/eid0303.970310
- Gao, X., Y. Li, and G. M. Leung. 2009. Ventilation control of indoor transmission of airborne diseases in an urban community. Indoor and Built Environment 18 (3):205–18. doi:https://doi.org/10.1177/1420326X09104141
- Gao, X., Y. Li, P. Xu, and B. J. Cowling. 2012. Evaluation of intervention strategies in schools including ventilation for influenza transmission control. Building Simulation 5 (1):29–37. doi:https://doi.org/10.1007/s12273-011-0034-7
- Gao, X., J. Wei, B. J. Cowling, and Y. Li. 2016. Potential impact of a ventilation intervention for influenza in the context of a dense indoor contact network in Hong Kong. The Science of the Total Environment 569-570:373–81. doi:https://doi.org/10.1016/j.scitotenv.2016.06.179
- Gao, X., J. Wei, H. Lei, P. Xu, B. J. Cowling, and Y. Li. 2016. Building ventilation as an effective disease intervention strategy in a dense indoor contact network in an ideal city. PLoS ONE 11 (9):e0162481 doi:https://doi.org/10.1371/journal.pone.0162481
- Han, M. S., M.-W. Seong, E. Y. Heo, J. H. Park, N. Kim, S. Shin, S. I. Cho, S. S. Park, and E. H. Choi. 2020. Sequential analysis of viral load in a neonate and her mother infected with SARS-CoV-2. Clinical Infectious Diseases 71 (16):2236–9. doi:https://doi.org/10.1093/cid/ciaa447
- Hella, J., C. Morrow, F. Mhimbira, S. Ginsberg, N. Chitnis, S. Gagneux, B. Mutayoba, R. Wood, and L. Fenner. 2017. Tuberculosis transmission in public locations in Tanzania: A novel approach to studying airborne disease transmission. Journal of Infection 75 (3):191–7. doi:https://doi.org/10.1016/j.jinf.2017.06.009
- Hota, B., B. Stein, M. Lin, A. Tomich, J. Segreti, and R. A. Weinstein. 2020. Estimate of airborne transmission of SARS-CoV-2 using real time tracking of health care workers. medRxiv. doi:https://doi.org/10.1101/2020.07.15.20154567.
- JHU. 2021. COVID-19 Dashboard by the Center for Systems Science and Engineering (CSSE) at Johns Hopkins University. https://www.arcgis.com/apps/opsdashboard/index.html#/bda7594740fd40299423467b48e9ecf6.
- Jin, Z., X. Du, Y. Xu, Y. Deng, M. Liu, Y. Zhao, B. Zhang, X. Li, L. Zhang, C. Peng, et al. 2020. Structure of Mpro from SARS-CoV-2 and discovery of its inhibitors. Nature 582 (7811):289–93. doi:https://doi.org/10.1038/s41586-020-2223-y
- Johnstone-Robertson, S., S. D. Lawn, A. Welte, L.-G. Bekker, and R. Wood. 2011. Tuberculosis in a South African prison-a transmission modelling analysis. South African Medical Journal 101 (11):809. doi:https://doi.org/10.7196/SAMJ.5043
- Kermack, W. O., and A. G. McKendrick. 1927. A contribution to the mathematical theory of epidemics. Proceedings of the Royal Society of London. Series A, Containing Papers of a Mathematical and Physical Character 115 (772):700–21. doi:https://doi.org/10.1098/rspa.1927.0118
- Kim, J. Y., J. H. Ko, Y. Kim, Y. J. Kim, J. M. Kim, Y. S. Chung, H. M. Kim, M. G. Han, S. Y. Kim, and B. S. Chin. 2020. Viral load kinetics of SARS-CoV-2 infection in first two patients in Korea. Journal of Korean Medical Science 35 (7):e86. doi:https://doi.org/10.3346/jkms.2020.35.e86
- Knibbs, L. D., L. Morawska, and S. C. Bell. 2012. The risk of airborne influenza transmission in passenger cars. Epidemiology and Infection 140 (3):474–8. doi:https://doi.org/10.1017/S0950268811000835
- Lee, S. A., S. A. Grinshpun, and T. Reponen. 2008. Respiratory performance offered by N95 respirators and surgical masks: Human subject evaluation with NaCl aerosol representing bacterial and viral particle size range. The Annals of Occupational Hygiene 52 (3):177–85. doi:https://doi.org/10.1093/annhyg/men005
- Liao, C.-M., C.-F. Chang, and H.-M. Liang. 2005. A probabilistic transmission dynamic model to assess indoor airborne infection risks. Risk Analysis: An Official Publication of the Society for Risk Analysis 25 (5):1097–107. doi:https://doi.org/10.1111/j.1539-6924.2005.00663.x
- Liao, C. M., S. C. Chen, and C. F. Chang. 2008. Modelling Respiratory Infection Control Measure Effects. Epidemiology and Infection 136 (3):299–308. doi:https://doi.org/10.1017/S0950268807008631
- Liao, C.-M., Y.-J. Lin, and Y.-H. Cheng. 2013. Modeling the impact of control measures on tuberculosis infection in senior care facilities. Building and Environment 59:66–75. : doi:https://doi.org/10.1016/j.buildenv.2012.08.008
- Li, Y., G. M. Leung, J. W. Tang, X. Yang, C. Y. H. Chao, J. Z. Lin, J. W. Lu, P. V. Nielsen, J. Niu, H. Qian, et al. 2007. Role of ventilation in airborne transmission of infectious agents in the built environment – A multidisciplinary systematic review. Indoor Air 17 (1):2–18. doi:https://doi.org/10.1111/j.1600-0668.2006.00445.x
- Li, Y., and Y. Luo. 2011. Transformation design for ventilation system in a large canteen. Construction& Design for Project. 2011(10): 101–3, 106. doi:https://doi.org/10.3969/j.issn.1007-9467.2011.10.029
- Lindsley, W. G., F. M. Blachere, D. H. Beezhold, R. E. Thewlis, B. Noorbakhsh, S. Othumpangat, W. T. Goldsmith, C. M. McMillen, M. E. Andrew, C. N. Burrell, et al. 2016. Viable influenza A virus in airborne particles expelled during coughs versus exhalations. Influenza and Other Respiratory Viruses 10 (5):404–13. doi:https://doi.org/10.1111/irv.12390
- Lindsley, W. G., T. A. Pearce, J. B. Hudnall, K. A. Davis, S. M. Davis, M. A. Fisher, R. Khakoo, J. E. Palmer, K. E. Clark, I. Celik, et al. 2012. Quantity and size distribution of cough-generated aerosol particles produced by influenza patients during and after illness. Journal of Occupational and Environmental Hygiene 9 (7):443–9. doi:https://doi.org/10.1080/15459624.2012.684582
- Liu Hua, L., I. De Ying. 2017. HVAC design of the gymnasium for a University in Beijing. Building Simulation 45 (05):1–3. doi:https://doi.org/10.3969j.issn.1673-7237.2017.05.001
- Liu, S., Ying, L., & Yong, L. 2020. Somatic symptoms and concern regarding COVID-19 among Chinese college and primary school students: A cross-sectional survey. Psychiatry Research 289:113070. doi:https://doi.org/10.1016/j.psychres.2020.113070.
- Mao, N., C. K. An, L. Y. Guo, M. Wang, L. Guo, S. R. Guo, and E. S. Long. 2020. Transmission risk of infectious droplets in physical spreading process at different times: A review. Building and Environment 185:107307 doi:https://doi.org/10.1016/j.buildenv.2020.107307
- Miller, S. L., W. William, J. L. Nazaroff, A. Jimenez, G. Boerstra, S. J. Buonanno, J. Dancer, L. C. Kurnitski, L. Marr, C. Morawska, et al. 2020. Transmission of SARS-CoV-2 by inhalation of respiratory aerosol in the Skagit Valley Chorale superspreading event. Indoor Air 31 (2): 314–23. doi:https://doi.org/10.1111/ina.12751
- MOE. 2020. Technical plan for prevention and control of new crown pneumonia epidemic in colleges and universities in autumn and winter (updated version). http://www.moe.gov.cn/jyb_xxgk/moe_1777/moe_1779/202008/t20200813_477911.html.
- MOHURD and GASC. 2003. Design Code for Sports Building: JGJ 31-2003. Beijing: China Architecture & Building Press.
- MOHURD. 2012. Design Code for Heating Ventilation and Air Conditioning of Civil Buildings: GB50736-2012. Beijing: China Architecture & Building Press.
- Morawska, L., G. R. Johnson, Z. D. Ristovski, M. Hargreaves, K. Mengersen, S. Corbett, C. Y. H. Chao, Y. Li, and D. Katoshevski. 2009. Size distribution and sites of origin of droplets expelled from the human respiratory tract during expiratory activities. Journal of Aerosol Science 40 (3):256–69. doi:https://doi.org/10.1016/j.jaerosci.2008.11.002
- Morawska, L., J. W. Tang, W. Bahnfleth, P. M. Bluyssen, A. Boerstra, G. Buonanno, J. Cao, S. Dancer, A. Floto, F. Franchimon, et al. 2020. How can airborne transmission of COVID-19 indoors be minimised? Environment International 142:105832 doi:https://doi.org/10.1016/j.envint.2020.105832
- Mushayabasa, S. 2013. Application of Wells–Riley equations on a mathematical model for assessing the transmission of tuberculosis in prison settings. International Journal of Modeling, Simulation, and Scientific Computing 4 (3):1350010. doi:https://doi.org/10.1142/S1793962313500104
- Nardell, E. A., J. Keegan, S. A. Cheney, and S. C. Etkind. 1991. Airborne infection. Theoretical limits of protection achievable by building ventilation. The American Review of Respiratory Disease 144 (2):302–6. doi:https://doi.org/10.1164/ajrccm/144.2.302
- NBS. 2019. China Statistical Yearbook. Beijing: China Statistics Press.
- NHC. 2020. COVID-19 Diagnosis and Treatment Plan (Trial Eighth Edition). http://www.nhc.gov.cn/yzygj/s7653p/202008/0a7bdf12bd4b46e5bd28ca7f9a7f5e5a.shtml.
- Noakes, C. J., and P. A. Sleigh. 2009. Mathematical models for assessing the role of airflow on the risk of airborne infection in hospital wards. Journal of the Royal Society, Interface 6 (Suppl. 6):S791–S800. doi:https://doi.org/10.1098/rsif.2009.0305.focus
- Pan, Y., D. Zhang, P. Yang, L. L. M. Poon, and Q. Wang. 2020. Viral load of SARS-CoV-2 in clinical samples. The Lancet. Infectious Diseases 20 (4):411–2. doi:https://doi.org/10.1016/S1473-3099(20)30113-4
- Pan, Y., D. Zhang, P. Yang, L. L. M. Poon, and Q. Wang. 2020. Viral load of SARS-CoV-2 in clinical samples. The Lancet. Infectious Diseases 20 (4):411–2. doi:https://doi.org/10.1016/S1473-3099(20)30113-4
- Park, S. Y., Y.-M. Kim, S. Yi, S. Lee, B.-J. Na, C. B. Kim, J.-I. Kim, H. S. Kim, Y. B. Kim, Y. Park, et al. 2020. Coronavirus disease outbreak in call center, South Korea. Emerging Infectious Diseases 26 (8):1666–70. doi:https://doi.org/10.3201/eid2608.201274
- Prather, K. A., L. C. Marr, R. T. Schooley, M. A. McDiarmid, M. E. Wilson, and D. K. Milton. 2020. Airborne transmission of SARS-CoV-2. Science (New York, N.Y.) 370 (6514):303–4. doi: 10.1126/science.abf0521%J Science.
- REHVA. 2020. REHVA COVID-19 guidance document. https://www.rehva.eu/fileadmin/user_upload/REHVA_COVID-19_guidance_document_ver2_20200403_1.pdf.
- Riley, E. C., G. Murphy, and R. L. Riley. 1978. Airborne spread of measles in a suburban elementary school. American Journal of Epidemiology 107 (5):421–32. doi:https://doi.org/10.1093/oxfordjournals.aje.a112560
- Rothamer, D. A., S. Sanders, D. Reindl, and T. H. Bertram. 2021. Strategies to minimize SARS-CoV-2 transmission in classroom settings: Combined impacts of ventilation and mask effective filtration efficiency. medRxiv 202012 (31):20249101. doi:https://doi.org/10.1101/2020.12.31.20249101.
- Rothe, C., M. Schunk, P. Sothmann, G. Bretzel, G. Froeschl, C. Wallrauch, T. Zimmer, V. Thiel, C. Janke, W. Guggemos, et al. 2020. Transmission of 2019-nCoV Infection from an Asymptomatic Contact in Germany. The New England Journal of Medicine 382 (10):970–1. doi:https://doi.org/10.1056/NEJMc2001468
- Rudnick, S. N., and D. K. Milton. 2003. Risk of indoor airborne infection transmission estimated from carbon dioxide concentration. Indoor Air 13 (3):237–45. doi:https://doi.org/10.1034/j.1600-0668.2003.00189.x
- Saab, S. 1997. Infectiousness of air from a tuberculosis ward: Ultraviolet irradiation of infected air: Comparative infectiousness of different patients: Riley RL, Mills CC, O'Grady F, Sultan LU, Wittstadt F, Shivpuri DN. Am Rev Respir Dis 1962;85:511-25. American Journal of Infection Control 25 (1):65–6. doi:https://doi.org/10.1016/S0196-6553(97)90057-2
- Schoen, L. 2020. Guidance for building operations during the COVID-19 pandemic. ASHRAE Journal 62 (5):72–4.
- Shen, J., M. Kong, B. Dong, M. J. Birnkrant, and J. Zhang. 2021. A systematic approach to estimating the effectiveness of multi-scale IAQ strategies for reducing the risk of airborne infection of SARS-CoV-2. Building and Environment 200:107926 doi:https://doi.org/10.1016/j.buildenv.2021.107926
- Stabile, L., A. Pacitto, A. Mikszewski, L. Morawska, and G. Buonanno. 2021. Ventilation procedures to minimize the airborne transmission of viruses at schools. medRxiv 2021. 3 (23):21254179. doi:https://doi.org/10.1101/2021.03.23.21254179.
- Taylor, J. G., T. A. Yates, M. Mthethwa, F. Tanser, I. Abubakar, and H. Altamirano. 2016. Measuring ventilation and modelling M. tuberculosis transmission in indoor congregate settings, rural KwaZulu-Natal. The International Journal of Tuberculosis and Lung Disease 20 (9):1155–61. doi:https://doi.org/10.5588/ijtld.16.0085
- To, G. N. S., and C. Y. H. Chao. 2010. Review and comparison between the Wells-Riley and dose-response approaches to risk assessment of infectious respiratory diseases. Indoor Air 20 (1):2–16. doi:https://doi.org/10.1111/j.1600-0668.2009.00621.x
- To, K. K.-W., O. T.-Y. Tsang, W.-S. Leung, A. R. Tam, T.-C. Wu, D. C. Lung, C. C.-Y. Yip, J.-P. Cai, J. M.-C. Chan, T. S.-H. Chik, et al. 2020. Temporal profiles of viral load in posterior oropharyngeal saliva samples and serum antibody responses during infection by SARS-CoV-2: An observational cohort study. The Lancet. Infectious Diseases 20 (5):565–74. doi:https://doi.org/10.1016/S1473-3099(20)30196-1
- Urrego, J., A. I. Ko, A. da Silva Santos Carbone, D. S. G. Paião, R. V. E. Sgarbi, C. W. Yeckel, J. R. Andrews, and J. Croda. 2015. The impact of ventilation and early diagnosis on tuberculosis transmission in Brazilian prisons. The American Journal of Tropical Medicine and Hygiene 93 (4):739–46. doi:https://doi.org/10.4269/ajtmh.15-0166
- van Doremalen, N., T. Bushmaker, D. H. Morris, M. G. Holbrook, A. Gamble, B. N. Williamson, A. Tamin, J. L. Harcourt, N. J. Thornburg, S. I. Gerber, et al. 2020. Aerosol and surface stability of SARS-CoV-2 as compared with SARS-CoV-1. The New England Journal of Medicine 382 (16):1564–7. doi:https://doi.org/10.1056/NEJMc2004973
- Wagner, B., B. Coburn, and S. Blower. 2009. Calculating the potential for within-flight transmission of influenza A (H1N1). BMC Medicine 7:81 doi:https://doi.org/10.1186/1741-7015-7-81
- Walsh, K. A., K. Jordan, B. Clyne, D. Rohde, L. Drummond, P. Byrne, S. Ahern, P. G. Carty, K. K. O'Brien, E. O'Murchu, et al. 2020. SARS-CoV-2 detection, viral load and infectivity over the course of an infection: SARS-CoV-2 detection, viral load and infectivity. The Journal of Infection 81 (3):357–71. doi:https://doi.org/10.1016/j.jinf.2020.06.067
- Weber, A., K. Willeke, R. Marchloni, T. Myojo, R. McKay, J. Donnelly, and F. Liebhaber. 1993. Aerosol penetration and leakae characteristics of masks used in the health care industry. American Journal of Infection Control 21 (4):167–73. doi:https://doi.org/10.1016/0196-6553(93)90027-2
- Wells, W. F. 1955. Airborne Contagion and Air Hygiene, 117–22. Cambridge MA: Cambridge University Press.
- Wei, J, Shurui, G, Enshen, L, Li, Z, Bizhen, S, & Lei, G. 2021. Why does the spread of COVID-19 vary greatly in different countries? Revealing the efficacy of face masks in epidemic prevention. Epidemiology and Infection 149:e24. doi:https://doi.org/10.1017/S0950268821000108
- WHO. 2020a. Modes of transmission of virus causing COVID-19: Implications for IPC precaution recommendations. https://www.who.int/news-room/commentaries/detail/modes-of-transmission-of-virus-causing-covid-19-implications-for-ipc-precaution-recommendations.
- WHO. 2020b. Transmission of SARS-CoV-2: Implications for infection prevention precautions. https://www.who.int/news-room/commentaries/detail/transmission-of-sars-cov-2-implications-for-infection-prevention-precautions.
- Wölfel, R., V. M. Corman, W. Guggemos, M. Seilmaier, S. Zange, M. A. Müller, D. Niemeyer, T. C. Jones, P. Vollmar, C. Rothe, et al. 2020. Virological assessment of hospitalized patients with COVID-2019. Nature 581 (7809):465–9. doi:https://doi.org/10.1038/s41586-020-2196-x
- Wood, R., S. Johnstone-Robertson, P. Uys, J. Hargrove, K. Middelkoop, S. D. Lawn, and L.-G. Bekker. 2010. Tuberculosis transmission to young children in a South African community: Modeling household and community infection risks). Clinical Infectious Diseases 51 (4):401–8. doi:https://doi.org/10.1086/655129
- Wu, J. T., K. Leung, and G. M. Leung. 2020. Nowcasting and forecasting the potential domestic and international spread of the 2019-nCoV outbreak originating in Wuhan, China: A modelling study. Lancet (London, England) 395 (10225):689–97. doi:https://doi.org/10.1016/S0140-6736(20)30260-9
- Xu, H., Z. Gang, and Z. Peng. 2006. HVAC design for campus buildings. HV & AC 36 (1):8. doi:https://doi.org/10.3969/j.issn.1002-8501.2006.01.013
- Xu, P., E. Kujundzic, J. Peccia, M. P. Schafer, G. Moss, M. Hernandez, and S. L. Miller. 2005. Impact of environmental factors on efficacy of upper-room air ultraviolet germicidal irradiation for inactivating airborne mycobacteria. Environmental Science & Technology 39 (24):9656–64. doi:https://doi.org/10.1021/es0504892
- Xu, C., X. Luo, C. Yu, and S.-J. Cao. 2020. The 2019-nCoV epidemic control strategies and future challenges of building healthy smart cities. Indoor and Built Environment 29 (5):639–44. doi:https://doi.org/10.1177/1420326X20910408
- Yan, Y., X. Li, Y. Shang, and J. Tu. 2017. Evaluation of airborne disease infection risks in an airliner cabin using the Lagrangian-based Wells-Riley approach. Building and Environment 121:79–92. doi:https://doi.org/10.1016/j.buildenv.2017.05.013
- Yoon, J. G., J. Yoon, J. Y. Song, S. Y. Yoon, C. S. Lim, H. Seong, J. Y. Noh, H. J. Cheong, and W. J. Kim. 2020. Clinical Significance of a High SARS-CoV-2 Viral Load in the Saliva. Journal of Korean Medical Science 35 (20):e195e. doi:https://doi.org/10.3346/jkms.2020.35.e195
- Zhang, J. 2020. Integrating IAQ control strategies to reduce the risk of asymptomatic SARS CoV-2 infections in classrooms and open plan offices. Science and Technology for the Built Environment 26 (8):1013–8. doi:https://doi.org/10.1080/23744731.2020.1794499
- Zhang, N., H. Huang, B. Su, X. Ma, and Y. Li. 2018. A human behavior integrated hierarchical model of airborne disease transmission in a large city. Building and Environment 127:211–20. doi:https://doi.org/10.1016/j.buildenv.2017.11.011
- Zhao, S., Q. Lin, J. Ran, S. S. Musa, G. Yang, W. Wang, Y. Lou, D. Gao, L. Yang, D. He, et al. 2020. Preliminary estimation of the basic reproduction number of novel coronavirus (2019-nCoV) in China, from 2019 to 2020: A data-driven analysis in the early phase of the outbreak. International Journal of Infectious Diseases: IJID: Official Publication of the International Society for Infectious Diseases 92:214–7. doi:https://doi.org/10.1016/j.ijid.2020.01.050
- Zheng, S., J. Fan, F. Yu, B. Feng, B. Lou, Q. Zou, G. Xie, et al. 2020. Viral load dynamics and disease severity in patients infected with SARS-CoV-2 in Zhejiang province, China, January-March 2020: Retrospective cohort study. BMJ 369. doi:https://doi.org/10.1136bmj.m1443.