
 ?Mathematical formulae have been encoded as MathML and are displayed in this HTML version using MathJax in order to improve their display. Uncheck the box to turn MathJax off. This feature requires Javascript. Click on a formula to zoom.
Abstract
The COVID-19 pandemic has caused millions of deaths and great economic loss globally. There has been substantial evidence supporting the airborne transmission of SARS-CoV-2. Airborne route has been considered as a major transmission pathway, which can spread the disease over a longer distance and time. The viral loads in the respiratory tract of a virus carrier are typically below 109 RNA copies/mL and are related to the emission rate of pathogens. Most particles expelled during respiratory activities are smaller than 1–2 µm in diameter. Viral aerosols can remain infectious for hours under typical indoor conditions. Sunlight contributes greatly to the viability inactivation of SARS-CoV-2. The outbreaks in different scenarios are reviewed based on existing data. Most outbreaks were related to long-term care facilities, K-12 schools, restaurants, retail facilities, and offices. The Wells-Riley model for estimating the risk of airborne transmission is introduced, along with model parameters such as the quanta generation rate, virus-containing particle size distribution, and inactivation rate. The effectiveness of various IAQ control strategies for mitigating the airborne transmission risk is analyzed, including PPE, ventilation strategies, partitions, air cleaning, and disinfection technologies, and occupancy control strategies. Both benefits and costs should be considered in designing the control strategies.
Background
The novel coronavirus disease 2019 (COVID-19) pandemic caused by the severe acute respiratory syndrome coronavirus 2 (SARS-CoV-2) has lasted for over one and half years. It has caused millions of deaths and great economic loss globally (WHO Citation2021a). Currently, a mass vaccination effort against COVID-19 is getting underway worldwide. But the world is still facing a severe situation of pandemic as new COVID-19 cases have risen to over 600,000 per day over the last few weeks. Many countries are currently facing another serious wave of infections (WHO Citation2021a). Some emerging SARS-CoV-2 variants, e.g. the delta variant, have increased transmissibility, which further brings the world more unknown challenges (U.S. CDC Citation2021n). At the current stage, minimizing the virus transmission is still essential in reducing the risk of COVID-19 infection.
Studies have revealed that most COVID-19 infections occurred in indoor environments while outdoor outbreaks only account for less than 10% of the infection cases (Bulfone et al. Citation2021). In addition to fomite route through contacts with infected people or contaminated surfaces and droplet-borne route transmitted by medium (5–100 µm) or large droplets (>100 µm) (Wei and Li Citation2016), more and more studies have revealed the possibility of airborne transmission through aerosols (<5 µm) for SARS-CoV-2 (D. Lewis Citation2020a; Y. Li et al. Citation2020; Luo et al. Citation2020; Miller et al. Citation2020; Morawska and Milton Citation2020; Park et al. Citation2020; Setti et al. Citation2020a; Y. Shen et al. Citation2020; The Lancet Respiratory Medicine Citation2020a; N. Wilson, Corbett, and Tovey Citation2020a). Virus-laden aerosols can be expelled by breathing, talking, and coughing by the infectors, and remain suspended in the air over a longer time and distance, and in some circumstances, may travel beyond the most recommended social distance (i.e. 2 m) (Y. Li et al. Citation2020; Luo et al. Citation2020; Miller et al. Citation2020; Y. Shen et al. Citation2020). Therefore, airborne transmission may play an important role in spreading SARS-CoV-2, particularly in crowded and inadequately ventilated indoor spaces, where virus-laden particles generated by the infectors cannot be removed or diluted efficiently (U.S. CDC Citation2020d; WHO Citation2020f, Citation2020b). Some studies even indicated the airborne route as the predominant transmission of COVID-19 (Nature Citation2021; R. Zhang et al. Citation2020). It is also believed that airborne transmission is likely the key to explain the superspreading events that vastly occurred in indoor environments (Swinkels Citation2020). Public health or environment agencies, including WHO, U.S. CDC, China NHC, Europe CDC, Canada PHAC, U.S. EPA, and ASHRAE, have raised the concern on the airborne route of SARS-CoV-2 transmission (ASHRAE Citation2020b; China NHC Citation2020; Europe CDC Citation2020; PHAC Citation2020; U.S. CDC Citation2020d; WHO Citation2020b).
The outbreaks of COVID-19 have been vastly reported in some indoor scenarios like long-term care facilities, manufacturing facilities, correctional facilities, schools and colleges, healthcare facilities and hospitals, retail facilities, restaurants, and offices (CDPHE Citation2020). Airborne transmission has been suspected as the potential or even predominant route for SARS-CoV-2 transmission in these indoor scenarios. Considering the various indoor settings such as occupant density, behavior and building layout and ventilation settings between different scenarios, the role of airborne transmission and relevant interventions in various scenarios can vary greatly. In order to reduce the airborne transmission risk, many control strategies have been introduced, including personal protective equipment (PPE), improved ventilation and air distribution, standalone air cleaning and disinfection technologies, and occupancy control and restriction (Bazant and Bush Citation2021; A. K. Melikov, Ai, and Markov Citation2020; Morawska et al. Citation2020; J. Shen et al. Citation2021; J. Zhang Citation2020). Both benefits and costs of control strategies are crucial for designing the control strategies in a specific scenario.
This study reviewed the previous research on the airborne transmission of SARS-CoV-2 in indoor environments from the perspective of indoor air quality (IAQ) and its control. The existing evidence supporting the airborne transmission of SARS-CoV-2 was reviewed. Then the mechanism of airborne transmission, including the viral load in the respiratory tract, expelled virus-laden particle concentration and size distribution, viral natural inactivation under different environmental conditions, and the transmissibility of some SARS-CoV-2 variants, were introduced. The outbreaks in different scenarios were also reviewed based on the existing data, and the role of airborne transmission in these outbreaks was analyzed. The commonly used models for estimating the risk of airborne transmission were introduced along with the estimation of model parameters. In the end, the IAQ control strategies for mitigating the airborne transmission risk of SARS-CoV-2 are discussed.
Evidence and mechanism of SARS-CoV-2 airborne transmission
Evidence of airborne transmission
There was a controversy about the routes of COVID-19 transmission. During the initial takeoff of the pandemic, close contact with the infectors, contaminated surfaces, and expelled droplets were believed to be the dominant routes. Due to the lack of sufficient evidence, the airborne transmission of COVID-19 was not suggested by major public health agencies in their guidelines (WHO Citation2020c, Citation2020e), although some people raised their concerns on the possible transmission through aerosols (Favre Citation2020; Offord Citation2020) based on the experience on other respiratory diseases (Xiao et al. Citation2018; Yu et al. Citation2004). With further research on the pandemic, more and more scientific results suggested that airborne transmission played an important role in SARS-CoV-2 infection. Many studies sampled and analyzed the air in different environments where infectors were occupied, including hospital settings, healthcare facilities, quarantined hotels, and other public places and transportations, to figure out whether the virus can be carried by aerosols and travel on airflow. Contrasting results were reported in these studies. Some research did not observe viral RNA in their air samples (Cheng et al. Citation2020b; Döhla et al. Citation2020; Dunker et al. Citation2021; Faridi et al. Citation2020; U. J. Kim et al. Citation2020; Lane et al. Citation2020; Y. H. Li et al. Citation2020; Masoumbeigi et al. Citation2020; Nakamura et al. 2020), while most studies detected positive for SARS-CoV-2 in the air (Binder et al. Citation2020; Chia et al. Citation2020b; Ding et al. Citation2021; B. Feng et al. Citation2021; Z. D. Guo et al. Citation2020; Hadei et al. Citation2021; Jiang et al. Citation2020; Jin et al. Citation2021; Kenarkoohi et al. Citation2020; Lednicky et al. Citation2020; Y. Liu et al. Citation2020; Ma et al. Citation2020; Moore et al. Citation2021; Moreno et al. Citation2021; Mouchtouri et al. Citation2020; Razzini et al. Citation2020; Santarpia et al. Citation2020; Setti et al. Citation2020b; Stern et al. Citation2021; Tan et al. Citation2020; Zhou et al. Citation2021). Viral RNA was vastly detected in the air of hospital settings, e.g. patient rooms, intensive care units (ICUs), bathrooms, and corridors, probably due to the high density of infectors in hospitals and the aerosol-generating procedures for the treatment (e.g. intubation), which may generate considerable virus-laden aerosols. Viruses were even detected in the ventilation system in hospitals, indicating the possible viral transmission through ventilation ducts (Horve et al. Citation2020; Nissen et al. Citation2020; Ong et al. Citation2020). Most studies suggested that outdoor air was safe and not infectious for the public excluding crowded sites (Chirizzi et al. Citation2021; Hu et al. Citation2020), though viral RNA was detected in some outdoor air samples collected in Italy (Setti et al. Citation2020b). But the concentrations of virus-laden particles were not evaluated in their study. Therefore, it is unlikely a role of airborne transmission of COVID-19 in outdoor environments, excluding crowded areas.
However, even though viral RNA was detected in the air samples, experts still questioned the airborne viability of SARS-CoV-2 in the carrier aerosols (WHO Citation2020c). Because most of these studies sought to determine the viral presence, while samples were not evaluated for viral infectivity, which is a key criterion for evaluating airborne transmission (S. Tang et al. Citation2020). Some studies detected viral RNA in aerosols but none of the positive samples showed evidence of viable virus (Binder et al. Citation2020; Maestre et al. Citation2021; Moore et al. Citation2021; Moreno et al. Citation2021). However, Santarpia et al. (Citation2020) detected viable viruses in some aerosol samples using the cell culture method in hospitals in Nebraska. Lednicky et al. (Citation2020, Citation2021) detected viable SARS-CoV-2 isolated from air samples collected in a hospital in Florida and a car driven by a patient. Therefore, the expelled aerosols have the potential to serve as a source of transmission of the virus.
Viral infectivity on aerosols was also vastly supported by laboratory experiments. The virus-laden aerosols generated in experimental conditions can typically remain infectious for hours. van Doremalen et al. (Citation2020) observed that the half-lives of infectious virus in aerosols were around 1.1 h, while the viral half-lives measured by Smither et al. (Citation2020) ranged from half-hour to nearly 3 h for different humidity conditions. Fears et al. (Citation2020) observed that infectivity and virion integrity were maintained for up to 16 h in aerosols. Dabisch et al. (Citation2020) measured the time required for a 90% decrease in infectious viruses greater than 2 h. The 90% viral infectivity loss time measured by Schuit et al. (Citation2020) was more than 4 h. Rapid decay of viral infectivity was also observed when the virus was exposed to simulated sunlight. The 90% infectivity loss time was greatly reduced to between 4.8 and 19 min (Dabisch et al. Citation2020; Schuit et al. Citation2020). However, the results of laboratory experiments were questioned by some experts since the aerosol-generating procedure in laboratory conditions was likely stronger than normal human cough conditions as high-powered machines were used to generate particles (WHO Citation2020c). WHO (Citation2020c) believed that this kind of experimentally induced aerosol-generating procedure cannot reflect the actual setting and therefore was not sufficient for suggesting airborne transmission.
Other studies conducted retrospective analyses on real outbreak events and indicated that airborne transmission was likely to occur in these outbreaks since the other routes were not able to explain the viral spreading in these outbreaks. For example, airborne transmission through the air was likely the key to explain the remarkable viral spreading around the Amazon rainforest (Crema Citation2021). The outbreaks in apartment buildings in Seoul (Hwang et al. Citation2021), Guangzhou (Kang et al. Citation2020; S. Tang et al. Citation2020), and Ordos (Wang and Du Citation2020) were believed to be highly relevant with the airborne transmission as no other contacts were reported between some patients. The viral spreading among people during the church singing in Mount Vernon (Buonanno, Morawska, and Stabile Citation2020; Miller et al. Citation2020) and Sydney (Katelaris et al. Citation2021), during the traveling in a coach/bus in Hunan (Luo et al. Citation2020) and Zhejiang (Y. Shen et al. Citation2020), during a long-haul flight to Vietnam (Khanh et al. Citation2020), and during working in a German meat processing plant (Günther et al. Citation2020), was highly suggested to be associated with the transmission through airborne route since infection occurred over distances of at least 2 m. The outbreaks in a Guangzhou restaurant (Buonanno, Morawska, and Stabile Citation2020; Y. Li et al. Citation2020) and a bar in Ho Chi Minh City (Chau et al. Citation2021) were likely due to the poor-ventilated air in the room. The airborne transmission was also likely a possible viral spreading route for the outbreaks on the Diamond Princess cruise ship (Azimi et al. Citation2021) and in a shopping mall in Wenzhou (J. Cai et al. Citation2020). R. Zhang et al. (Citation2020) analyzed some outbreak events in China, Italy, and New York City, and suggested that airborne transmission was highly virulent and represented the dominant route to spread the disease. Evidence revealed that airborne transmission can partially explain the high attack rate in many superspreading events (Buonanno, Morawska, and Stabile Citation2020; D. Lewis Citation2021a). The airborne transmission was also observed between some animals like ferrets and cats through animal experiments (Y. I. Kim et al. Citation2020; Kutter et al. Citation2021; Richard et al. Citation2020; Shi et al. Citation2020).
Based on research evidence, the airborne route of viral transmission has been widely recognized by scientists and experts (Aghalari et al. Citation2021; E. L. Anderson et al. Citation2020; Greenhalgh et al. Citation2021; Morawska and Cao Citation2020). In July 2020, 239 scientists from more than 30 countries highlighted the possible role of aerosols in the transmission of SARS-CoV-2 (Morawska and Milton Citation2020). Greenhalgh et al. (Citation2021) recently presented ten scientific reasons in support of the airborne transmission of SARS-CoV-2. Many scientific journals, e.g. Nature, The Lancet Respiratory Medicine, The BMJ, and Indoor Air, have published their editorials to suggest the potential of airborne transmission of COVID-19 (A. K. Melikov Citation2020; Nature Citation2021; Rijn et al. Citation2020; J. W. Tang et al. Citation2021; The Lancet Respiratory Medicine Citation2020b; N. Wilson, Corbett, and Tovey Citation2020b; J. Zhang Citation2020). Most public health and environment agencies, including WHO, U.S. CDC, China NHC, Europe CDC, Canada PHAC, and ASHRAE, have also declared the possibility of airborne transmission in their guidelines. The aforementioned studies on airborne transmission were listed in . A brief timeline of studies on airborne transmission and responses from public agencies was illustrated in . Based on the existing evidence, it is increasingly clear and accepted that airborne transmission is an important contributor to the rapid and long-distance spreading of SARS-CoV-2.
Fig. 1. Timeline of major studies on the airborne transmission of COVID-19 and responses from public agencies (data as of April 19th, 2021 (WHO Citation2021a)) (Google Trends index indicates the worldwide query data on “COVID airborne” on Google (Citation2020). The index is calculated to be ranged from 0 to 100 (Choi and Varian Citation2012)).
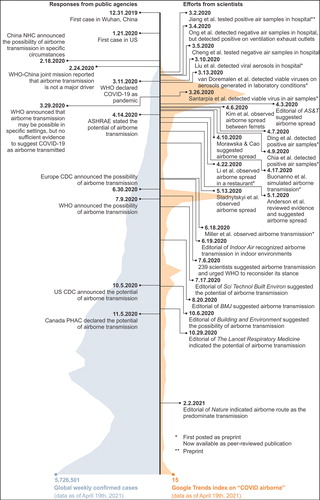
Table 1. Major studies on the airborne transmission of SARS-CoV-2.
Mechanism of airborne transmission
Virus-containing body secretions and excreta can be aerosolized into infectious virus-laden droplets or particles in a variety of ways (S. Tang et al. Citation2020). Respiratory secretions can be aerosolized through daily activities (e.g. breathing, talking, coughing, and sneezing) and medical procedures (e.g. intubation) (Zietsman, Phan, and Jones Citation2019), while excreta can be aerosolized through toilet flushing (Johnson et al. Citation2013). Considering that respiratory activities are performed all the time, this study mainly focuses on aerosol transmission due to daily respiratory activities. But the SARS-CoV-2 transmission by aerosols generated through medical procedures or toilet flushing is still a potential route. Medical procedures were likely related to the vastly detected viral RNA in hospitals (Tan et al. Citation2020). Fecal aerosol transmission due to toilet flushing was suspected to be associated with some reported cases in apartment buildings (Hwang et al. Citation2021; Kang et al. Citation2020; Ma et al. Citation2020).
The virus-carrying droplets are formed in the respiratory tract and released from the mouth and nose to the environment through breathing, talking, coughing, and sneezing (Dhand and Li Citation2020; Wei and Li Citation2016). The number and size of expelled droplets depend largely on the locations within the respiratory tract where they originate. The oral cavity usually produces larger droplets (≥100 µm in size) during speech and coughing, whereas smaller droplets originate in the larynx during voicing and coughing (≥1 µm) and the bronchioles during normal breathing (≤1 µm) (Dhand and Li Citation2020). The time and distance expelled droplets travel in indoor environments greatly depend on the expiration air jet, particle size, and ambient airflow field. Typically, coughing and sneezing have a higher exhalation velocity and droplet concentration but a lower event frequency, while breathing and talking have a lower velocity and droplet concentration but a higher event frequency. Chao et al. (Citation2009) measured an average expiration air velocity of 11.7 m/s for coughing and 3.9 m/s for speaking. Large droplets usually deposit or evaporate into small nuclei quickly in indoor environments. Deposition occurs either by gravitational sedimentation, turbulent eddy impaction, or diffusional deposition. The deposited particles can be resuspended to the air due to occupant activities such as walking and hence become a potential source (Y. Li et al. Citation2020). It was reported that expelled large droplets can typically travel around 2 m before falling on the floor or being evaporated (Wei and Li Citation2016). Therefore, most droplet transmission likely occurs at close range and the 2-meter social distance has been widely recommended by various guidelines. However, for small droplets, gravitational sedimentation is relatively negligible, whereas turbulent eddy impact or diffusional deposition may occur. Small droplets are subject to the ambient velocity field, and their evaporation (into small nuclei) clearly assists in transporting them a significant distance (Dhand and Li Citation2020). Therefore, smaller droplets can typically remain suspended in the air for a longer time and travel with the ambient airflow for a farther distance (over 2 m). Evidence showed that particles of diameters 1–3 µm remained suspended almost indefinitely (Wei and Li Citation2016). Therefore, expelled aerosols (<5 µm in diameter) are believed to play an important role in SARS-CoV-2 transmission.
The susceptible individuals’ inhalation of the contaminated air that carries infectious aerosols expelled by the infected subjects, is referred to as the airborne route (Wei and Li Citation2016). Aerosols that carrying SARS-CoV-2 can remain infectious for hours in the air, depending on temperature, humidity, and sunlight (Azuma et al. Citation2020; Dabisch et al. Citation2020; Fears et al. Citation2020; Schuit et al. Citation2020; van Doremalen et al. Citation2020). The susceptible individual who breathes in these infectious aerosols can become infected with COVID-19. Inhaled particles can deposit in the respiratory tract and cause infection. The infection risk depends on the quantity of virus inhaled and the site at which the virus-laden particles deposit within the respiratory tract. Therefore, the viral transmission through the airborne route generally includes three phases, i.e. the release of respiratory particles, the transport and dispersion of aerosols in the indoor environment, and the ultimate exposure of the susceptible individual. Understanding the mechanism of airborne transmission can be beneficial in reducing the infection risk in indoor environments.
Viral load in mouth
The viral load of the particles exhaled by the infector is closely associated with the infection risk of airborne transmission. However, it is still difficult to directly determine the viral load of the exhaled particles. Considering that exhaled particles are formed in the respiratory tract and released through respiratory activities, it is possible to derive the exhaled viral load based on the viral load in the respiratory tract, which can be detected more easily (Buonanno, Stabile, and Morawska Citation2020). Walsh et al. (Citation2020) performed a detailed review on studies in viral load of SARS-CoV-2 and observed no significant difference of viral loads between asymptomatic and symptomatic patients. Evidence also suggests that the viral load of SARS-CoV-2 peaks around symptom onset or a few days thereafter, and becomes undetectable about two weeks after symptom onset. Higher viral load is likely associated with more severe symptoms (Walsh et al. Citation2020). Buonanno, Stabile, and Morawska (Citation2020) presented an approach (EquationEquation 1(1)
(1) ) to estimate the viral load emitted by a contagious subject based on the viral load in the mouth (or sputum), the type of respiratory activity (e.g., breathing, speaking, or coughing) and activity level (e.g., resting, standing, light exercise). The emission rate of virus quanta (ER) can be determined by the viral load in the sputum (cv), the conversion factor (ci), inhalation rate (IR), and total particle volume (relies on particle number ND and volume VD of each size in diameter D). One quantum in the model represents an infectious dose that would infect 63% of the population with the exposure, i.e. the infection dose ID63 (E. C. Riley, Murphy, and Riley Citation1978). The infectious quanta generation rate has a unit of quanta per hour (h−1) and describes the number of infectious particles/pathogens in a way that implicitly includes both the number of virus particles generated in time and the infectivity of particles (which also inherently captures particle size effects and probability of deposition in appropriate regions of the respiratory system) (Sze To and Chao Citation2010).
(1)
(1)
The viral load in sputum has been measured in some studies. Fajnzylber et al. (2020) measured 1.8–9.0 log10 RNA copies/mL in sputum with a median level of 4.4 log10 RNA copies/mL. Wölfel et al. (Citation2020) measured the average viral load in sputum of 6.85 log10 RNA copies/mL, with a maximum of 9.37 log10 RNA copies/mL. J. Yoon et al. (Citation2020) reported the viral load in the sputum of two patients between 4.86 and 8.22 log10 RNA copies/mL. J. Y. Kim et al. (Citation2020) detected the viral load in the sputum of the first two patients in South Korea roughly between 5 and 9 log10 RNA copies/mL. Pan et al. (Citation2020) collected sputum samples from 80 patients and observed a median viral load of 5.88 log10 RNA copies/mL with a maximum of 11.13 log10 RNA copies/mL. S. Zheng et al. (Citation2020) collected 1846 respiratory samples (including sputum and saliva samples) and detected the viral load approximately between 3 and 8 log10 RNA copies/mL. To et al. (2020) measured the peak viral load in the respiratory tract between 3.91 and 7.56 log10 RNA copies/mL with a median of 5.29 log10 RNA copies/mL for patients with mild disease, and the peak viral load between 4.27 and 7.40 log10 RNA copies/mL with a median of 6.91 log10 RNA copies/mL for patients with severe disease. Han et al. (Citation2020) detected the viral load in the sputum of a patient roughly between 4 and 6 log10 RNA copies/mL. It can be observed that the viral load in sputum can reach a level as high as 11 log10 RNA copies/mL, while most of the existing data is approximately below 9 log10 RNA copies/mL. A recent study (J. Li et al. Citation2021) reviewed and analyzed the existing data of viral load in sputum in literature (397 samples) and observed a normal distribution of viral load with a mean value of 4.87 log10 RNA copies/mL and a standard deviation of 1.90, indicating 99% of the viral load in sputum is below 9.30 log10 RNA copies/mL. Some variants may have higher viral loads than the original strain. A study reported over 1000 times greater viral loads in oropharyngeal swabs for the Delta variant than the original viral lineage (B. Li et al. Citation2021).
Virus-laden particle concentration and size distribution
Morawska et al. (Citation2009) measured the size distribution of expelled aerosols during different expiratory activities (), including breathing, whispered counting, voiced counting, unmodulated vocalization, unmodulated whispering, and coughing. It recognized that most expelled droplets are in the smaller size, with diameters below 0.8 µm at average concentrations up to 0.75 cm−3 (accounting for around 70–80% of total particle numbers), followed by droplets at 1.8 µm at lower concentrations up to 0.14 cm−3 (around 10–20%), while few droplets near 3.5 µm and 5.5 µm generated (typically less than 6%). However, speech produced additional particles near 3.5 µm and 5.5 µm, at average concentrations of 0.04 cm−3 and 0.16 cm−3 (18% of total particles), respectively. Stephens (Citation2013) conducted a systematic review for the particle size distribution of droplet nuclei and came up with a similar conclusion that the majority (typically 80–90%) of particles expelled during various human activities are smaller than 1–2 µm in diameter. It also suggested that the size distribution did not change significantly between activities, although coughing emitted a larger number of particles than breathing and talking, on average. Variations in size between age groups and gender groups were not significant either. Although the majority of expelled droplets distribute in a smaller size range, droplets in smaller diameters may contain less virus due to the smaller particle volume, which means the pathogen in the air does not distribute in the same way as the size-resolved particle number distribution. When considering the droplet volume and droplet size distribution, larger droplets contain more pathogens, typically 80–90% for particles >3 µm (J. Shen et al. Citation2021). It can also explain why some non-HEPA (i.e. high-efficiency particulate air) filters, such as filters with minimum efficiency reporting value (MERV) of 13, can still be effective in removing pathogens, as those filters are typically more effective in removing larger particles (J. Shen et al. Citation2021).
Table 2. Number concentration and proportion in different sizes of expelled particles during different activities (adapted from Morawska et al. (Citation2009)).
Some studies have conducted measurements of virus distribution in indoor environments rather than directly on exhaled droplets. Stephens (Citation2013) reviewed such studies for influenza and estimated the size-resolved distribution of pathogen using the data in the literature (Lindsley et al. Citation2010), i.e. 15% of pathogens in the 0.3–1 µm size range, 25% in the 1–3 µm size range, and 60% in the 3–10 µm size range. A report from CDPH (Citation2020) suggested the distribution of 20%, 30%, and 50% for infectious particles of SARS-CoV-2 in 0.3–1 µm, 1–3 µm and 3–10 µm, respectively. It was assumed that those indoor measurements account for a combination of all human respiratory activities that occur indoors (Stephens Citation2013). The published data regarding the measured viral concentration and size distribution of airborne SARS-CoV-2 aerosols are summarized in . The proportion of pathogens in larger droplets is lower than the proportion in expelled droplets, which is likely due to more deposition and evaporation for larger particles. The present of viral aerosols in protective-apparel removal room, staff’s office and corridor suggested the possibility of infection beyond patient rooms in hospitals. Usually, higher viral concentrations appeared within closer distances to patients. Both symptomatic and asymptomatic patients can generate considerable viral aerosols.
Table 3. Concentration and distribution of airborne SARS-CoV-2 across particle diameters.
Natural inactivation rate for infectious aerosols
Virus-carrying aerosols expelled by the COVID-19 patients have been detected to be infectious in some hospital settings (Lednicky et al. Citation2020; Santarpia et al. Citation2020). However, the field data are not designed to determine how long the virus can survive. Some experimental studies have also been conducted in laboratory environments to study the viability of virus-laden aerosols in the air under different environmental conditions. The infectivity of viral aerosols can typically remain for up to hours in the air under typical indoor environment conditions. But a rapid decay was observed when the aerosols were exposed to sunlight (Dabisch et al. Citation2020; Schuit et al. Citation2020). Temperature and humidity may also influence the persistence of viable SARS-CoV-2 in aerosols.
van Doremalen et al. (Citation2020) tested the half-lives of SARS-CoV-2 in aerosols and estimated an approximation of 1.1 h (95% credible intervals (CI) 0.64–2.64 h) at 21–23 °C and 40% RH, which indicates an inactivation rate of 0.63 h−1 (95% CI 0.26–1.08 h−1). This value has been widely used in some modeling works (Buonanno, Morawska, and Stabile Citation2020; Buonanno, Stabile, and Morawska Citation2020; Rothamer et al. Citation2020). Fears et al. (Citation2020) observed no decay in virus-containing aerosol for 16 h at 23 ± 2 °C and 53 ± 11% RH, indicating a nearly zero inactivation rate. Smither et al. (Citation2020) suggested an average inactivation rate of 0.75 h−1 in aerosols at 19–22 °C and medium relative humidity (40–60%) in the dark, and 0.80 h−1 at high relative humidity (68–88%) for the SARS-CoV-2 Alpha variant. Schuit et al. (Citation2020) suggested that relative humidity alone did not affect the inactivation rate but can have minor interactions with other factors. The inactivation rate without sunlight across all relative humidity levels (20–70%) was 0.48 ± 0.66 h−1 (90% loss, 286 min). The natural inactivation rate under simulated sunlight levels representative of late winter/early fall and summer were 7.26 ± 1.02 h−1 (90% loss, 19 min) and 18.36 ± 5.82h−1 (90% loss, 8 min), respectively. Dabisch et al. (Citation2020) observed that temperature, sunlight, and humidity are all significant factors influencing the persistence of viable SARS-CoV-2 in aerosols, while sunlight and temperature have a greater influence on decay than humidity across the tested range (10–40 °C, 20–70% RH, 0–1.9 W/m2 UVB irradiance). Higher temperature and sunlight intensity can generally increase the inactivation of viral infectivity. An average inactivation rate of 0.69 h−1 was observed at the typical indoor temperature (20 °C) without sunlight. Elevated inactivation rates were observed at 20 °C under low-intensity (representative of late winter/early fall, 7.26 h−1) and high-intensity (representative of summer, 18.09 h−1) sunlight conditions.
The regression analysis between the number of confirmed cases and the ambient environmental conditions (i.e. temperature, RH, and ozone concentration) of Chinese cities between January and March in 2020, also supported the impacts of environmental conditions on virus infectivity (Yao et al. Citation2020). The result showed that the spread of SARS-Cov-2 was reduced by increasing ambient ozone concentration level from 48.83 to 94.67 µg/m3, and decreasing relative humidity from 82.67 to 23.33% and temperature from 19 to −13.17 °C (Yao et al. Citation2020).
In conclusion, the typical inactivation rate of viable SARS-CoV-2 aerosols at typical indoor temperature (20–23 °C) and relative humidity (20–70%) without sunlight is generally between 0 and 1 h−1. Sunlight can contribute greatly to the inactivation of the viability of SARS-CoV-2. The inactivation rate of the viable aerosols is generally over 7 h−1 under low-intensity sunlight and over 18 h−1 under high-intensity sunlight. It has the potential as a passive strategy for mitigating virus transmission indoors. Temperature and humidity may also affect the inactivation of the infectivity of virus-laden aerosols.
Transmissibility of SARS-CoV-2 variants
Genetic variants of SARS-CoV-2 have been emerging and circulating around the world throughout the COVID-19 pandemic (U.S. CDC Citation2021m). Evidence has shown that some variants are associated with an increase in transmissibility and more severe disease, e.g. increased hospitalizations or deaths, and may also reduce the effectiveness of previous treatment measurements (U.S. CDC Citation2021m). At the current stage, the main SARS-CoV-2 variants of concern (VOCs) include the Alpha variant (B.1.1.7, first detected in the U.K.), the Beta variant (B.1.351, first detected in South Africa), the Gamma variant (P.1, first detected in Brazil), the Epsilon variant (B.1.427 and B.1.429, first detected in California) and the Delta variant (B.1.617.2, first detected in India). Studies have revealed that these variants generally have higher transmissibility than the original lineage, therefore, cause even more concerns about their spreading. The Alpha variant was observed 43 to 90% more transmissible than the predecessor lineage (N. Davies et al. Citation2021). The Beta variant was estimated to be 1.56 (95% CI 1.50–1.74) times transmissible as previously circulating lineages (Pearson et al. Citation2020). The Epsilon variant was detected and estimated to have an 18.6–24% increase in transmissibility (Deng et al. 2021). The latest and prevailing variant so far, the Delta variant, is responsible for over 83% of new infections in the U.S. as of July 2021 (Fry and Rapp Citation2021). It is highly contagious, nearly twice as transmissible as the original strain or previous variants (with an odds ratio of 1.88 (95% CI 0.95–3.76) compared with the original type (Ong et al. Citation2021) or an odds ratio of 1.64 (95% CI 1.26–2.13) compared to the Alpha variant (Hester Allen et al. Citation2021)). A recent report indicated that the viral loads of Delta infections were on average around 1000 times greater compared to the original strain of COVID-19 (B. Li et al. Citation2021). In many countries, the Delta variant has become the major challenge of COVID-19. Thus, the transmission of the airborne route for the Delta variant requires certain attentions and studies.
Outbreaks in different scenarios and the role of airborne transmission
Due to the huge difference in occupancy characteristics (e.g. density, age group, and behavior), room configurations (e.g. dimension and furniture layout), and ventilation settings (e.g. fresh and total supply airflow rate, air filtration, air distribution, and natural ventilation), the viral transmission in various indoor scenarios can vary greatly. The intervention for mitigating infection risk in various scenarios, therefore, can be very different. Public health agencies have provided guidelines for some key scenarios, including school, college, and workplace (U.S. CDC Citation2021a). Some reports have counted the COVID-19 cases in different scenarios. But the role of the airborne route in transmitting the virus in these scenarios has not been analyzed yet.
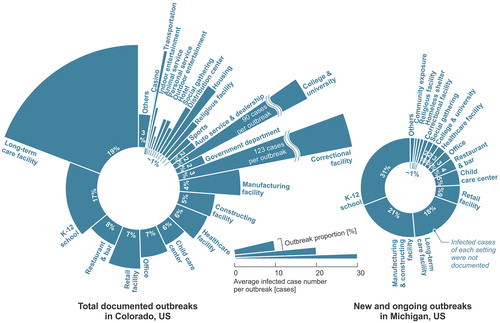
A report regarding the total COVID-19 outbreaks in Colorado since the pandemic revealed the proportion of outbreaks in various settings (data as of May 26th, 2021 (CDPHE Citation2020)). The documented outbreaks were associated with more than 86,000 infection cases, accounting for around 16% of total cumulative infection cases in Colorado. The majority of outbreaks were related to long-term care facilities, K-12 schools, restaurants and bars, retail facilities, and offices (). In addition, the outbreaks in long-term care facilities (25 cases/outbreak on average), correctional facilities (123 cases/outbreak), colleges and universities (90 cases/outbreak), and transportations (24 cases/outbreak) typically infected more people. The data in Michigan (MDHHS Citation2020) only reported the new and ongoing outbreaks in different settings. The documented data showed that K-12 schools, manufacturing and constructing facilities, long-term care facilities, and retail facilities are facing higher risks (). The definition of building/facility settings may have a few differences between various data. But it can be observed that long-term care facilities, manufacturing facilities, correctional facilities, K-12 schools, colleges, healthcare facilities and hospitals, retail facilities, restaurants, and offices are generally the scenarios with high outbreak probabilities, although the transmission modes of these documented cases were complicated. The data in Illinois (IDPH Citation2020) and Louisiana (LDHH Citation2020) revealed similar results. J. Shen et al. (Citation2021) simulated the airborne transmission in various scenarios with typical settings and estimated that long-term care facilities, colleges, meat plants, hotels, restaurants, casinos, and cruise ships are facing considerably higher infection probabilities and have a higher potential to cause serious outbreaks or even superspreading events, which is generally consistent with the reported data. This section reviewed the hotspot scenarios of COVID-19 outbreaks based on the documented data and analyzed the role of airborne route in viral transmission.
Fig. 2. COVID-19 outbreaks in various settings in Colorado (data as of May 26th, 2021 (CDPHE Citation2020)) and Michigan (data as of May 20th, 2021 (MDHHS Citation2020)).
Long-term care facility
Long-term care facilities provide a variety of services, both medical and personal care, to people who are unable to live independently, including facilities like nursing homes, and assisted living facilities (U.S. CDC Citation2019). There are currently more than 5 million people who reside or work in long-term care facilities in U.S. (Chidambaram Citation2020). The COVID-19 has had a disproportionate effect on the people in long-term care facilities, which makes long-term care facilities the major risk for COVID-19 infection (The New York Times Citation2020a, Citation2020b). The fatality rate of the infection cases among nursing home residents in the U.S. is nearly 11% (U.S. CMS Citation2021) (by May 16th, 2021), far exceeding the average nationwide fatality rate of 1.8% (WHO Citation2021a). A worldwide study reviewed the fatalities of COVID-19 in a range of high-income countries and found that 46% of reported nationwide COVID-19 fatalities took place in nursing homes (data as of June 26th, 2020) (Comas-Herrera et al. Citation2020; Gregg Girvan Citation2020). In some countries, this proportion can even reach 80% (Comas-Herrera et al. Citation2020; Gregg Girvan Citation2020). In 13 states in the U.S., at least half of deaths are linked to nursing homes (The New York Times Citation2020b). The residents in long-term care facilities are typically elderly people (83.5% of residents in nursing homes are aged 65 and older (Harris-Kojetin et al. Citation2019)), who are probably more vulnerable to COVID-19 and may face more significant risks of developing severe illness once get infected (F. Li et al. Citation2021). Therefore, the transmission and prevention of SARS-CoV-2 in long-term care facilities require more attentions (D. C. Anderson et al. Citation2020).
The airborne transmission of SARS-CoV-2 in long-term care facilities has been suggested as a potential route. Mouchtouri et al. (Citation2020) detected viral RNA on the filter of the air-conditioner device in a patient room in a nursing home. It suggested that the viral aerosols expelled by the infected patients can be displaced by the airflow. de Man et al. (Citation2020) suggested that an outbreak in a nursing home is caused by aerosol transmission in a situation of inadequate ventilation, considering the detected viral RNA in the HVAC system and the unfiltered air recirculation of the HVAC system. Besides, asymptomatic and pre-symptomatic transmission has been vastly reported in long-term care facilities (Dora et al. Citation2020; Kimball et al. 2020), which is supportive of the potential of airborne transmission (Greenhalgh et al. Citation2021).
A typical long-term care facility usually includes several single- or double-occupancy resident suites (including bedroom and bathroom) and other shared common areas, such as dining room, living room, activity room, or lounge. A nursing home may contain extra medical spaces. The size of a long-term care facility can vary from 20 or fewer residents to over 120 residents (National Institute on Aging Citation2017). A national survey for nursing homes in the U.S. suggested that the average number of beds per nursing home is around 107.6, of which an average of 86.3% are occupied (National Center for Health Statistics Citation2004), indicating an average of 93 residents per nursing home. The high occupancy and shared common areas elevate the occupant density in long-term care facilities. Considering the frequently reported asymptomatic cases (Dora et al. Citation2020; Kimball et al. 2020), the transmission through the airborne route in common areas is likely to happen if the space is insufficiently ventilated and the intervention measurements are not well implemented (de Man et al. Citation2020). J. Shen et al. (Citation2021) modeled the infection risk through airborne route in a long-term care facility with typical settings and suggested that virus is likely transmitted via airflow in double-resident bedrooms and common areas such as dining room and therapy room during communal dining and group activities. U.S. CDC (Citation2021i) suggested the residents wear PPE in common areas to control potential sources and recommended placing quarantined residents in single-resident bedrooms instead of double-resident rooms. Indoor ventilation should be improved to minimize the viral airborne transmission, e.g. increasing outdoor air intake of the HVAC system, and using a filter with MERV 13 or higher for recirculated air (Government of Canada Citation2021; MDH Citation2021). It is also recommended that the door to the room remain closed to reduce the transmission of SARS-CoV-2 through airflow between rooms (U.S. CDC Citation2021i). Lynch and Goring (Citation2020) introduced practical steps to improve airflow to reduce the infection risk, using strategies adapted from negative-pressure isolation rooms in acute care facilities.
K-12 school
The COVID-19 outbreaks in K-12 schools have been vastly documented around the world (D. Lewis Citation2020b; Otte Im Kampe et al. Citation2020; Pray et al. Citation2020; Stein-Zamir et al. Citation2020). Previous studies indicated that few outbreaks were reported in schools, and most infections reported in children were actually acquired at their homes (ECDC Citation2020; D. Lewis Citation2020b; WHO Citation2020g). Even in school outbreaks, it was more likely that the virus was introduced by the employees (ECDC Citation2020; WHO Citation2020g). Many studies have suggested that children are generally less susceptible and less infectious, and less likely to show severe symptoms than adults, particularly for younger ones (<10 years old) (ECDC Citation2020; Goldstein, Lipsitch, and Cevik Citation2020; Ludvigsson Citation2020; Viner et al. Citation2020; WHO Citation2020g). But recent research suggested that children can spread the emerging variants of SARS-CoV-2 as possibly as adults (D. Lewis Citation2021b). Therefore, although the fatalities among children and adolescents were generally lower than other populations, large outbreaks and severe diseases even deaths will still occur in schools, particularly considering the emergence of variants with higher transmissibility such as the Delta variant (Mallapaty Citation2020; Stein-Zamir et al. Citation2020; Szablewski et al. Citation2020; WHO Citation2020d). Data suggested that 31% of new and ongoing outbreaks in Michigan (MDHHS Citation2020) and 17% of total outbreaks in Colorado (CDPHE Citation2020) were tied to K-12 schools, which makes it another hotspot for virus spreading. But transmissions through other routes (contacts or droplets) cannot be ruled out based on existing data.
Evidence suggests that many K-12 schools that have strictly implemented prevention strategies have been able to safely open for in-person instruction and remain open (U.S. CDC Citation2021j). Previous studies in South Korea (Y. Yoon et al. Citation2020) and Spain (Catala et al. Citation2020) observed no significant increase in COVID-19 infection after schools reopened. Actually, school closure can introduce certain risks and negative impacts to students and their families, such as additional childcare expenses, and loss of access to education (Public Health Ontario Citation2020; United Nations Citation2020; WHO Citation2020g). WHO suggested that school closure should be considered only if there is no other alternative (WHO Citation2020g). Therefore, viral transmission in schools needs to be controlled and minimized to create a healthy and safe environment for students and instructors.
A study on 101 classrooms in 19 public schools in New York City estimated the airborne transmission risk and revealed that the probability of student-to-student transmission is lower than teacher-to-student transmission (Pavilonis et al. Citation2021), which is consistent with the reported situation (ECDC Citation2020; WHO Citation2020g) and other modeling results (J. Shen et al. Citation2021). The high occupant density, long exposure time, and insufficient ventilation are likely the main factors that enhanced the viral transmission through the airborne route. A previous review revealed that most schools did not provide sufficient ventilation in practice (Fisk Citation2017). Poor ventilation in classrooms can elevate the infection risk (Jones et al. Citation2021). Other common areas in schools like cafeterias, dining rooms, and gyms may face high risks as well (J. Shen et al. Citation2021). Therefore, prevention strategies should be strictly implemented in schools. Curtius, Granzin, and Schrod (Citation2021) tested portable air cleaners in a school classroom and suggested that air cleaners can efficiently reduce the airborne transmission risk for SARS-CoV-2. J. Zhang (Citation2020) introduced multiple IAQ control strategies, including source control, ventilation, and disinfection, to reduce the risk of asymptomatic SARS-CoV-2 infections in classrooms. A. K. Melikov, Ai, and Markov (Citation2020) presented an intermittent occupancy strategy combined with ventilation to reduce the airborne transmission risk in classrooms, which can reduce the risk significantly. Rothamer et al. (Citation2020) suggested that viral particles can travel a long distance with the ventilation airflow in the classroom and also recommended using mask fitters to further improve the filtration efficiency of masks. Mask wearing and enhanced ventilation for reducing risk have been highlighted by U.S. CDC (Citation2021j) as well. Besides, it is suggested to move the activities with high exhalation rates (such as singing, shouting, band, or sports and exercise) to larger and well-ventilated spaces or outdoors, when possible (U.S. CDC Citation2021j). The shared common areas, such as cafeterias, are suggested to be closed for communal use (U.S. CDC Citation2021j).
College and university
By the end of 2020, more than 1,800 colleges and universities in the U.S. have recorded over 397,000 COVID-19 confirmed cases, accounting for around 2.4% of the country’s total confirmed cases (W. Cai et al. Citation2020) while students and employees in colleges and universities represent around 7% of the total population in the U.S. (Hussar et al. Citation2020; Univstats Citation2020). But few of these cases have resulted in deaths. Most of the college-related deaths were tied to staff or faculty members (Hubler and Hartocollis Citation2020). Many colleges and universities in the U.S. have reopened their campuses partially, but strict measures were taken to prevent the COVID-19 spreading on campuses, including online teaching, social distancing, mask-wearing requirement, partition installation, and ventilation system upgrading (U.S. CDC Citation2020b).
The strict prevention measures taken in studying areas on campus, such as classrooms, offices, and libraries, were believed to be efficient since the outbreaks that occurred in these spaces were rarely reported (Diep Citation2020). The outbreaks were more frequently reported during off-campus social gatherings, as well as in resident halls and athletic departments, where people were less likely to wear masks or keep physical distancing (Blinder, Higgins, and Guggenheim Citation2020; Diep Citation2020; Hubler and Hartocollis Citation2020; M. Lewis Citation2020; Teran et al. Citation2020; E. Wilson et al. Citation2020). Inadequate ventilation in these dense spaces enhanced cross-contamination through airborne transmission. It is consistent with the simulation result by Gressman and Peck (Citation2020), indicating that the risk through academic contacts (directly tied to classes) is significantly lower than the risk through residential contacts and other large-scale social contacts. J. Shen et al. (Citation2021) also indicated high airborne transmission risk in dining halls, gyms, resident halls, and Greek houses based on simulation, while the risk in studying areas is relatively lower. Therefore, the shared areas like dining halls, lounges, and gyms are suggested to be closed for communal use, if possible. Otherwise, strict prevention strategies should be implemented during gatherings in these scenarios. Masks are always required to wear. Ventilation system upgrades and improvements, e.g. increased outdoor air, elevated air supply, and higher-efficiency filters, are encouraged to increase the delivery of clean air and dilute potential contaminants in campus buildings (U.S. CDC Citation2020b). When the weather conditions allow, windows are suggested to open to introduce more outdoor air, incorporating with the use of fans to improve the effectiveness of opening windows (U.S. CDC Citation2020b). Air cleaning and disinfection strategies are also recommended to be used. When the ventilation is inadequate, the occupants in the room need to be decreased to maintain sufficient ventilation rate per person (U.S. CDC Citation2020b).
Manufacturing facility
The COVID-19 outbreaks in manufacturing facilities have been widely reported across the world, which makes it a hotspot of COVID-19 spreading (BBC News Citation2020a, Citation2020b; Guenther et al. Citation2020; Günther et al. Citation2020; Middleton, Reintjes, and Lopes Citation2020; Platsky et al. Citation2020; Richards and Vassalos Citation2020; Steinberg et al. Citation2020; Stewart, Kottasova, and Khaliq Citation2020; Waltenburg et al. Citation2020). According to the data in U.S., manufacturing facility has become one of the major risks for COVID −19 infection in the country throughout the pandemic (CDPHE Citation2020; IDPH Citation2020; MDHHS Citation2020). Particularly, a great number of outbreaks have been documented in meat processing plants, and some of them have been reported as superspreading events, which could get many hundreds of people infected (Waltenburg et al. Citation2020). For example, an outbreak among employees at a meat processing plant in South Dakota resulted in a total of 929 (25.6%) confirmed COVID-19 cases among 3,635 employees (Steinberg et al. Citation2020). At a meat processing plant in North Carolina, a total of 570 (25.4%) were tested positive among 2,244 employees (Tyson Foods Inc Citation2020). More than half of the 300 workers at a chicken plant in Delaware were confirmed as infected (Sternberg Citation2020). Among 1,216 employees working at a meat processing plant in Nebraska who were tested, 375 (31%) had positive results (Donahue et al. Citation2020). In July 2020, U.S. CDC reported more than 16,000 infections and 86 deaths tied to meat processing plants in U.S. (Waltenburg et al. Citation2020). But those numbers highly underestimated the actual condition since only 28 states provided data. According to the data of the last two weeks in 2020, around 20.8% of the reported cases in Louisiana were related to meat processing plants, which is a scenario with highest infection risk (LDHH Citation2020). But airborne transmission is not the only reason for these superspreading outbreaks as other transmissions cannot be ruled out.
Various reasons have been proposed for the outbreaks in meat processing plants, including the crowded working conditions, the cold working environment, the poor indoor ventilations, workers not wearing masks properly or not at all, and the need for workers to talk loudly over the background noise of machinery (Donaldson Citation2020; Nabarro, Deland, and Lasbennes Citation2020; Stewart, Kottasova, and Khaliq Citation2020). Some studies believed that the frequent use of high-pressure water for brushing the floors and surfaces in meat processing plants would produce large quantities of droplets and aerosols, which may increase the risk of inhalation exposure if the floors and surfaces were contaminated by the virus (Donaldson Citation2020; Nabarro, Deland, and Lasbennes Citation2020). The COVID-19 outbreak in a German meat processing plant provides evidence that transmission occurred likely via airborne route over long distances (over 8 m) in the confined area (Günther et al. Citation2020). The environmental conditions in the meat plant, including low temperature, low air exchange rates, and constant air recirculation, together with the relatively close distance between workers and demanding physical work, likely created an unfavorable mix of factors promoting the efficient aerosol transmission of SARS-CoV-2 particles (Günther et al. Citation2020). It was believed that these factors are also responsible for worldwide ongoing outbreaks in other meat processing facilities (Günther et al. Citation2020). The high attack rate in meat plants was also supported by the modeling of airborne transmission (J. Shen et al. Citation2021).
To prevent the outbreaks in meat processing plants, prevention strategies are necessary, including reducing the occupant density, wearing masks properly, separating workers from each other to maintain social distancing, installing partitions between workers, introducing enhanced cleaning and disinfection strategies, and improving ventilation systems (U.S. CDC Citation2020f).
Retail facilities
Retail facilities usually include various categories, including grocery stores, supermarkets, home improvement retailers, and shopping malls. Many retail facilities, especially supermarkets, were not closed during the pandemic, but most of them shortened the working hours or limited the in-store customer numbers. The high volume and liquidity of in-store customers would make retail facilities vulnerable to COVID-19, particularly for the employees considering their long working time and close contacts with customers (Chang et al. Citation2020). Among 104 employees in a grocery store in Boston, 21 (20.2%) were tested positive, which is higher than the average risk in the community (Lan et al. Citation2020). In Colorado, around 7% of the infection cases were associated with retail facilities, of which most cases are the employees in the retail facilities (CDPHE Citation2020).
The airborne route is a possible route of virus transmission in retail facilities. A cluster of COVID-19 cases in a shopping mall in China was likely associated with the transmission through aerosols (Shao et al. Citation2021). Vuorinen et al. (2020) suggested that the airborne exposure during a supermarket visit even with relatively high customer densities would be quite low, partially due to the short residence time, which is consistent with the reported data (CDPHE Citation2020). However, considering a large number of supermarket visits daily, the number of exposed customers can become significant in large populations. It was also observed that the inhaled virus-carrying aerosols increase rapidly with the residence time in the market. Therefore, for customers, it was recommended to limit the frequency and duration of visiting supermarkets, avoid visits during rush hours, and reduce the time spent at the cashier (Vuorinen et al. 2020). For employees, strict prevention strategies should be implemented to reduce the potential airborne risk.
Healthcare facility
Healthcare workers in healthcare facilities usually face higher COVID-19 exposure through their work since they are more likely to have close contact with the COVID-19 patients. The infection events among healthcare workers have been frequently reported across the world (Khurana et al. Citation2020; Koh Citation2020; Lai et al. Citation2020). Data suggested that over 328,000 healthcare workers in the U.S. have been infected by the end of 2020, accounting for over 17% of nationwide infection cases (U.S. CDC Citation2020a). Due to the significant gaps in data collection, this estimation probably underestimates the actual number of infected healthcare workers. Thus, viral transmission in healthcare facilities requires more attentions and studies. More efficient prevention strategies should be performed to reduce the high attack rate.
Healthcare facilities can be categorized into inpatient and outpatient healthcare facilities, typically including hospitals and various clinics (U.S. EIA Citation2020). Viral RNA has been vastly detected in the air of hospital settings, such as patient rooms, ICUs, restrooms, corridors, and even protective-apparel removal rooms and medical staff’s offices (Binder et al. Citation2020; Chia et al. Citation2020a; Ding et al. Citation2021; B. Feng et al. Citation2021; Z. D. Guo et al. Citation2020; Jiang et al. Citation2020; Jin et al. Citation2021; Kenarkoohi et al. Citation2020; Lednicky et al. Citation2020; Y. Li et al. Citation2020; Moore et al. Citation2021; Razzini et al. Citation2020; Santarpia et al. Citation2020; Stern et al. Citation2021; Tan et al. Citation2020; Zhou et al. Citation2021), and viable viruses were observed in some samples (Lednicky et al. Citation2020; Santarpia et al. Citation2020), indicating strong evidence for supporting the viral transmission through airborne route. The high contaminant concentrations were probably due to the high density of infectors in hospitals and the aerosol-generating procedures for treatment (e.g. intubation), which can generate considerable virus-carrying aerosols. Airborne precautions are recommended for circumstances and settings in which aerosol-generating procedures are performed (WHO Citation2020c). Airborne transmission is also possible to occur in some outpatient facilities, such as dental clinics, although no clear evidence has been reported (Melo et al. Citation2021). Dental procedures, such as the use of drills, saws and high-pressure water sprays, can generate considerable particles within close proximity of the patient, which puts the dentists at high exposure risks (Checchi et al. Citation2021). Masks and air disinfection strategies are suggested to prevent the potential airborne transmission.
Office
The COVID-19 outbreaks in office buildings have been reported across the world (CDPHE Citation2020; Loop News Citation2020; Park et al. Citation2020; Weissberg et al. Citation2020). Data suggested that approximately 7% of the documented outbreaks in Colorado occurred in office scenarios (CDPHE Citation2020). Although the lack of clear evidence, the high attack rate in a call center in South Korea that caused 94 out of 216 employees infected (43.5%), can be partially explained by the transmission through airborne route (Park et al. Citation2020). It served to highlight that being in an enclosed space, sharing the same air for a prolonged period increases the risk of exposure and infection (ASHRAE Citation2021). Therefore, the virus spread in office settings is likely affiliated with the long working hours that employees spend together in the dense and confined space, where social distancing is less likely to maintain, and ventilation may be inadequate. In order to reduce the risk in office settings, enhanced ventilation, such as increased outdoor air, elevated air supply, and high-efficiency filter, are recommended to be implemented. Natural ventilation can further increase the delivery of clean air. Standalone air cleaning technologies like portable air cleaners or upper-room UVGI systems are also suggested. Besides, a staggering shift of working time that can reduce the number of employees in common areas like conference rooms and lounges is probably an efficient administrative control strategy for reducing airborne transmission (U.S. CDC Citation2021f).
Correctional facility
The COVID-19 outbreaks affiliated with correctional facilities have been widely reported across the world, which makes it another key hotspot of COVID-19 spreading (Council of Europe Citation2020; Davlantes et al. Citation2020; Hagan et al. 2020; Njuguna et al. Citation2020; Wallace et al. Citation2020a, Citation2020b). Data in the U.S. revealed that over 433,000 COVID-19 cases have been confirmed in 1,960 correctional facilities across the country by the end of 2020, accounting for approximately 22% of total infection cases in the U.S. (The New York Times Citation2020a; U.S. CDC Citation2020a). But the high attack rate of COVID-19 in correctional facilities cannot be attributed solely to airborne transmission.
The majority (82.4%) of the confirmed cases were the inmates (U.S. CDC Citation2020a) since they were essentially confined together in crowded spaces for a prolonged period. Superspreading COVID-19 outbreaks have been vastly reported in correctional facilities across the world (Swinkels Citation2020). For example, around 10% of inmates and 21% of staff in a correctional facility in Michigan tested positive for COVID-19 in June 2020 (Detroit Free Press Citation2020). Data in Colorado revealed that an average of 123 people can get infected in each outbreak in correctional facilities (CDPHE Citation2020). There is a high risk of rapid transmission in correctional facilities due to high occupant density and turnover, overcrowding, and frequent movements within and between establishments (Beaudry et al. Citation2020). In addition, a high proportion of inmates may be more vulnerable to severe disease due to underlying health conditions and generally older ages (Beaudry et al. Citation2020). A correctional facility typically consists of multiple housing units and common areas. A housing unit usually includes multiple sleeping areas (cells or rooms) and an open dayroom, which is usually contiguous to the sleeping areas and inmates may be admitted to the dayroom for daytime activities such as dining, bathing, and selected recreation or exercise (U.S. NIC Citation2011). The modeling of airborne transmission revealed that multi-resident dormitories and dayrooms can readily spread the disease among inmates (J. Shen et al. Citation2021). Therefore, control strategies like masks, enhanced ventilation, regular cleaning and disinfection, and preventing overcrowding, are required for reducing the infection risk (U.S. CDC Citation2021g).
Hotel
U.S. CDC suggested a high risk staying in hotels or other multi-unit guest lodgings due to the potential contacts with other people (U.S. CDC Citation2020e). However, the COVID-19 outbreaks in hotels have not been frequently reported. It is likely because many consumers have yet to resume traveling due to the ongoing pandemic and relevant traveling restrictions, which had resulted in less than half the occupancy rate in most hotels compared to a normal condition, particularly for hotels in urban areas (AHLA Citation2020).
Viral RNA was detected in the air in an unventilated toilet of a quarantined hotel guest room in China (Ma et al. Citation2020). Besides, a retrospective study (Eichler et al. Citation2021) suggested that aerosols were likely the mode of transmission in a quarantined hotel in New Zealand, and the enclosed and unventilated space in the hotel corridor probably facilitated the spread. Therefore, airborne transmission is a potential route for SARS-CoV-2 spreading in hotels. Except for the guest rooms, the common areas of the hotel, such as the lobby and banquet rooms, are also facing high airborne transmission risk (J. Shen et al. Citation2021). Strict prevention strategies should be implemented in these common areas.
Restaurant and bar
There have been quantities of COVID-19 cases reported in restaurants, bars, or coffee shops (ABC News Citation2020; Y. Li et al. Citation2020; Lu et al. Citation2020; NBC News Citation2020). A study found that people who tested positive for COVID-19 are more likely tied to dining in restaurants, bars, or coffee shops before becoming ill, which suggests higher risks in these places (Fisher et al. Citation2020). Data revealed that 8% of the outbreaks in Colorado (CDPHE Citation2020) were reported in restaurants and bars. Around 19.3% of the COVID-19 outbreaks reported within the last two weeks of 2020 in Louisiana were tied to restaurants or bars, which is the place with the second primary risk in the state (LDHH Citation2020). Therefore, restaurants and bars have become a hotspot of COVID-19 outbreaks. Many restaurants and bars have fully or partially reopened at the current stage. Although prevention measures may have been taken, the dense customers, close contacts, and unabundant ventilation in restaurants and bars will still likely elevate the infection risk, particularly considering that people are unlikely to wear masks when they are dining or drinking. On-site dining with indoor seating has been evaluated as higher and highest risks by U.S. CDC (Citation2021c). Food services like a drive-through, delivery, take-out, and curb-side pick-up, are still preferred.
Airborne transmission has been suspected to be affiliated with the outbreaks in a restaurant in Guangzhou (Y. Li et al. Citation2020) and a bar in Ho Chi Minh City (Chau et al. Citation2021). The insufficient clean air delivery and recirculated contaminated air increased the infection risk through airborne transmission. Masks, ventilation improvements, air cleaning, and disinfection technologies are required to be used in restaurants and bars. Partitions are also suggested to be installed, particularly in areas where it is difficult for individuals to remain at least 2 m apart (U.S. CDC Citation2021c).
Religious place
Places in which people gather for religious activities, such as chapels, churches, mosques, synagogues, and temples, are also facing high risks of COVID-19 spreading. The COVID-19 infection has been widely reported in these places (Conger, Healy, and Tompkins Citation2020; James et al. Citation2020; Lee et al. Citation2020). Around 8% of the COVID-19 outbreaks reported within the last two weeks in 2020 in Louisiana were related to religious places (LDHH Citation2020). The crowded people in the confined religious building with poor ventilation are exposed to high risks, particularly considering the elevated respiratory rates during praying and singing.
Some outbreaks during activities in religious places have been suspected to be associated with the transmission through aerosols. Miller et al. (Citation2020) revealed that the transmission by the aerosol route is likely to occur in the Skagit Valley Chorale superspreading event, as either fomite or droplet-borne transmission could unlikely explain the substantial proportion of the cases in the choir. Katelaris et al. (Citation2021) suggested airborne transmission as the probable route for virus spreading during church singing in a choir in Sydney because some infected individuals seated up to 15 m from the index patient without close physical contact. Therefore, it is encouraged to use masks and intensify cleaning, disinfection, and ventilation in religious places to mitigate the airborne transmission risk (U.S. CDC Citation2021b).
Transportations
A study suggested that transport-based COVID-19 outbreaks are the second dominant category of outbreaks, behind the building-based ones (Qian et al. Citation2020). The outbreaks tied to transportation spaces, such as airplanes, cruise ships, and tour coaches, have been widely reported, particularly at the early stage of pandemic (before traveling restrictions) (ASHRAE Citation2020c; Kasper et al. Citation2020; Khanh et al. Citation2020; Luo et al. Citation2020; Moriarty et al. 2020; Y. Shen et al. Citation2020; Xu et al. Citation2020; S. Zhao et al. Citation2020; R. Zheng et al. Citation2020). A study found that the modes of transportation that keep passengers in the same confined cabin over a long period, such as tour coaches or airplanes, could spread the virus significantly (Sam Schwartz Consulting Citation2020). But in spaces where passengers spend a short period and tend not to talk, such as the mass transit systems, risks are relatively low, as long as the spaces are well-ventilated, and passengers wear masks properly. However, if prevention measures like a mask, social distancing, or enhanced ventilation are not taken, the mass transit systems, such as the subway and bus, will readily spread the virus as well. A study suggested that the mass transit system was a major disseminator of SARS-CoV-2 infection in New York City during the initial takeoff of the pandemic (Harris Citation2020). The major hotspots of transportation reported during the pandemic generally include aircraft, cruise ships, buses (e.g. transit buses, tour coaches, and school buses), subways, and cars.
Airborne transmission of the virus is less likely to occur on aircraft, considering the high ventilation rate and high-efficiency filters for recirculating air (Gupta, Lin, and Chen Citation2012). According to a survey on aircraft HVAC systems, the typical air exchange rate in the aircraft cabin during cruising is approximately between 20 and 25 h−1 (National Research Council Citation2002). For most modern aircraft, the air passes through HEPA filters before reentering the passenger cabin (WHO Citation2020a), which can remove at least 99.9% of particles (ASHRAE Citation2017). However, if the airflow is not well organized, the air in the aircraft cabin can be greatly mixed, which may cause cross-contamination and increase the exposure risk, particularly considering the high passenger density in the cabin (Gupta, Lin, and Chen Citation2012; Poussou et al. Citation2010). Therefore, airborne transmission is still a potential route for SARS-CoV-2 spreading on aircraft. For example, transmission through aerosols was likely occurred in the business class area during a long-haul flight to Vietnam, where seats are already more widely spaced than in economy class, and infection spread much further than the 2-row or 2-meter rule recommended for COVID-19 prevention (Khanh et al. Citation2020). Studies suggested that optimized ventilation systems, such as displacement ventilation, personal ventilation, and local air exhaust, can efficiently reduce the potential exposure risk in the cabin (Dygert and Dang Citation2012; You et al. Citation2019). Masks are always required for better protection. In addition to aircraft cabins, air traveling passengers also need to spend considerable time in security lines and airport terminals during stops or layovers, which may bring passengers in close contact with other people. This may elevate the risk during air travel. Viral RNA was detected in the air of some airports (U.S. CDC Citation2021j). Therefore, it is recommended to take flights with the fewest stops or layovers, if possible (U.S. CDC Citation2021l).
Cruise ships were a hotspot of COVID-19 outbreaks in the early days of the pandemic. The outbreaks on the Diamond Princess cruise ship and the Grand Princess cruise ship caused more than 800 people infected in total (Moriarty et al. 2020). It is believed that cruise ships bring diverse populations into proximity for many days, facilitating the transmission of SARS-CoV-2. The gatherings in common areas on the cruise ship, such as bistros, cafeterias, ballrooms, casinos, and theaters (Princess Cruises Citation2020), may exacerbate the viral transmission among the passengers (Xu et al. Citation2021). A study revealed that aerosol inhalation was likely the dominant contributor to viral transmission on the Diamond Princess cruise ship, even considering a conservative assumption of high ventilation rates and no air recirculation for the cruise ship (Azimi et al. Citation2021). The higher-than-expected virus spread into cabins without previously confirmed cases during the quarantine period on the Diamond Princess cruise ship can be explained by the airborne transmission through the ventilation system (Almilaji and Thomas Citation2020), although another study suggested that the central ventilation system of cabins did not assist in virus transmission between cabins during the quarantine period as no cross-room transmission observed and most infections occurred before quarantine (Xu et al. Citation2021). Considering the high infection risk on cruise ships, it is recommended that all people should avoid travel on cruise ships, including river cruises, worldwide (U.S. CDC Citation2021o). Intervention in common areas on cruise ships, such as enhanced ventilation, is required for mitigating infection risks.
Airborne transmission can likely explain the markedly high attack rate of COVID-19 on the buses (tour coach and minibus) in Hunan (Luo et al. Citation2020) and Zhejiang (Y. Shen et al. Citation2020) in China. Besides, viral RNA was tested in airborne aerosols collected from transit buses (Hadei et al. Citation2021; Moreno et al. Citation2021). Therefore, the passengers on the buses, including tour coaches, transit buses, and school buses, may face a certain risk of exposure to the virus. Generally, a tour coach likely has a higher risk due to the long traveling time, while a transit bus and a school bus have a relatively lower risk because of the typically shorter commuting time (J. Shen et al. Citation2021). Enhanced ventilation is suggested on the buses as it can greatly reduce the risk (Moreno et al. Citation2021). Air supply mode plays an important role in airflow pattern and virus-carrying particle dispersion in the bus (Yang et al. Citation2020). Backward supplied air is more suggested for reducing the transmission of viral droplets (Yang et al. Citation2020). Windows can be open to improve the in-cabin ventilation when the weather conditions allow (U.S. CDC Citation2021j), although its benefit does not uniformly impact all passengers on the bus (depending on the exact airflow patterns) (Z. Zhang et al. Citation2021). Masks are always recommended when using public transit. Passengers are not suggested to sit at nonadjacent seats (Yang et al. Citation2020). Besides, passengers should avoid eating or drinking on public transit as it requires people to remove their masks for a while (U.S. CDC Citation2021k). In addition, people are suggested to reduce the frequency of using public transit like buses.
Airborne viral RNA was detected in both subway stations and trains (U.S. CDC Citation2021j). However, airborne transmission is less likely to occur on subway trains because the ventilation system can usually supply considerable clean air to the passengers (J. Shen and Gao Citation2019) and people typically spend a short commuting time on subway trains. But the air mixing in the train may result in cross-contamination and increase the exposure risk. Passengers should avoid taking public transits and always ensure mask use during the entire trip.
Travels on personal cars, taxis, and rideshares can have a high exposure risk to SARS-CoV-2 due to airborne transmission. Infectious virus was detected in airborne particles of the size range of 0.25 to 0.5 µm in a car driven by a COVID-19 patient (Lednicky et al. Citation2021). The compact space of the car cabin with dense passengers can contaminate and mix the air easily. The passengers can be exposed to highly contaminated air. Therefore, masks are necessary for reducing exposure. It is also suggested to improve the ventilation in the vehicle if possible, e.g. opening the windows or setting the air conditioning on non-recirculation mode (U.S. CDC Citation2021k). The best configuration is to have all windows fully open if possible. If this is not practical, it would be good to have two windows open, preferably one in the rear and one in the front (Mathai et al. Citation2021). The transmission through aerosols in surface parking lots is likely very low as they are outdoor environments unless close contact with the infected person exists. But the airborne transmission is likely to happen in underground parking spaces equipped with jet fans (Nazari et al. Citation2021). The areas closer to the fresh air supplier are safer than other areas. Equipping UVGI systems and HEPA filters inside the jet fans can eliminate the viruses.
The above analysis of the outbreaks in different indoor scenarios shows that airborne transmission has likely played a major role. The infection risk due to airborne transmission in various scenarios depends on the occupancy characteristics, room configurations, ventilation settings, air distributions, and interventions. Interventions that reduce airborne transmission would be effective in reducing the infection risk. Indoor ventilation is a key factor impacting infection risk. The vastly used indoor ventilation design guideline, ASHRAE 62.1 (Citation2019), regulates the minimum ventilation rates of different building settings based on the estimation of required ventilation per person and floor area. Therefore, when ASHRAE standard 62.1 is used, it penalizes smaller rooms so that high occupant density per floor area means less ventilation comparing to larger rooms (with the same occupants). shows the total ventilation rate per person estimated from ASHRAE 62.1 in typical scenarios with different occupant densities (J. Shen et al. Citation2021). Ventilation delivered to each person in scenarios with higher occupant density is generally lower than the ventilation in scenarios with lower occupant density. Therefore, the ventilation designed based on ASHRAE 62.1 may not always be sufficient for occupants, particularly considering the requirements for mitigating the infection risk of SARS-CoV-2. To address this issue, a pathogen-source-based or health-based design criteria for indoor ventilation is probably more applicable for infection prevention. More efforts are required for indoor ventilation design to protect against infection transmission (Morawska et al. Citation2021).
Fig. 3. Relationship between occupant density and designed total ventilation rate per person in different scenarios based on ASHRAE 62.1 (data adapted from J. Shen et al. (Citation2021)).
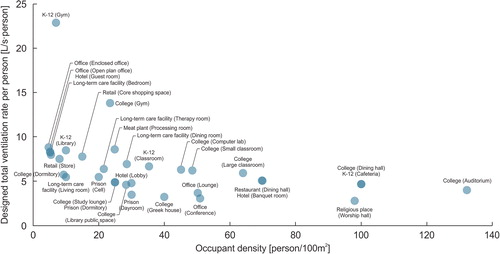
Model for estimating the risk of airborne transmission
Estimating the risk of airborne transmission in indoor environments is essential for designing control strategies to reduce the risk. The most commonly used model for estimating the airborne transmission risk in a confined space is the Wells-Riley model, which assumes the air in the space is well-mixed in steady-state (E. C. Riley, Murphy, and Riley Citation1978; Wells Citation1955). The model has also been extended by some researchers to include unsteady exposure (Gammaitoni and Nucci Citation1997) and imperfect mixing (Ko et al. Citation2001, Ko, Thompson, and Nardell Citation2004), and incorporate with stochastic modeling (Noakes and Sleigh Citation2009). The infection risk determined by the Wells-Riley model depends on the susceptible individual’s inhalation exposure to the suspended pathogen generated by the infectors (Stephens Citation2013; Sze To and Chao Citation2010).
The model has been widely adopted to estimate the airborne transmission risk of many respiratory diseases, such as influenza, tuberculosis, severe acute respiratory syndrome (SARS-CoV-1), middle east respiratory syndrome (MERS), and measles (S. C. Chen and Liao Citation2008; Qian et al. Citation2009; Stephens Citation2013; Yates et al. Citation2016; Zemouri et al. Citation2020). Recent studies also applied the Wells-Riley model in estimating the airborne transmission risk of SARS-CoV-2 in indoor environments. For example, Dai and Zhao (Citation2020b) used the model to estimate the required ventilation rate in four typical scenarios ensuring a less than 1% infection probability. Harrichandra, Ierardi, and Pavilonis (Citation2020) estimated the airborne SARS-CoV-2 infection transmission risk in New York City nail salons using the Wells-Riley model and evaluated the impacts of wearing face masks on the risk. J. Shen et al. (Citation2021) applied the model in evaluating the risk in 18 scenarios with typical settings and observed that long-term care facilities, colleges, meat plants, hotels, restaurants, casinos, and cruise ships have higher infection risks. Pavilonis et al. (Citation2021) estimated the aerosol transmission risk of SARS-CoV-2 in New York City public schools during the reopening and revealed that the risk of transmission is higher during the heating season and in newer buildings. Stabile et al. (Citation2021) estimated the airborne transmission risk in schools and proposed a novel feedback control strategy using carbon dioxide concentrations to monitor and adjust the ventilation procedure for minimizing the airborne transmission. Peng and Jimenez Citation2021) developed the original model and derived analytical expressions of CO2-based risk proxies for estimating COVID-19 infection risks, and applied them to various typical indoor environments.
The Wells-Riley model estimates the risk with the well-mixing assumption. However, the air in indoor environments is typically imperfectly mixed. Close contact with the infected persons can typically inhale more virus-carrying aerosols, while a longer distance from the infectors can likely decrease the exposure due to the dilution by the ventilation and the deposition and natural inactivation of the viral particles. But the air recirculation in space can take the virus-laden aerosols to farther locations (Y. Li et al. Citation2020). Therefore, the airflow patterns in the space, as well as the locations of the infected and susceptible subjects, can significantly impact the spatial distribution of viruses. To address the spatial distribution of exposure risk, the rebreathed fraction can be incorporated in the Wells-Riley model, which is the fraction of inhaled air that was exhaled by the infector (Rudnick and Milton Citation2003). A similar approach was also conducted by other researchers for estimating the infection risk of COVID-19 (J. Shen et al. Citation2021; Sun and Zhai Citation2020). When the quantity of exhaled aerosols generated by the infectors and inhaled by a susceptible person in a particular spatial location is known, the susceptible person’s exposure risk can be estimated based on the Wells-Riley model (Sze To and Chao Citation2010). It can be done by conducting the tracer gas measurements. Some other studies performed CFD simulations to figure out the spatial concentration distribution of viruses and incorporated them with the Wells-Riley model to estimate the spatial exposure risk distribution in the space (Gao et al. Citation2008; Qian et al. Citation2009; Tung and Hu Citation2008). CFD simulations have been performed in scenarios like restaurant, classroom, grocery store, bus, car, elevator, hospital ward, and underground parking space for estimating the spatial risk distribution of SARS-CoV-2 (Dbouk and Drikakis Citation2021; Y. Guo et al. Citation2021; Y. Li et al. Citation2020; H. Liu et al. Citation2021; Mathai et al. Citation2021; Nazari et al. Citation2021; Shao et al. Citation2021; Yang et al. Citation2020; Z. Zhang et al. Citation2021).
Wells-Riley model
The Wells-Riley model is a classical model for estimating the steady-state infection risk through airborne transmission in the perfectly mixed space (E. C. Riley, Murphy, and Riley Citation1978; Wells Citation1955). The infection possibility (P), which can be used to estimate the new infection cases (NC) based on the susceptible cases (NS), is calculated as a function of the inhalation exposure dose (E. C. Riley, Murphy, and Riley Citation1978), which depends on the number of infectors (I), the emission rate of infectious quanta per infector (ER), the fraction of infectious particle penetration through the face mask (R), inhalation rate (IR), exposure time (t) and the room ventilation rate with clean air (Q):
(2)
(2)
One quantum in the model represents an infectious dose that would infect 63% of the population with the exposure per the Wells-Riley model (E. C. Riley, Murphy, and Riley Citation1978). It describes the number of infectious particles in a way that implicitly includes both the number and the infectivity of virus particles (which also inherently captures particle size effects and probability of deposition in appropriate regions of the respiratory system) (Stephens Citation2012). The quanta emission rate has a unit of quanta per hour (h−1), and the magnitude relies on disease species, infector activities (e.g. breathing, coughing) and interventions, and may vary significantly case by case (Buonanno, Stabile, and Morawska Citation2020; Stephens Citation2012).
The quanta emission rate can be estimated based on the viral load in the mouth of the infected person (Buonanno, Stabile, and Morawska Citation2020), which can be calculated through EquationEquation 1(1)
(1) . Another approach to estimating the quanta generation rate is through the retrospective analysis of real outbreak events. The quanta generation rate can be backward calculated when the attack rate, occupant activities, room configurations, and ventilation settings of the studies outbreak are known. In addition, statistical analysis was performed to estimate the quanta generation rate of SARS-CoV-2 based on the statistical relationship between the basic reproduction number (R0) and ER of other respiratory diseases. The estimated quanta generation rates of SARS-CoV-2 using different approaches in previous studies are listed in .
Table 4. Quanta emission rates (ER) of SARS-CoV-2 particles in different studies.
The room ventilation rate with clean air in the Wells-Riley model indicates the total fresh/virus-free air delivered to the room, including the outdoor air and filtrated/disinfected recirculated air of the ventilation system, the outdoor air supplied through natural ventilation, the clean air supplied by the portable air cleaners, the virus-laden particle removal through UVGI systems, deposition and natural inactivation. The outdoor air is clean and safe for indoor ventilation, except when strong emission sources exist outdoors (Setti et al. Citation2020b).
Available Wells-Riley model-based tools for estimating the airborne risk of COVID-19
Multiple tools for estimating the airborne infection risk of COVID-19 have been developed based on the Wells-Riley model. For example, Kasibhatla et al. (Citation2020) developed a Web-based tool COVID Exposure Modeler for estimating the COVID-19 infection risk from airborne transmission during classroom teaching incorporating a Monte Carlo approach. Allen, Cedeno-Laurent, and Miller (Citation2020) developed a Google sheet to calculate the risk reduction by using portable air cleaners. Corsi, Van Den Wymelenberg, and Parhizkar (Citation2020) established a Web-based platform named SafeAirSpaces COVID-19 Aerosol Relative Risk Estimator for evaluating the airborne infection risk and tracking the infectious particles. Dols et al. (Citation2020) and William et al. (Citation2020) developed a Web-based tool Fate and Transport of Indoor Microbiological Aerosols (FaTIMA), which allows for the determination of the indoor fate of microbiological aerosols associated with ventilation, filtration, deposition, and inactivation mechanisms. Riediker and Monn (Citation2020) built a spreadsheet tool Indoor Scenario Simulator to estimate the virus concentration in the room and the inhaled dose of other people in the same room. REHVA (Citation2020) developed a spreadsheet tool COVID-19 Ventilation Calculator to estimate the effect of ventilation on COVID-19 airborne transmission. Jimenez and Peng (Citation2020) established a COVID-19 Aerosol Transmission Estimator on Google sheet and evaluated the infection risks in typical indoor scenarios including classrooms, supermarkets, and stadiums. Bazant (Citation2021) developed a Web-based application COVID-19 Indoor Safety Guideline that can estimate the infection risk using the Wells-Riley model and indicate the safe level of occupancy or duration time based on the input configurations. It can also assess the risk based on indoor carbon dioxide concentrations. J. Shen et al. (Citation2021) developed a spreadsheet-based calculator for estimating the infection risk in several space types including ballrooms, conference rooms, bistro/cafeteria, hotel guest rooms, offices, and classrooms. Both steady-state and stochastic simulations can be performed with the calculator to evaluate the effectiveness of various mitigation strategies in reducing the infection risks from baseline conditions established by ASHRAE 62.1 (Citation2019).
Mitigation strategies on airborne transmission
Public health agencies have introduced multiple control strategies for mitigating the airborne transmission risk of COVID-19 in their guidelines (ASHRAE Citation2020a; Osha n.d.; REHVA Citation2021; U.S. CDC Citation2021h; U.S. EPA Citation2020; WHO Citation2021b). A recent review introduced and compared the HVAC operating guidelines in different countries during the pandemic (M. Guo et al. Citation2021). Many researchers also presented different IAQ control strategies (Bazant and Bush Citation2021; A. K. Melikov, Ai, and Markov (Citation2020; Lidia Morawska et al. 2020; J. Shen et al. Citation2021; J. Zhang Citation2020). The IAQ control strategies across multiple scales (from a whole building to rooms, and to personal microenvironments and breathing zone) can be generally divided into three categories, i.e. source control, ventilation, and air cleaning. The commonly used strategies in indoor environments for reducing the infection risk through airborne transmission typically include masks (Brooks et al. Citation2021; Cook Citation2020; A. Davies et al. Citation2013; Liao et al. Citation2021; CitationTabatabaeizadeh 2021; Ueki et al. Citation2020), improved ventilation, and air distribution (Ahlawat et al. Citation2020; Almilaji and Thomas Citation2020; Blocken et al. Citation2021; Borro et al. Citation2021; CDPH Citation2020; Correia et al. Citation2020; Dai and Zhao Citation2020a; Dillon and Sextro Citation2020; Dygert and Dang Citation2012; Masotti et al. Citation2021; Lidia Morawska et al. 2021; Stabile et al. Citation2021; Sun and Zhai Citation2020), standalone air cleaners and upper-room UVGI systems (Beggs and Avital Citation2020; Blocken et al. Citation2021; Z. Feng et al. Citation2021; He et al. Citation2021; Ko, First, and Burge Citation2002; Xu et al. Citation2003), and occupancy control and restriction (Bazant et al. Citation2021; A. K. Melikov, Ai, and Markov (Citation2020; Sun and Zhai Citation2020). Detailed reviews of mitigation strategies can be found in several published papers (M. Guo et al. Citation2021; Kong et al. Citation2020; J. Shen et al. Citation2021; S. Tang et al. Citation2020; J. Zhang Citation2020). However, most available studies only discussed the performance of mitigation strategies on reducing infection risks but did not consider other factors that can likely affect the use of mitigation strategies in practice, such as cost, durability, and accessibility. A review of both benefits and costs of control strategies can help design the control strategies in indoor environments.
The effectiveness and costs of various control strategies can vary greatly on different scales. A medical mask can typically protect the susceptible person effectively by reducing the inhalation of virus-carrying aerosols by around 50% with a very low cost (around US$0.2 per mask). However, long-term use of masks can still be costly to sustain since medical masks are disposable. Upgrading filters in the HVAC system can benefit lots of occupants in multiple rooms. A HEPA filter can generally remove over 99.9% particles for the recirculated air of the building ventilation system, but it is also relatively expensive to purchase one (typically US$280 per filter). However, considering the amount of benefited people and the long duration of the filter (typically 6–12 months), the general cost of using HEPA filters in the ventilation system is actually not so high. But upgrading building ventilation filters cannot completely avoid airborne transmission in short distances while wearing masks can efficiently reduce the exposure to aerosols in short distances as masks can protect people’s breathing zone. Therefore, both benefits and costs should be considered in designing the control strategies for a specific scenario. J. Shen et al. (Citation2021) quantitatively analyzed the effectiveness and costs of some IAQ control strategies in mitigating the airborne transmission risks of COVID-19. Besides, the accessibility of strategy should also be considered. Some strategies like cloth masks are relatively easy to access and can even be homemade using household materials during the shortages of masks (A. Davies et al. Citation2013), which makes it a strategy that can be applied widely. For PPE, the comfort of wearing, which can be quantified by the pressure drop across the PPE material (A. Davies et al. Citation2013; M. Zhao et al. Citation2020), should also be considered as it may also impact the use of PPE among the population. Some other control strategies may require professional designs before being implemented to maximize the potential of risk mitigation, e.g. displacement ventilation, personal ventilation, and local air exhaust. Inappropriate ventilation may even elevate risk (Y. Li et al. Citation2020; Shao et al. Citation2021). Another example is the implementation of the upper-room UVGI system. A well-designed upper-room UVGI system can typically provide an equivalent 6.7 to 33 air changes per hour to the room, depending on its operating conditions and circumstance (R. Riley and Nardell Citation1989; U.S. CDC and NIOSH Citation2009; Xu et al. Citation2003). But the performance of virus inactivation by the upper-room UVGI system also relies on the room air distribution. Displacement ventilation may reduce the efficiency (around 78% of the efficiency incorporating with mixing ventilation (Kanaan and Abou Moughlbay Citation2018)) as it decreases the residence time of the virus in the irradiated zone. Besides, the accessibility of some control strategies may vary at different stages of the pandemic. U.S. CDC defined three different strategies for PPE usage guidance, i.e. conventional, contingency, and crisis strategies, for different PPE supply capacity situations (U.S. CDC Citation2021d). If PPE supply shortages are anticipated or exist, medical-grade PPE like surgical and N95 masks should be reserved for healthcare workers (U.S. CDC Citation2020c). NIOSH (Citation2015) defined the hierarchy of controls for eliminating the exposure to occupational hazards, such as respiratory pathogen, which has been used as a means of determining how to implement feasible and effective control solutions.
Some intervention strategies for mitigating airborne transmission in different scenarios have been introduced in “Outbreaks in different scenarios and the role of airborne transmission” section. This section reviewed some widely used control strategies considering their benefits and costs, including the effectiveness of risk reduction, effective scale, capital cost, durability, and accessibility (). It aims to help select the best control strategies (both reliable and affordable) in different scenarios.
Table 5. IAQ control strategies for mitigating the risk of airborne transmission.
Summary of major findings
There has been substantial evidence supporting the airborne transmission of SARS-CoV-2, including the viable virus-laden aerosols detected in the air and the supports from retrospective analyses on actual outbreaks. In many outbreak events, the airborne route has been considered the predominant route for virus transmission. The viral loads in the respiratory tract are related to the emission rate of pathogens through respiratory activities. The viral load in the mouth of COVID-19 patients is typically below 109 RNA copies/mL. The majority (typically 80–90%) of particles expelled during various human activities are smaller than 1–2 µm in diameter. However, considering that droplets in smaller diameters may contain less virus due to the smaller particle volume, larger expelled particles usually contain more viral RNA. The typical inactivation rate of viable SARS-CoV-2 aerosols at typical indoor temperature (20–23 °C) and relative humidity (30–70%) without sunlight is generally between 0 and 1 h−1, while sunlight can contribute greatly to the inactivation of the viability of SARS-CoV-2 (>7 h−1 and >18 h−1 under low- and high-intensity sunlight). The majority of outbreaks reported in indoor scenarios were related to long-term care facilities, K-12 schools, restaurants and bars, retail facilities, and offices. The outbreaks in correctional facilities, colleges and universities, long-term care facilities, and transportations typically infected more people according to the reported data. Indoor ventilation is a key factor impacting infection risk. A pathogen-source-based or health-based design criteria for indoor ventilation is probably more applicable to protect against infection transmission. More efforts regarding the indoor ventilation design criteria can be conducted in the future. Besides, both benefits and costs should be considered in designing the control strategies for mitigating infection risk, including PPE, ventilation strategies, partitions, air cleaning and disinfection technologies, and occupancy control strategies.
Acknowledgments
This research was jointly sponsored by Carrier Corporation and Syracuse University.
Disclosure statement
The authors of this paper certify that they have no affiliations with or involvement in any organization or entity with any financial or non-financial interest in the subject matter or materials discussed in this manuscript.
Data availability statement
The data that support the findings of this study are available from the corresponding author upon reasonable request.
References
- ABC News. 2020. Restaurants linked to less than 4% of COVID-19 outbreaks in businesses despite outdoor dining suspension.
- Aghalari, Z., H.-U. Dahms, J. E. Sosa-Hernandez, M. A. Oyervides-Muñoz, and R. Parra-Saldívar. 2021. Evaluation of SARS-COV-2 transmission through indoor air in hospitals and prevention methods: A systematic review. Environmental Research 195:110841. doi:https://doi.org/10.1016/j.envres.2021.110841
- AHLA. 2020. State of the hotel industry analysis: Covid-19 six months later.
- Ahlawat, A., S. K. Mishra, J. W. Birks, F. Costabile, and A. Wiedensohler. 2020. Preventing airborne transmission of sars-cov-2 in hospitals and nursing homes. International Journal of Environmental Research and Public Health 17 (22):8553. doi:https://doi.org/10.3390/ijerph17228553
- Allen, J. G., J. Cedeno-Laurent, and S. Miller. 2020. Harvard-CU boulder portable air cleaner calculator for schools.v1.2.
- Almilaji, O., and P. Thomas. 2020. Air recirculation role in the infection with COVID-19, lessons learned from Diamond Princess Cruise ship. MedRxiv 2020.07.08.20148775.
- Anderson, D. C., T. Grey, S. Kennelly, and D. O'Neill. 2020. Nursing home design and COVID-19: Balancing infection control, quality of life, and resilience. Journal of the American Medical Directors Association 21 (11):1519–24. doi:https://doi.org/10.1016/j.jamda.2020.09.005
- Anderson, E. L., P. Turnham, J. R. Griffin, and C. C. Clarke. 2020. Consideration of the Aerosol Transmission for COVID‐19 and Public Health. Risk Analysis 40 (5):902–7. doi:https://doi.org/10.1111/risa.13500
- ASHRAE. 2017. ASHRAE 52.2 method of testing general ventilation air-cleaning devices for removal efficiency by particle size.
- ASHRAE. 2019. ASHRAE Standard 62.1-2019, ventilation for acceptable indoor air quality.
- ASHRAE. 2020a. Filtration/disinfection.
- ASHRAE. 2020b. Pandemic COVID-19 and airborne transmission.
- ASHRAE. 2020c. Transportation.
- ASHRAE. 2021. Commercial.
- Azimi, P., Z. Keshavarz, J. G. Cedeno Laurent, B. Stephens, and J. G. Allen. 2021. Mechanistic transmission modeling of COVID-19 on the Diamond Princess Cruise ship demonstrates the importance of aerosol transmission. Proceedings of the National Academy of Sciences 118 (8):e2015482118. doi:https://doi.org/10.1073/pnas.2015482118
- Azuma, K., U. Yanagi, N. Kagi, H. Kim, M. Ogata, and M. Hayashi. 2020. Environmental factors involved in SARS-CoV-2 transmission: Effect and role of indoor environmental quality in the strategy for COVID-19 infection control. Environmental Health and Preventive Medicine 25 (1):66. doi:https://doi.org/10.1186/s12199-020-00904-2
- Bazant, M. Z. 2021. Covid-19 indoor safety guideline.
- Bazant, M. Z., and J. W. M. Bush. 2021. A guideline to limit indoor airborne transmission of COVID-19. Proceedings of the National Academy of Sciences 118 (17):e2018995118. doi:https://doi.org/10.1073/pnas.2018995118
- Bazant, M. Z., O. Kodio, A. E. Cohen, K. Khan, Z. Gu, and J. W. M. Bush. 2021. Monitoring carbon dioxide to quantify the risk of indoor airborne transmission of COVID-19. MedRxiv 2021.04.04.21254903.
- BBC News. 2020a. 2 Sisters Anglesey: 158 factory staff have coronavirus.
- BBC News. 2020b. Coronavirus: Hundreds of abattoir workers test positive in Germany.
- Beaudry, G., S. Zhong, D. Whiting, B. Javid, J. Frater, and S. Fazel. 2020. November 16. Managing outbreaks of highly contagious diseases in prisons: A systematic review. BMJ Global Health 5 (11):e003201. doi:https://doi.org/10.1136/bmjgh-2020-003201
- Beggs, C. B., and E. J. Avital. 2020. Upper-room ultraviolet air disinfection might help to reduce COVID-19 transmission in buildings: A feasibility study. PeerJ. 8:e10196. doi:https://doi.org/10.7717/peerj.10196
- Binder, R. A., N. A. Alarja, E. R. Robie, K. E. Kochek, L. Xiu, L. Rocha-Melogno, A. Abdelgadir, S. V. Goli, A. S. Farrell, K. K. Coleman, et al. 2020. Environmental and aerosolized severe acute respiratory syndrome coronavirus 2 among hospitalized coronavirus disease 2019 patients. The Journal of Infectious Diseases 222 (11):1798–806. doi:https://doi.org/10.1093/infdis/jiaa575
- Blinder, A., L. Higgins, and B. Guggenheim. 2020. College sports has reported at least 6,629 virus cases.
- Blocken, B., T. van Druenen, A. Ricci, L. Kang, T. van Hooff, P. Qin, L. Xia, C. A. Ruiz, J. H. Arts, J. F. L. Diepens, et al. 2021. Ventilation and air cleaning to limit aerosol particle concentrations in a gym during the COVID-19 pandemic. Building and Environment 193:107659. doi:https://doi.org/10.1016/j.buildenv.2021.107659
- Borro, L., L. Mazzei, M. Raponi, P. Piscitelli, A. Miani, and A. Secinaro. 2021. The role of air conditioning in the diffusion of Sars-CoV-2 in indoor environments: A first computational fluid dynamic model, based on investigations performed at the Vatican State Children’s hospital. Environmental Research 193:110343. doi:https://doi.org/10.1016/j.envres.2020.110343
- Brooks, J. T., D. H. Beezhold, J. D. Noti, J. P. Coyle, R. C. Derk, F. M. Blachere, and W. G. Lindsley. 2021. Maximizing fit for cloth and medical procedure masks to improve performance and reduce SARS-CoV-2 transmission and exposure, 2021. MMWR. Morbidity and Mortality Weekly Report 70 (7):254–7. doi:https://doi.org/10.15585/mmwr.mm7007e1
- Bulfone, T. C., M. Malekinejad, G. W. Rutherford, and N. Razani. 2021. Outdoor transmission of SARS-CoV-2 and other respiratory viruses: A systematic review. The Journal of Infectious Diseases 223 (4):550–61. doi:https://doi.org/10.1093/infdis/jiaa742
- Buonanno, G., L. Morawska, and L. Stabile. 2020. Quantitative assessment of the risk of airborne transmission of SARS-CoV-2 infection: Prospective and retrospective applications. Environment International 145:106112. doi:https://doi.org/10.1016/j.envint.2020.106112
- Buonanno, G., L. Stabile, and L. Morawska. 2020. Estimation of airborne viral emission: Quanta emission rate of SARS-CoV-2 for infection risk assessment. Environment International 141:105794. doi:https://doi.org/10.1016/j.envint.2020.105794
- Cai, J., W. Sun, J. Huang, M. Gamber, J. Wu, and G. He. 2020. Indirect virus transmission in cluster of COVID-19 cases, Wenzhou, China, 2020. Emerging Infectious Diseases 26 (6):1343–5. doi:https://doi.org/10.3201/eid2606.200412
- Cai, W., D. Ivory, K. Semple, M. Smith, A. Lemonides, L. Higgins, and A. Hassan. 2020. Tracking the Coronavirus at U.S. Colleges and Universities.
- Catala, M., P.-J. Cardona, C. Prats, S. Alonso, E. Alvarez, M. Marchena, D. Conesa, and D. Lopez. 2020. Analysis and prediction of COVID-19 for EU-EFTA-UK and other countries.
- CDPH. 2020. The role of building ventilation and filtration in reducing risk of airborne viral transmission in schools, illustrated with SARS-COV-2.
- CDPHE. 2020. Outbreak data | Colorado COVID-19 Updates.
- Chang, S., E. Pierson, P. W. Koh, J. Gerardin, B. Redbird, D. Grusky, and J. Leskovec. 2020. Mobility network models of COVID-19 explain inequities and inform reopening. Nature 589:82–7.
- Chao, C. Y. H., M. P. Wan, L. Morawska, G. R. Johnson, Z. D. Ristovski, M. Hargreaves, K. Mengersen, S. Corbett, Y. Li, X. Xie, et al. 2009. Characterization of expiration air jets and droplet size distributions immediately at the mouth opening. Journal of Aerosol Science 40 (2):122–33. doi:https://doi.org/10.1016/j.jaerosci.2008.10.003
- Chau, N. V. V., N. T. T. Hong, N. M. Ngoc, T. T. Thanh, P. N. Q. Khanh, L. A. Nguyet, L. N. T. Nhu, N. T. H. Ny, D. N. H. Man, V. T. T. Hang, et al. 2021. Superspreading event of SARS-CoV-2 infection at a bar, Ho Chi Minh city, Vietnam. Emerging Infectious Diseases 27 (1):310–4. doi:https://doi.org/10.3201/eid2701.203480
- Checchi, V., P. Bellini, D. Bencivenni, and U. Consolo. 2021. COVID-19 dentistry-related aspects: A literature overview. International Dental Journal 71 (1):21–6. doi:https://doi.org/10.1111/idj.12601
- Chen, L., G. Ban, E. Long, G. Kalonji, Z. Cheng, L. Zhang, and S. Guo. 2021. Estimation of the SARS-CoV-2 transmission probability in confined traffic space and evaluation of the mitigation strategies. Environmental Science and Pollution Research 28:42204–16.
- Chen, Q., and L. Glicksman. 2003. System performance evaluation and design guidelines for displacement ventilation. Atlanta, GA: American Society of Heating, Refrigerating and Air-Conditioning Engineers.
- Chen, S. C., and C. M. Liao. 2008. Modelling control measures to reduce the impact of pandemic influenza among schoolchildren. Epidemiology and Infection 136 (8):1035–45. doi:https://doi.org/10.1017/S0950268807009284
- Cheng, V. C. C., S. C. Wong, V. W. M. Chan, S. Y. C. So, J. H. K. Chen, C. C. Y. Yip, K. H. Chan, H. Chu, T. W. H. Chung, S. Sridhar, et al. 2020a. Air and environmental sampling for SARS-CoV-2 around hospitalized patients with coronavirus disease 2019 (COVID-19). Infection Control & Hospital Epidemiology 41 (11):1258–65. doi:https://doi.org/10.1017/ice.2020.282
- Cheng, V. C. C., S. C. Wong, J. H. K. Chen, C. C. Y. Yip, V. W. M. Chuang, O. T. Y. Tsang, S. Sridhar, J. F. W. Chan, P. L. Ho, and K. Y. Yuen. 2020b. Escalating infection control response to the rapidly evolving epidemiology of the coronavirus disease 2019 (COVID-19) due to SARS-CoV-2 in Hong Kong. Infection Control & Hospital Epidemiology 41 (5):493–8. doi:https://doi.org/10.1017/ice.2020.58
- Chia, P. Y., K. K. Coleman, Y. K. Tan, S. W. X. Ong, M. Gum, S. K. Lau, S. Sutjipto, P. H. Lee, T. T. Son, B. E. Young, et al. 2020a. Detection of air and surface contamination by severe acute respiratory syndrome Coronavirus 2 (SARS-CoV-2) in hospital rooms of infected patients. MedRxiv.
- Chia, P. Y., K. K. Coleman, Y. K. Tan, S. W. X. Ong, M. Gum, S. K. Lau, X. F. Lim, A. S. Lim, S. Sutjipto, P. H. Lee, et al. 2020b. Detection of air and surface contamination by SARS-CoV-2 in hospital rooms of infected patients. Nature Communications 11 (1):1–7. doi:https://doi.org/10.1038/s41467-020-16670-2
- Chidambaram, P. 2020. State reporting of cases and deaths due to COVID-19 in long-term care facilities | KFF.
- China NHC. 2020. 国家卫生健康委办公厅关于印发新型冠状病毒肺炎防控方案(第五版)的通知_卫生_中国政府网.
- Chirizzi, D., M. Conte, M. Feltracco, A. Dinoi, E. Gregoris, E. Barbaro, G. La Bella, G. Ciccarese, G. La Salandra, A. Gambaro, et al. 2021. SARS-CoV-2 concentrations and virus-laden aerosol size distributions in outdoor air in north and south of Italy. Environment International 146:106255. doi:https://doi.org/10.1016/j.envint.2020.106255
- Choi, H., and H. Varian. 2012. Predicting the present with google trends. Economic Record 88 (Suppl.1):2–9. doi:https://doi.org/10.1111/j.1475-4932.2012.00809.x
- Comas-Herrera, A., J. Zalakaín, C. Litwin, A. T. Hsu, N. Lane, and J.-L. Fernández. 2020. ltccovid.org | Mortality associated with COVID-19 outbreaks in care homes Mortality associated with COVID-19 outbreaks in care homes: Early international evidence.
- Conger, K., J. Healy, and L. Tompkins. 2020. Churches emerge as major source of coronavirus cases.
- Cook, T. M. 2020. Personal protective equipment during the coronavirus disease (COVID) 2019 pandemic – a narrative review. Anaesthesia 75 (7):920–7. doi:https://doi.org/10.1111/anae.15071
- Correia, G., L. Rodrigues, M. Gameiro da Silva, and T. Gonçalves. 2020. Airborne route and bad use of ventilation systems as non-negligible factors in SARS-CoV-2 transmission. Medical Hypotheses 141:109781. doi:https://doi.org/10.1016/j.mehy.2020.109781
- Corsi, R., K. Van Den Wymelenberg, and H. Parhizkar. 2020. Safeairspaces.
- Council of Europe. 2020. Prisons and Prisoners in Europe in Pandemic Times – Council of Europe Annual Penal Statistics.
- Crema, E. 2021. The SARS-COV-2 outbreak around the Amazon rainforest: The relevance of the airborne transmission. Science of the Total Environment 759:144312. doi:https://doi.org/10.1016/j.scitotenv.2020.144312
- Curtius, J., M. Granzin, and J. Schrod. 2021. Testing mobile air purifiers in a school classroom: Reducing the airborne transmission risk for SARS-CoV-2. Aerosol Science and Technology 55 (5):586–599.
- Dabisch, P., M. Schuit, A. Herzog, K. Beck, S. Wood, M. Krause, D. Miller, W. Weaver, D. Freeburger, I. Hooper, et al. 2020. The influence of temperature, humidity, and simulated sunlight on the infectivity of SARS-CoV-2 in aerosols. Aerosol Science and Technology 55 (2):142–53.
- Dai, H., and B. Zhao. 2020a. Association of infected probability of COVID-19 with ventilation rates in confined spaces: A Wells-Riley equation based investigation. MedRxiv 2020.04.21.20072397.
- Dai, H., and B. Zhao. 2020b. Association of the infection probability of COVID-19 with ventilation rates in confined spaces. Building Simulation 13 (6):1321–7. doi:https://doi.org/10.1007/s12273-020-0703-5
- Davies, A., K.-A. Thompson, K. Giri, G. Kafatos, J. Walker, and A. Bennett. 2013. Testing the efficacy of homemade masks: Would they protect in an influenza pandemic? Disaster Medicine and Public Health Preparedness 7:413–8.
- Davies, N., S. Abbott, R. Barnard, C. Jarvis, A. Kucharski, J. Munday, C. Pearson, T. Russell, D. Tully, A. Washburne, et al. 2021. Estimated transmissibility and impact of SARS-CoV-2 lineage B.1.1.7 in England. Science 372 (6538):eabg3055. doi:https://doi.org/10.1126/science.abg3055
- Davlantes, E., M. Toro, R. Villalobos, and L. Sanchez-Gonzalez. 2020. Notes from the Field: COVID-19 prevention practices in state prisons – Puerto Rico, 2020. MMWR. Morbidity and Mortality Weekly Report 69 (33):1144. doi:https://doi.org/10.15585/mmwr.mm6933a4
- Dbouk, T., and D. Drikakis. 2021. On airborne virus transmission in elevators and confined spaces. Physics of Fluids 33 (1):011905.
- de Man, P., S. Paltansing, D. S. Y. Ong, N. Vaessen, G. van Nielen, and J. G. M. Koeleman. 2020. Outbreak of Coronavirus Disease 2019 (COVID-19) in a nursing home associated with aerosol transmission as a result of inadequate ventilation. Clinical Infectious Diseases 73 (1):170–171.
- Deng, X., M. A. Garcia-Knight, M. M. Khalid, V. Servellita, C. Wang, M. Kate Morris, A. Sotomayor-González, K. R. Reyes, A. S. Gliwa, N. P. Reddy, et al. 2021. Transmission, infectivity, and antibody neutralization of an emerging SARS-CoV-1 2 variant in California carrying a L452R spike protein mutation 2. MedRxiv 2021.03.07.21252647.
- Detroit Free Press. 2020. Infection rate at Michigan prison exceeds New York, Chicago jail hotspots.
- Dhand, R., and J. Li. 2020. Coughs and sneezes: Their role in transmission of respiratory viral infections, including SARS-CoV-2. American Journal of Respiratory and Critical Care Medicine 202 (5):651–9. doi:https://doi.org/10.1164/rccm.202004-1263PP
- Diep, F. 2020. The 5 biggest lessons we’ve learned about how coronavirus spreads on campus.
- Dillon, M. B., and R. G. Sextro. 2020. Reducing exposures to airborne particles through improved filtration: A high-level modeling analysis. MedRxiv 2020.05.14.20101311.
- Ding, Z., H. Qian, B. Xu, Y. Huang, T. Miao, H. L. Yen, S. Xiao, L. Cui, X. Wu, W. Shao, et al. 2021. Toilets dominate environmental detection of severe acute respiratory syndrome coronavirus 2 in a hospital. Science of the Total Environment 753:141710. doi:https://doi.org/10.1016/j.scitotenv.2020.141710
- Döhla, M., G. Wilbring, B. Schulte, B. M. Kümmerer, C. Diegmann, E. Sib, E. Richter, A. Haag, S. Engelhart, A. M. Eis-Hübinger, et al. 2020. SARS-CoV-2 in environmental samples of quarantined households. MedRxiv.
- Dols, W. S., B. J. Polidoro, D. Poppendieck, and S. J. Emmerich. 2020. A Tool to Model the Fate and Transport of Indoor Microbiological Aerosols (FaTIMA).
- Donahue, M., N. Sreenivasan, D. Stover, A. Rajasingham, J. Watson, A. Bealle, N. Ritchison, T. Safranek, M. A. Waltenburg, B. Buss, et al. 2020. Notes from the field: Characteristics of meat processing facility workers with confirmed SARS-CoV-2 infection – Nebraska, April–May 2020. MMWR. Morbidity and Mortality Weekly Report 69 (31):1020–2. doi:https://doi.org/10.15585/mmwr.mm6931a3
- Donaldson, A. I. 2020. Aerosols in meat plants as possible cause of Covid-19 spread. Veterinary Record 187 (1):34–5. doi:https://doi.org/10.1136/vr.m2702
- Dora, A. V., A. Winnett, L. P. Jatt, K. Davar, M. Watanabe, L. Sohn, H. S. Kern, C. J. Graber, and M. B. Goetz. 2020. Universal and serial laboratory testing for SARS-CoV-2 at a long-term care skilled nursing facility for veterans – Los Angeles, California, 2020. MMWR. Morbidity and Mortality Weekly Report 69 (21):651–5. doi:https://doi.org/10.15585/mmwr.mm6921e1
- Dunker, S., T. Hornick, G. Szczepankiewicz, M. Maier, M. Bastl, J. Bumberger, R. Treudler, U. G. Liebert, and J.-C. Simon. 2021. No SARS-CoV-2 detected in air samples (pollen and particulate matter) in Leipzig during the first spread. Science of the Total Environment 755:142881. doi:https://doi.org/10.1016/j.scitotenv.2020.142881
- Dygert, R. K., and T. Q. Dang. 2012. Experimental validation of local exhaust strategies for improved IAQ in aircraft cabins. Building and Environment 47 (1):76–88. doi:https://doi.org/10.1016/j.buildenv.2011.04.025
- ECDC. 2020. COVID-19 in children and the role of school settings in COVID-19 transmission.
- Eichler, N., C. Thornley, T. Swadi, T. Devine, C. McElnay, J. Sherwood, C. Brunton, F. Williamson, J. Freeman, S. Berger, et al. 2021. Transmission of severe acute respiratory syndrome coronavirus 2 during border quarantine and air travel, New Zealand (Aotearoa). Emerging Infectious Diseases 27 (5):1274–8. doi:https://doi.org/10.3201/eid2705.210514
- Europe CDC. 2020. Transmission of COVID-19.
- Fajnzylber, J., J. Regan, K. Coxen, H. Corry, C. Wong, A. Rosenthal, D. Worrall, F. Giguel, A. Piechocka-Trocha, C. Atyeo. et al. 2020. SARS-CoV-2 viral load is associated with increased disease severity and mortality. Nature Communications 11 (1):1–9. doi:https://doi.org/10.1038/s41467-020-19057-5
- Faridi, S., S. Niazi, K. Sadeghi, K. Naddafi, J. Yavarian, M. Shamsipour, N. Z. S. Jandaghi, K. Sadeghniiat, R. Nabizadeh, M. Yunesian, et al. 2020. A field indoor air measurement of SARS-CoV-2 in the patient rooms of the largest hospital in Iran. Science of the Total Environment 725:138401. doi:https://doi.org/10.1016/j.scitotenv.2020.138401
- Favre, J. 2020. There’s no evidence the new coronavirus spreads through the air – but it’s still possible. The Conversation.
- Fears, A. C., W. B. Klimstra, P. Duprex, A. Hartman, S. C. Weaver, K. S. Plante, D. Mirchandani, J. A. Plante, P. V. Aguilar, D. Fernández, et al. 2020. Persistence of severe acute respiratory syndrome coronavirus 2 in aerosol suspensions. Emerging Infectious Diseases 26 (9):2168–71. doi:https://doi.org/10.3201/eid2609.201806
- Feng, B., K. Xu, S. Gu, S. Zheng, Q. Zou, Y. Xu, L. Yu, F. Lou, F. Yu, T. Jin, et al. 2021. Multi-route transmission potential of SARS-CoV-2 in healthcare facilities. Journal of Hazardous Materials 402:123771. doi:https://doi.org/10.1016/j.jhazmat.2020.123771
- Feng, Z., F. Wei, H. Li, and C. W. Yu. 2021. Evaluation of indoor disinfection technologies for airborne disease control in hospital. Indoor and Built Environment 30 (6):727–31. doi:https://doi.org/10.1177/1420326X211002948
- Fisher, K. A., M. W. Tenforde, L. R. Feldstein, C. J. Lindsell, N. I. Shapiro4, D. C. Files, K. W. Gibbs, H. L. Erickson, and M. E. Prekker. 2020. Community and close contact exposures associated with COVID-19 among symptomatic adults ≥18 years in 11 outpatient health care facilities – United States, July 2020. Center for Disease Control and Prevention MMWR 69 (36):1258–1264.
- Fisk, W. J. 2017. The ventilation problem in schools: Literature review. Indoor Air.
- Fix The Mask. 2020. DIY Mask Brace from Rubber Sheet Downloadable Template – Fix The Mask.
- Fry, E., and N. Rapp. 2021. The COVID-19 Delta variant is now dominant in the U.S. See the states where it’s most prevalent | Fortune.
- Gammaitoni, L., and M. C. Nucci. 1997. Using a mathematical model to evaluate the efficacy of TB control measures. Emerging Infectious Diseases 3 (3):335–42. doi:https://doi.org/10.3201/eid0303.970310
- Gao, N. P., J. L. Niu, M. Perino, and P. Heiselberg. 2008. The airborne transmission of infection between flats in high-rise residential buildings: Tracer gas simulation. Building and Environment 43 (11):1805–17. doi:https://doi.org/10.1016/j.buildenv.2007.10.023
- Goldstein, E., M. Lipsitch, and M. Cevik. 2020. On the effect of age on the transmission of SARS-CoV-2 in households, schools, and the community. The Journal of Infectious Diseases 223 (3):362–369.
- Google. 2020. COVID airborne – explore – Google Trends.
- Government of Canada. 2021. Using ventilation and filtration to reduce aerosol transmission of COVID-19 in long-term care homes.
- Greenhalgh, T., J. L. Jimenez, K. A. Prather, Z. Tufekci, D. Fisman, and R. Schooley. 2021. Ten scientific reasons in support of airborne transmission of SARS-CoV-2. The Lancet 397 (10285):1603–5. doi:https://doi.org/10.1016/S0140-6736(21)00869-2
- Gregg Girvan. 2020. Nursing homes & assisted living facilities account for 42% of COVID-19 deaths.
- Gressman, P. T., and J. R. Peck. 2020. Simulating COVID-19 in a university environment. Mathematical Biosciences 328:108436. doi:https://doi.org/10.1016/j.mbs.2020.108436
- Guenther, T., M. Czech-Sioli, D. Indenbirken, A. Robitailles, P. Tenhaken, M. Exner, M. Ottinger, N. Fischer, A. Grundhoff, and M. Brinkmann. 2020. Investigation of a superspreading event preceding the largest meat processing plant-related SARS-Coronavirus 2 outbreak in Germany. SSRN Electronic Journal. doi:https://doi.org/10.2139/ssrn.3654517
- Günther, T., M. Czech, ‐D. Sioli, A. Indenbirken, P. Robitaille, M. Tenhaken, M. Exner, N. Ottinger, A. Fischer, M. M. Grundhoff, et al. 2020. SARS‐CoV‐2 outbreak investigation in a German meat processing plant. EMBO Molecular Medicine 12 (12):e13296. doi:https://doi.org/10.15252/emmm.202013296
- Guo, C., Z. Gao, and J. Shen. 2019. Emission rates of indoor ozone emission devices: A literature review. Building and Environment 158:302–18. doi:https://doi.org/10.1016/j.buildenv.2019.05.024
- Guo, M., P. Xu, T. Xiao, R. He, M. Dai, and S. L. Miller. 2021. Review and comparison of HVAC operation guidelines in different countries during the COVID-19 pandemic. Building and Environment 187:107368. doi:https://doi.org/10.1016/j.buildenv.2020.107368
- Guo, Y., H. Qian, Z. Sun, J. Cao, F. Liu, X. Luo, R. Ling, L. B. Weschler, J. Mo, and Y. Zhang. 2021. Assessing and controlling infection risk with Wells-Riley model and spatial flow impact factor (SFIF). Sustainable Cities and Society 67:102719. doi:https://doi.org/10.1016/j.scs.2021.102719
- Guo, Z. D., Z. Y. Wang, S. F. Zhang, X. Li, L. Li, C. Li, Y. Cui, R. B. Fu, Y. Z. Dong, X. Y. Chi, et al. 2020. Aerosol and surface distribution of severe acute respiratory syndrome coronavirus 2 in hospital wards, Wuhan, China, 2020. Emerging Infectious Diseases 26 (7):1586–91. doi:https://doi.org/10.3201/eid2607.200885
- Gupta, J. K., C. H. Lin, and Q. Chen. 2012. Risk assessment of airborne infectious diseases in aircraft cabins. Indoor Air 22 (5):388–95. doi:https://doi.org/10.1111/j.1600-0668.2012.00773.x
- Hadei, M., S. R. Mohebbi, P. K. Hopke, A. Shahsavani, S. Bazzazpour, M. Alipour, A. J. Jafari, A. M. Bandpey, A. Zali, M. Yarahmadi, et al. 2021. Presence of SARS-CoV-2 in the air of public places and transportation. Atmospheric Pollution Research 12 (3):302–6. doi:https://doi.org/10.1016/j.apr.2020.12.016
- Hagan, L. M., S. P. Williams, A. C. Spaulding, R. L. Toblin, J. Figlenski, J. Ocampo, T. Ross, H. Bauer, J. Hutchinson, K. D. Lucas, et al. 2020. Mass testing for SARS-CoV-2 in 16 prisons and jails – Six Jurisdictions, United States, April–May 2020. MMWR. Morbidity and Mortality Weekly Report 69 (33):1139–43. doi:https://doi.org/10.15585/mmwr.mm6933a3
- Haghighat, F., Y. Huo, J. Zhang, and C. Shaw. 1996. The influence of office furniture, workstation layouts, diffuser types and location on indoor air quality and thermal comfort conditions at workstations. Indoor Air 6 (3):188–203. doi:https://doi.org/10.1111/j.1600-0668.1996.t01-1-00006.x
- Han, M. S., M.-W. Seong, E. Y. Heo, J. H. Park, N. Kim, S. Shin, S. I. Cho, S. S. Park, and E. H. Choi. 2020. Sequential analysis of viral load in a neonate and her mother infected with severe acute respiratory syndrome coronavirus 2. Clinical Infectious Diseases 71 (16):2236–9. doi:https://doi.org/10.1093/cid/ciaa447
- Harrichandra, A., A. M. Ierardi, and B. Pavilonis. 2020. An estimation of airborne SARS-CoV-2 infection transmission risk in New York City nail salons. Toxicology and Industrial Health 36 (9):634–43.
- Harris, J. E. 2020. The subways seeded the massive coronavirus epidemic in New York City by Jeffrey E. Harris:: SSRN.
- Harris-Kojetin, L., M. Sengupta, J. Lendon, V. Rome, R. Valverde, and C. Caffrey. 2019. Long-term care providers and services users in the United States, 2015–2016. National Center for Health Statistics, Vital and Health Statistics 3 (43).
- He, R., W. Liu, J. Elson, R. Vogt, C. Maranville, and J. Hong. 2021. Airborne transmission of COVID-19 and mitigation using box fan air cleaners in a poorly ventilated classroom. MedRxiv 2021.03.11.21253395.
- Hester Allen, A., A. Vusirikala, J. Flannagan, K. A. Twohig, A. Zaidi, R. Harris, A. Charlett, G. Dabrera, and M. Kall. 2021. Increased household transmission of COVID-19 cases associated with SARS-CoV-2 variant of concern B.1.617.2: A national case-control study. ResearchGate.
- Horve, P. F., L. Dietz, M. Fretz, D. A. Constant, A. Wilkes, J. M. Townes, R. G. Martindale, W. B. Messer, and K. G. van Den Wymelenberg. 2020. Identification of SARS-CoV-2 RNA in healthcare heating, ventilation, and air conditioning units. MedRxiv.
- Hu, J., Lei, C. C. 1#, W. Liu, X. Hu, R. Pei, Z. Su, F. Deng, Y. Huang, X. Sun, J. Cao, et al. 2020. Airborne SARS-CoV-2 and the use of masks for protection against its spread in Wuhan, China. Preprints
- Hubler, S., and A. Hartocollis. 2020. How campuses became the new covid-19 hotspots.
- Hussar, B., J. Zhang, S. Hein, K. Wang, A. Roberts, J. Cui, M. Smith, F. Bullock Mann, A. Barmer, and R. Dilig. 2020. The condition of education – postsecondary education – postsecondary students – characteristics of postsecondary students – Indicator April (2020).
- Hwang, S. E., J. H. Chang, B. Oh, and J. Heo. 2021. Possible aerosol transmission of COVID-19 associated with an outbreak in an apartment in Seoul, South Korea, 2020. International Journal of Infectious Diseases 104:73–6. doi:https://doi.org/10.1016/j.ijid.2020.12.035
- IDPH. 2020. COVID-19 outbreak locations.
- James, A., L. Eagle, C. Phillips, D. S. Hedges, C. Bodenhamer, R. Brown, J. G. Wheeler, and H. Kirking. 2020. High COVID-19 attack rate among attendees at events at a Church – Arkansas, March 2020. MMWR. Morbidity and Mortality Weekly Report 69 (20):632–5. doi:https://doi.org/10.15585/mmwr.mm6920e2
- Jiang, Y., H. Wang, Y. Chen, J. He, L. Chen, Y. Liu, X. Hu, A. Li, S. Liu, P. Zhang, et al. 2020. Clinical data on hospital environmental hygiene monitoring and medical staff protection during the Coronavirus disease 2019 outbreak. MedRxiv.
- Jimenez, J. L., and Z. Peng. 2020. 2020_COVID-19_Aerosol_Transmission_Estimator – Google Sheets.
- Jin, T., J. Li, J. Yang, J. Li, F. Hong, H. Long, Q. Deng, Y. Qin, J. Jiang, X. Zhou, et al. 2021. SARS-CoV-2 presented in the air of an intensive care unit (ICU). Sustainable Cities and Society 65:102446. doi:https://doi.org/10.1016/j.scs.2020.102446
- Johnson, D., R. Lynch, C. Marshall, K. Mead, and D. Hirst. 2013. Aerosol generation by modern flush toilets. Aerosol Science and Technology 47 (9):1047–57. doi:https://doi.org/10.1080/02786826.2013.814911
- Jones, B., P. Sharpe, C. Iddon, E. A. Hathway, C. J. Noakes, and S. Fitzgerald. 2021. Modelling uncertainty in the relative risk of exposure to the SARS-CoV-2 virus by airborne aerosol transmission in well mixed indoor air. Building and Environment 191:107617. doi:https://doi.org/10.1016/j.buildenv.2021.107617
- Kanaan, M., and A. Abou Moughlbay. 2018. Comparative CFD investigation of upper room UVGI efficacy with three different ventilation systems. International Journal of Applied Engineering Research 13 (12):14897–14902.
- Kang, M., J. Wei, J. Yuan, J. Guo, Y. Zhang, J. Hang, Y. Qu, H. Qian, Y. Zhuang, X. Chen, et al. 2020. Probable evidence of fecal aerosol transmission of SARS-CoV-2 in a high-rise building. Annals of Internal Medicine 173 (12):974–80. doi:https://doi.org/10.7326/M20-0928
- Kasibhatla, P., J. Jimenez, J. Fay, E. Albright, and W. Pan. 2020. COVID exposure modeler.
- Kasper, M. R., J. R. Geibe, C. L. Sears, A. J. Riegodedios, T. Luse, A. M. Von Thun, M. B. McGinnis, N. Olson, D. Houskamp, R. Fenequito, et al. 2020. An outbreak of covid-19 on an aircraft carrier. New England Journal of Medicine 383 (25):2417–26. doi:https://doi.org/10.1056/NEJMoa2019375
- Katelaris, A. L., J. Wells, P. Clark, S. Norton, R. Rockett, A. Arnott, V. Sintchenko, S. Corbett, and S. K. Bag. 2021. Epidemiologic evidence for airborne transmission of SARS-CoV-2 during Church Singing, Australia, 2020. Emerging Infectious Diseases 27 (6):1677–80. doi:https://doi.org/10.3201/eid2706.210465
- Kenarkoohi, A., Z. Noorimotlagh, S. Falahi, A. Amarloei, S. A. Mirzaee, I. Pakzad, and E. Bastani. 2020. Hospital indoor air quality monitoring for the detection of SARS-CoV-2 (COVID-19) virus. Science of the Total Environment 748:141324. doi:https://doi.org/10.1016/j.scitotenv.2020.141324
- Khanh, N. C., P. Q. Thai, H. L. Quach, N. A. H. Thi, P. C. Dinh, T. N. Duong, L. T. Q. Mai, N. D. Nghia, T. A. Tu, L. N. Quang, et al. 2020. Transmission of SARS-CoV 2 during long-haul flight. Emerging Infectious Diseases 26 (11):2617–24. doi:https://doi.org/10.3201/eid2611.203299
- Khurana, A., G. P. Kaushal, R. Gupta, V. Verma, K. Sharma, and M. Kohli. 2020. Prevalence and clinical correlates of COVID-19 outbreak among healthcare workers in a tertiary level hospital. MedRxiv 2020.07.21.20159301.
- Kim, J. Y., J.-H. Ko, Y. Kim, Y.-J. Kim, J.-M. Kim, Y.-S. Chung, H. M. Kim, M.-G. Han, S. Y. Kim, and B. S. Chin. 2020. Viral load kinetics of SARS-CoV-2 infection in first two patients in Korea. Journal of Korean Medical Science 35 (7):e86.
- Kim, U. J., S. Y. Lee, J. Y. Lee, A. Lee, S. E. Kim, O. J. Choi, J. S. Lee, S. J. Kee, and H. C. Jang. 2020. Air and environmental contamination caused by COVID-19 patients: A multi-center study. Journal of Korean Medical Science 35 (37):e332.
- Kim, Y. I., S. G. Kim, S. M. Kim, E. H. Kim, S. J. Kim, K. M. Park, J. H. Yu, E. J. Chang, S. Kim, M. A. B. Lee, et al. 2020. Infection and rapid transmission of SARS-CoV-2 in ferrets. Cell Host & Microbe 27 (5):704-9.e2. doi:https://doi.org/10.1016/j.chom.2020.03.023
- Kimball, A., K. M. Hatfield, M. Arons, A. James, J. Taylor, K. Spicer, A. C. Bardossy, L. P. Oakley, S. Tanwar, Z. Chisty, et al. 2020. Asymptomatic and presymptomatic SARS-CoV-2 infections in residents of a long-term care skilled nursing facility – King County, Washington, March 2020. MMWR. Morbidity and Mortality Weekly Report 69 (13):377–81. doi:https://doi.org/10.15585/mmwr.mm6913e1
- Ko, G., H. A. Burge, E. A. Nardell, and K. M. Thompson. 2001. Estimation of tuberculosis risk and incidence under upper room ultraviolet germicidal irradiation in a waiting room in a hypothetical scenario. Risk Analysis 21 (4):657–74. doi:https://doi.org/10.1111/0272-4332.214142
- Ko, G., K. M. Thompson, and E. A. Nardell. 2004. Estimation of tuberculosis risk on a commercial airliner. Risk Analysis 24 (2):379–88. doi:https://doi.org/10.1111/j.0272-4332.2004.00439.x
- Ko, G., M. W. First, and H. A. Burge. 2002. The characterization of upper-room ultraviolet germicidal irradiation in inactivating airbone microorganisms. Environmental Health Perspectives 110 (1):95–101. doi:https://doi.org/10.1289/ehp.0211095
- Koh, D. 2020. Occupational risks for COVID-19 infection. Occupational Medicine 70 (1):3–5. doi:https://doi.org/10.1093/occmed/kqaa036
- Konda, A., A. Prakash, G. A. Moss, M. Schmoldt, G. D. Grant, and S. Guha. 2020. Aerosol filtration efficiency of common fabrics used in respiratory cloth masks. ACS Nano 14 (5):6339–47. doi:https://doi.org/10.1021/acsnano.0c03252
- Kong, M., J. Shen, B. Dong, and J. Zhang. 2020. Effectiveness of building systems strategies for mitigation of airborne transmission of SARS-CoV-2. Mechanical and Aerospace Engineering 18.
- Kutter, J. S., D. de Meulder, T. M. Bestebroer, P. Lexmond, A. Mulders, M. Richard, R. A. M. Fouchier, and S. Herfst. 2021. SARS-CoV and SARS-CoV-2 are transmitted through the air between ferrets over more than one meter distance. Nature Communications 12 (1):1–8. doi:https://doi.org/10.1038/s41467-021-21918-6
- Lai, X., M. Wang, C. Qin, L. Tan, L. Ran, D. Chen, H. Zhang, K. Shang, C. Xia, S. Wang, et al. 2020. Coronavirus Disease 2019 (COVID-2019) infection among health care workers and implications for prevention measures in a tertiary hospital in Wuhan, China. JAMA Network Open 3 (5):e209666. doi:https://doi.org/10.1001/jamanetworkopen.2020.9666
- Lan, F. Y., C. Suharlim, S. N. Kales, and J. Yang. 2020. Association between SARS-CoV-2 infection, exposure risk and mental health among a cohort of essential retail workers in the USA. Occupational and Environmental Medicine 78 (4):237–243.
- Lane, M. A., E. A. Brownsword, J. S. Morgan, A. Babiker, S. A. Vanairsdale, G. M. Lyon, A. K. Mehta, J. M. Ingersoll, W. G. Lindsley, and C. S. Kraft. 2020. Bioaerosol sampling of a ventilated patient with COVID-19. American Journal of Infection Control 48 (12):1540–2. doi:https://doi.org/10.1016/j.ajic.2020.07.033
- LDHH. 2020. COVID-19 outbreaks.
- Lednicky, J. A., M. Lauzard, Z. H. Fan, A. Jutla, T. B. Tilly, M. Gangwar, M. Usmani, S. N. Shankar, K. Mohamed, A. Eiguren-Fernandez, et al. 2020. Viable SARS-CoV-2 in the air of a hospital room with COVID-19 patients. International Journal of Infectious Diseases: IJID 100:476–82. doi:https://doi.org/10.1016/j.ijid.2020.09.025
- Lednicky, J. A., M. Lauzardo, M. M. Alam, M. A. Elbadry, C. J. Stephenson, J. C. Gibson, and J. G. Morris. 2021. Isolation of SARS-CoV-2 from the air in a car driven by a COVID patient with mild illness. MedRxiv 2021.01.12.21249603.
- Lee, J., S. W. Yeon, M. Hong, J. S. Hyun, J. H. Park, Y. S. Lee, D. H. Suh, S. W. Kim, C. H. Han, H. Cho, et al. 2020. Epidemiological and clinical characteristics of coronavirus disease 2019 in Daegu, South Korea. International Journal of Infectious Diseases: IJID 98:462–6. doi:https://doi.org/10.1016/j.ijid.2020.07.017
- Lewis, D. 2020a. Mounting evidence suggests coronavirus is airborne – but health advice has not caught up. Nature 583 (7817):510–3. doi:https://doi.org/10.1038/d41586-020-02058-1
- Lewis, D. 2020b. Why schools probably aren’t COVID hotspots. Nature 587 (7832):17. doi:https://doi.org/10.1038/d41586-020-02973-3
- Lewis, D. 2021a. Superspreading drives the COVID pandemic – and could help to tame it. Nature 590 (7847):544–546. doi:https://doi.org/10.1038/d41586-021-00460-x
- Lewis, D. 2021b. What new COVID variants mean for schools is not yet clear. Nature 589 (7843):503–503. doi:https://doi.org/10.1038/d41586-021-00139-3
- Lewis, M. 2020. COVID-19 outbreak among college students after a spring break trip to Mexico – Austin, Texas, March 26–April 5, 2020. MMWR. Morbidity and Mortality Weekly Report 69 (26):830–835.
- Li, B., A. Deng, K. Li, Y. Hu, Z. Li, Q. Xiong, Z. Liu, Q. Guo, L. Zou, H. Zhang, et al. 2021. Viral infection and transmission in a large, well-traced outbreak caused by the SARS-CoV-2 Delta variant. MedRxiv 2021.07.07.21260122.
- Li, F., Y.-Y. Li, M.-J. Liu, L.-Q. Fang, N. E. Dean, G. W. K. Wong, X.-B. Yang, I. Longini, M. E. Halloran, H.-J. Wang, et al. 2021. Household transmission of SARS-CoV-2 and risk factors for susceptibility and infectivity in Wuhan: A retrospective observational study. The Lancet Infectious Diseases 21 (5):617–628.
- Li, J., Z. Cheng, Y. Zhang, N. Mao, S. Guo, Q. Wang, L. Zhao, and E. Long. 2021. Evaluation of infection risk for SARS-CoV-2 transmission on university campuses. Science and Technology for the Built Environment, 27 (9):1165–1180. doi:https://doi.org/10.1080/23744731.2021.1948762
- Li, Y., H. Qian, J. Hang, X. Chen, L. Hong, P. Liang, J. Li, S. Xiao, J. Wei, L. Liu, et al. 2020. Evidence for probable aerosol transmission of SARS-CoV-2 in a poorly ventilated restaurant. MedRxiv 2020.04.16.20067728.
- Li, Y. H., Y. Z. Fan, L. Jiang, and H. B. Wang. 2020. Aerosol and environmental surface monitoring for SARS-CoV-2 RNA in a designated hospital for severe COVID-19 patients. Epidemiology and Infection 148:e154. doi:https://doi.org/10.1017/S0950268820001570
- Liao, M., H. Liu, X. Wang, X. Hu, Y. Huang, X. Liu, K. Brenan, J. Mecha, M. Nirmalan, and J. R. Lu. 2021. A Technical review of face mask wearing in preventing respiratory COVID-19 transmission. Current Opinion in Colloid & Interface Science 52:101417. doi:https://doi.org/10.1016/j.cocis.2021.101417
- Lindsley, W. G., F. M. Blachere, R. E. Thewlis, A. Vishnu, K. A. Davis, G. Cao, J. E. Palmer, K. E. Clark, M. A. Fisher, R. Khakoo, et al. 2010. Measurements of airborne influenza virus in aerosol particles from human coughs. PLoS One 5 (11):e15100. doi:https://doi.org/10.1371/journal.pone.0015100
- Lindsley, W. G., J. D. Noti, F. M. Blachere, J. V. Szalajda, and D. H. Beezhold. 2014. Efficacy of face shields against cough aerosol droplets from a cough simulator. Journal of Occupational and Environmental Hygiene 11 (8):509–518. doi:https://doi.org/10.1080/15459624.2013.877591
- Liu, H., S. He, L. Shen, and J. Hong. 2021. Simulation-based study of COVID-19 outbreak associated with air-conditioning in a restaurant. Physics of Fluids 33 (2):023301. doi:https://doi.org/10.1063/5.0040188
- Liu, Y., Z. Ning, Y. Chen, M. Guo, Y. Liu, N. K. Gali, L. Sun, Y. Duan, J. Cai, D. Westerdahl, et al. 2020. Aerodynamic analysis of SARS-CoV-2 in two Wuhan hospitals. Nature 582 (7813):557–560. doi:https://doi.org/10.1038/s41586-020-2271-3
- Loop News. 2020. Another 31 workers at Jamaica call center test positive for COVID-19.
- Lu, J., J. Gu, J. Gu, K. Li, C. Xu, W. Su, Z. Lai, D. Zhou, C. Yu, B. Xu, et al. 2020. COVID-19 outbreak associated with air conditioning in restaurant, Guangzhou, China, 2020. Emerging Infectious Diseases 26 (7):1628–1631. doi:https://doi.org/10.3201/eid2607.200764
- Ludvigsson, J. F. 2020. Systematic review of COVID-19 in children shows milder cases and a better prognosis than adults. Acta Paediatrica 109 (6):1088–1095. doi:https://doi.org/10.1111/apa.15270
- Luo, K., Z. Lei, Z. Hai, S. Xiao, J. Rui, H. Yang, X. Jing, H. Wang, Z. Xie, P. Luo, et al. 2020. Transmission of SARS-CoV-2 in public transportation vehicles: A case study in Hunan Province, China. Open Forum Infectious Diseases 7 (10):ofaa430. doi:https://doi.org/10.1093/ofid/ofaa430
- Lynch, R. M., and R. Goring. 2020. Practical steps to improve air flow in long-term care resident rooms to reduce COVID-19 infection risk. Journal of the American Medical Directors Association 21 (7):893–894. doi:https://doi.org/10.1016/j.jamda.2020.04.001
- Ma, J., X. Qi, H. Chen, X. Li, Z. Zhang, H. Wang, L. Sun, L. Zhang, J. Guo, L. Morawska, et al. 2020. Coronavirus disease 2019 patients in earlier stages exhaled millions of severe acute respiratory syndrome coronavirus 2 per hour. Clinical Infectious Diseases 72 (10):e652–e654.
- Maestre, J. P., D. Jarma, J. R. F. Yu, J. A. Siegel, S. D. Horner, and K. A. Kinney. 2021. Distribution of SARS-CoV-2 RNA signal in a home with COVID-19 positive occupants. Science of the Total Environment 778:146201. doi:https://doi.org/10.1016/j.scitotenv.2021.146201
- Mallapaty, S. 2020. How schools can reopen safely during the pandemic. Nature 584 (7822):503–504. doi:https://doi.org/10.1038/d41586-020-02403-4
- Masotti, F., S. Cattaneo, M. Stuknytė, V. Pica, and I. D. Noni. 2021. Transmission routes, preventive measures and control strategies of SARS-CoV-2 in the food factory. Critical Reviews in Food Science and Nutrition. doi:https://doi.org/10.1080/10408398.2021.1879728
- Masoumbeigi, H., G. Ghanizadeh, R. Yousefi Arfaei, S. Heydari, H. Goodarzi, R. Dorostkar Sari, and M. Tat. 2020. Investigation of hospital indoor air quality for the presence of SARS-Cov-2. Journal of Environmental Health Science and Engineering 18 (2):1259–1263. doi:https://doi.org/10.1007/s40201-020-00543-3
- Mathai, V., A. Das, J. A. Bailey, and K. Breuer. 2021. Airflows inside passenger cars and implications for airborne disease transmission. Science Advances 7 (1):eabe0166. doi:https://doi.org/10.1126/sciadv.abe0166
- MDH. 2021. Heating, ventilation, and air conditioning (HVAC) and fan considerations for long-term care during COVID-19.
- MDHHS. 2020. Coronavirus – outbreak reporting.
- Melikov, A., H. Grønbaek, and J. B. Nielsen. 2007. Personal Ventilation: From research to practical use.
- Melikov, A. K. 2020. COVID-19: Reduction of airborne transmission needs paradigm shift in ventilation. Building and Environment 186:107336. doi:https://doi.org/10.1016/j.buildenv.2020.107336
- Melikov, A. K., Z. T. Ai, and D. G. Markov. 2020. Intermittent occupancy combined with ventilation: An efficient strategy for the reduction of airborne transmission indoors. Science of the Total Environment 744:140908. doi:https://doi.org/10.1016/j.scitotenv.2020.140908
- Melo, P., J. M. Barbosa, L. Jardim, E. Carrilho, and J. Portugal. 2021. COVID-19 management in clinical dental care. Part I: Epidemiology, public health implications, and risk assessment. International Dental Journal 71 (3):251–262. doi:https://doi.org/10.1016/j.identj.2021.01.015
- Middleton, J., R. Reintjes, and H. Lopes. 2020. Meat plants-a new front line in the covid-19 pandemic. BMJ (Clinical Research ed.) 370:m2716. doi:https://doi.org/10.1136/bmj.m2716
- Miller, S. L., W. W. Nazaroff, J. L. Jimenez, A. Boerstra, G. Buonanno, S. J. Dancer, J. Kurnitski, L. C. Marr, L. Morawska, and C. Noakes. 2020. Transmission of SARS-CoV-2 by inhalation of respiratory aerosol in the Skagit Valley Chorale superspreading event. MedRxiv (June):2020.06.15.20132027.
- Moore, G., H. Rickard, D. Stevenson, P. Aranega-Bou, J. Pitman, A. Crook, K. Davies, A. Spencer, C. Burton, L. Easterbrook, et al. 2021. Detection of SARS-CoV-2 within the healthcare environment: A multi-centre study conducted during the first wave of the COVID-19 outbreak in England. Journal of Hospital Infection 108:189–196. doi:https://doi.org/10.1016/j.jhin.2020.11.024
- Morawska, L., and D. K. Milton. 2020. It is time to address airborne transmission of coronavirus disease 2019 (COVID-19). Clinical Infectious Diseases 71 (9):2311–2313. doi:https://doi.org/10.1093/cid/ciaa939
- Morawska, L., and J. Cao. 2020. Airborne transmission of SARS-CoV-2: The world should face the reality. Environment International 139:105730. doi:https://doi.org/10.1016/j.envint.2020.105730
- Morawska, L., G. R. Johnson, Z. D. Ristovski, M. Hargreaves, K. Mengersen, S. Corbett, C. Y. H. Chao, Y. Li, and D. Katoshevski. 2009. Size distribution and sites of origin of droplets expelled from the human respiratory tract during expiratory activities. Journal of Aerosol Science 40 (3):256–269. doi:https://doi.org/10.1016/j.jaerosci.2008.11.002
- Morawska, L., J. Allen, W. Bahnfleth, P. M. Bluyssen, A. Boerstra, G. Buonanno, J. Cao, S. J. Dancer, A. Floto, F. Franchimon, et al. 2021. A paradigm shift to combat indoor respiratory infection. Science (New York, N.Y.) 372 (6543):689–691. doi:https://doi.org/10.1126/science.abg2025
- Morawska, L., J. W. Tang, W. Bahnfleth, P. M. Bluyssen, A. Boerstra, G. Buonanno, J. Cao, S. Dancer, A. Floto, F. Franchimon, et al. 2020. How can airborne transmission of COVID-19 indoors be minimised? Environment International 142:105832. doi:https://doi.org/10.1016/j.envint.2020.105832
- Moreno, T., R. M. Pintó, A. Bosch, N. Moreno, A. Alastuey, M. C. Minguillón, E. Anfruns-Estrada, S. Guix, C. Fuentes, G. Buonanno, et al. 2021. Tracing surface and airborne SARS-CoV-2 RNA inside public buses and subway trains. Environment International 147:106326. doi:https://doi.org/10.1016/j.envint.2020.106326
- Moriarty, L. F., M. M. Plucinski, B. J. Marston, E. V. Kurbatova, B. Knust, E. L. Murray, N. Pesik, D. Rose, D. Fitter, M. Kobayashiet al. 2020. Public health responses to COVID-19 outbreaks on Cruise Ships – Worldwide, February–March 2020. MMWR. Morbidity and Mortality Weekly Report 69 (12):347–352. doi:https://doi.org/10.15585/mmwr.mm6912e3
- Mouchtouri, V. A., M. Koureas, M. Kyritsi, A. Vontas, L. Kourentis, S. Sapounas, G. Rigakos, E. Petinaki, S. Tsiodras, and C. Hadjichristodoulou. 2020. Environmental contamination of SARS-CoV-2 on surfaces, air-conditioner and ventilation systems. International Journal of Hygiene and Environmental Health 230:113599. doi:https://doi.org/10.1016/j.ijheh.2020.113599
- Nabarro, D., K. Deland, and F. Lasbennes. 2020. COVID in cold environments: Risks in meat processing plants.
- Nakamura, K., S. Morioka, S. Kutsuna, S. Iida, T. Suzuki, N. Kinoshita, T. Suzuki, Y. Sugiki, A. Okuhama, K. Kanda, et al. 2020. Environmental surface and air contamination in severe acute respiratory syndrome coronavirus 2 (SARS-CoV-2) patient rooms by disease severity. Infection Prevention in Practice 2 (4):100098. doi:https://doi.org/10.1016/j.infpip.2020.100098
- National Center for Health Statistics. 2004. The national nursing home survey: 2004 overview.
- National Institute on Aging. 2017. Residential facilities, assisted living, and nursing homes.
- National Research Council. 2002. The Airliner Cabin Environment and the Health of Passengers and Crew. Washington, DC: National Academies Press (US).
- Nature. 2021. Coronavirus is in the air – there’s too much focus on surfaces. Nature 590 (7844):7.
- Nazari, A., M. Jafari, N. Rezaei, F. Taghizadeh-Hesary, and F. Taghizadeh-Hesary. 2021. Jet fans in the underground car parking areas and virus transmission. Physics of Fluids (Woodbury, N.Y. : 1994) 33 (1):013603. doi:https://doi.org/10.1063/5.0033557
- NBC News. 2020. NH Restaurant Tied to at Least 17 COVID Cases in Outbreak – NBC Boston.
- NIOSH. 2015. Hierarchy of Controls | NIOSH | CDC.
- Nissen, K., J. Krambrich, D. Akaberi, T. Hoffman, J. Ling, Å. Lundkvist, L. Svensson, and E. Salaneck. 2020. Long-distance airborne dispersal of SARS-CoV-2 in COVID-19 wards. Scientific Reports 10 (1):19589–9. doi:https://doi.org/10.1038/s41598-020-76442-2
- Njuguna, H., M. Wallace, S. Simonson, F. A. Tobolowsky, A. E. James, K. Bordelon, R. Fukunaga, J. A. W. Gold, J. Wortham, T. Sokol, et al. 2020. Serial laboratory testing for SARS-CoV-2 infection among incarcerated and detained persons in a correctional and detention facility – Louisiana, April–May 2020. MMWR. Morbidity and Mortality Weekly Report 69 (26):836–840. doi:https://doi.org/10.15585/mmwr.mm6926e2
- Noakes, C. J., and P. A. Sleigh. 2009. Mathematical models for assessing the role of airflow on the risk of airborne infection in hospital wards. Journal of the Royal Society, Interface 6 (suppl_6):S791–S800. doi:https://doi.org/10.1098/rsif.2009.0305.focus
- Offord, C. 2020. How COVID-19 is spread. The Scientist Magazine.
- Ong, S. W. X., C. J. Chiew, L. W. Ang, T.-M. Mak, L. Cui, M. P. H. Toh, Y. D. Lim, P. H. Lee, T. H. Lee, P. Y. Chia, et al. 2021. Clinical and virological features of SARS-CoV-2 variants of concern: A retrospective cohort study comparing B.1.1.7 (Alpha), B.1.315 (Beta), and B.1.617.2 (Delta). Clinical Infectious Diseases:ciab721. doi:https://doi.org/10.2139/ssrn.3861566
- Ong, S. W. X., Y. K. Tan, P. Y. Chia, T. H. Lee, O. T. Ng, M. S. Y. Wong, and K. Marimuthu. 2020. Air, surface environmental, and personal protective equipment contamination by severe acute respiratory syndrome coronavirus 2 (SARS-CoV-2) from a symptomatic patient. JAMA 323 (16):1610. doi:https://doi.org/10.1001/jama.2020.3227
- Osha. n.d. Guidance on Preparing Workplaces for COVID-19.
- Otte Im Kampe, E., A.-S. Lehfeld, S. Buda, U. Buchholz, and W. Haas. 2020. Surveillance of COVID-19 school outbreaks, Germany, March to August 2020. Eurosurveillance 25 (38):2001645. doi:https://doi.org/10.2807/1560-7917.ES.2020.25.38.2001645
- Pan, Y., D. Zhang, P. Yang, L. L. M. Poon, and Q. Wang. 2020. Viral load of SARS-CoV-2 in clinical samples. The Lancet. Infectious Diseases 20 (4):411–412. doi:https://doi.org/10.1016/S1473-3099(20)30113-4
- Park, S. Y., Y. M. Kim, S. Yi, S. Lee, B. J. Na, C. B. Kim, J. Il Kim, H. S. Kim, Y. B. Kim, Y. Park, et al. 2020. Coronavirus disease outbreak in call center, South Korea. Emerging Infectious Diseases 26 (8):1666–1670. doi:https://doi.org/10.3201/eid2608.201274
- Pavilonis, B., A. M. Ierardi, L. Levine, F. Mirer, and E. A. Kelvin. 2021. Estimating aerosol transmission risk of SARS-CoV-2 in New York City public schools during reopening. Environmental Research 195:110805. doi:https://doi.org/10.1016/j.envres.2021.110805
- Pearson, C. A., T. W. Russell, N. G. Davis, A. J. Kucharski, W. J. Edmunds, and R. M. Eggo. 2020. Estimates of severity and transmissibility of novel South Africa SARS-CoV-2 variant 501Y.V2.
- Peng, Z., and J. L. Jimenez. 2021. Exhaled CO 2 as a COVID-19 infection risk proxy for different indoor environments and activities. Environmental Science & Technology Letters 8 (5):392–7. doi:https://doi.org/10.1021/acs.estlett.1c00183
- PHAC. 2020. Coronavirus disease (COVID-19): Prevention and risks – Canada.ca.
- Platsky, J., A. N. Roth, S. Taddeo, and D. Robinson. 2020. COVID-19 ravaged these New York factories. This is how it happened.
- Poussou, S. B., S. Mazumdar, M. W. Plesniak, P. E. Sojka, and Q. Chen. 2010. Flow and contaminant transport in an airliner cabin induced by a moving body: Model experiments and CFD predictions. Atmospheric Environment 44 (24):2830–2839. doi:https://doi.org/10.1016/j.atmosenv.2010.04.053
- Pray, I. W., S. N. Gibbons-Burgener, A. Z. Rosenberg, D. Cole, S. Borenstein, A. Bateman, E. Pevzner, and R. P. Westergaard. 2020. COVID-19 outbreak at an overnight summer school retreat – Wisconsin, July–August 2020. MMWR. Morbidity and Mortality Weekly Report 69 (43):1600–4. doi:https://doi.org/10.15585/mmwr.mm6943a4
- Princess Cruises. 2020. Diamond Princess Fact Sheet.
- Public Health Ontario. 2020. Negative impacts of community-based public health measures during a pandemic (e.g., COVID-19) on children and families.
- Qian, H., T. Miao, L. Liu, X. Zheng, D. Luo, and Y. Li. 2020. Indoor transmission of SARS‐CoV‐2. Indoor Air 31 (3):639–645.
- Qian, H., Y. Li, P. V. Nielsen, and X. Huang. 2009. Spatial distribution of infection risk of SARS transmission in a hospital ward. Building and Environment 44 (8):1651–1658. doi:https://doi.org/10.1016/j.buildenv.2008.11.002
- Qian, H., Y. Li, W. H. Seto, P. Ching, W. H. Ching, and H. Q. Sun. 2010. Natural ventilation for reducing airborne infection in hospitals. Building and Environment 45 (3):559–65. doi:https://doi.org/10.1016/j.buildenv.2009.07.011
- Razzini, K., M. Castrica, L. Menchetti, L. Maggi, L. Negroni, N. V. Orfeo, A. Pizzoccheri, M. Stocco, S. Muttini, and C. M. Balzaretti. 2020. SARS-CoV-2 RNA detection in the air and on surfaces in the COVID-19 ward of a hospital in Milan, Italy. Science of the Total Environment 742:140540. doi:https://doi.org/10.1016/j.scitotenv.2020.140540
- REHVA. 2020. COVID-19 ventilation calculator.
- REHVA. 2021. REHVA COVID-19 guidance document How to operate HVAC and other building service systems to prevent the spread of the coronavirus (SARS-CoV-2) disease (COVID-19) in workplaces.
- Richard, M., A. Kok, D. de Meulder, T. M. Bestebroer, M. M. Lamers, N. M. A. Okba, M. Fentener van Vlissingen, B. Rockx, B. L. Haagmans, M. P. G. Koopmans, et al. 2020. SARS-CoV-2 is transmitted via contact and via the air between ferrets. Nature Communications 11 (1):1–6. doi:https://doi.org/10.1038/s41467-020-17367-2
- Richards, S., and M. Vassalos. 2020. COVID-19 amplifies local meat supply chain issues in South Carolina. Journal of Agriculture, Food Systems, and Community Development 10 (1):1–5. doi:https://doi.org/10.5304/jafscd.2020.101.001
- Riediker, M., and C. Monn. 2020. Simulation of SARS-CoV-2 aerosol emissions in the infected population and resulting airborne exposures in different indoor scenarios. Aerosol and Air Quality Research 20:200531.
- Rijn, C., G. A. Somsen, L. Hofstra, G. Dahhan, R. A. Bem, S. Kooij, and D. Bonn. 2020. Reducing aerosol transmission of SARS‐CoV‐2 in hospital elevators. Indoor Air 30 (6):1065–1066. doi:https://doi.org/10.1111/ina.12744
- Riley, E. C., G. Murphy, and R. L. Riley. 1978. Airborne spread of measles in a suburban elementary school. American Journal of Epidemiology 107 (5):421–32. doi:https://doi.org/10.1093/oxfordjournals.aje.a112560
- Riley, R., and E. Nardell. 1989. Clearing the air. The theory and application of ultraviolet air disinfection. The American Review of Respiratory Disease 139 (5):1286–94. doi:https://doi.org/10.1164/ajrccm/139.5.1286
- Risbeck, M. J., M. Z. Bazant, Z. Jiang, Y. M. Lee, K. H. Drees, and J. D. Douglas. 2021. Quantifying the tradeoff between energy consumption and the risk of airborne disease transmission for building HVAC systems. MedRxiv 2021.06.21.21259287.
- Rooney, C. M., J. McIntyre, L. Ritchie, and M. H. Wilcox. 2021. Evidence review of physical distancing and partition screens to reduce healthcare acquired SARS-CoV-2. Infection Prevention in Practice 3 (2):100144. doi:https://doi.org/10.1016/j.infpip.2021.100144
- Rothamer, D. A., S. Sanders, D. Reindl, T. H. Bertram, and D. Rothamer. 2020. Strategies to minimize SARS-CoV-2 transmission in classroom settings: Combined impacts of ventilation and mask effective filtration efficiency. MedRxiv 2020.12.31.20249101.
- Rudnick, S. N., and D. K. Milton. 2003. Risk of indoor airborne infection transmission estimated from carbon dioxide concentration. Indoor Air 13 (3):237–45. doi:https://doi.org/10.1034/j.1600-0668.2003.00189.x
- Sam Schwartz Consulting. 2020. Public transit and COVID-19 pandemic: Global research and best practices.
- Santarpia, J. L., D. N. Rivera, V. L. Herrera, M. J. Morwitzer, H. M. Creager, G. W. Santarpia, K. K. Crown, D. M. Brett-Major, E. R. Schnaubelt, M. J. Broadhurst, et al. 2020. Aerosol and surface contamination of SARS-CoV-2 observed in quarantine and isolation care. Scientific Reports 10 (1):12732. doi:https://doi.org/10.1038/s41598-020-69286-3
- Schuit, M., S. Ratnesar-Shumate, J. Yolitz, G. Williams, W. Weaver, B. Green, D. Miller, M. Krause, K. Beck, S. Wood, et al. 2020. Airborne SARS-CoV-2 is rapidly inactivated by simulated sunlight. The Journal of Infectious Diseases 222 (4):564–71. doi:https://doi.org/10.1093/infdis/jiaa334
- Setti, L., F. Passarini, G. De Gennaro, P. Barbieri, M. G. Perrone, M. Borelli, J. Palmisani, A. D. Gilio, P. Piscitelli, and A. Miani. 2020a. Airborne transmission route of COVID-19: Why 2 meters/6 feet of inter-personal distance could not be enough. International Journal of Environmental Research and Public Health 17 (8):2932. doi:https://doi.org/10.3390/ijerph17082932
- Setti, L., F. Passarini, G. De Gennaro, P. Barbieri, M. G. Perrone, M. Borelli, J. Palmisani, A. D. Gilio, V. Torboli, F. Fontana, et al. 2020b. SARS-Cov-2RNA found on particulate matter of Bergamo in Northern Italy: First evidence. Environmental Research 188:109754. doi:https://doi.org/10.1016/j.envres.2020.109754
- Shao, S., D. Zhou, R. He, J. Li, S. Zou, K. Mallery, S. Kumar, S. Yang, and J. Hong. 2021. Risk assessment of airborne transmission of COVID-19 by asymptomatic individuals under different practical settings. Journal of Aerosol Science 151:105661. doi:https://doi.org/10.1016/j.jaerosci.2020.105661
- Shen, J., and Z. Gao. 2019. Commuter exposure to particulate matters in four common transportation modes in Nanjing. Building and Environment 156:156–70. doi:https://doi.org/10.1016/j.buildenv.2019.04.018
- Shen, J., M. Kong, B. Dong, M. J. Birnkrant, and J. Zhang. 2021. A systematic approach to estimating the effectiveness of multi-scale IAQ strategies for reducing the risk of airborne infection of SARS-CoV-2. Building and Environment 200:107926. doi:https://doi.org/10.1016/j.buildenv.2021.107926
- Shen, Y., C. Li, H. Dong, Z. Wang, L. Martinez, Z. Sun, A. Handel, Z. Chen, E. Chen, M. H. Ebell, et al. 2020. Community outbreak investigation of SARS-CoV-2 transmission among bus riders in Eastern China. JAMA Internal Medicine 180 (12):1665. doi:https://doi.org/10.1001/jamainternmed.2020.5225
- Shi, J., Z. Wen, G. Zhong, H. Yang, C. Wang, B. Huang, R. Liu, X. He, L. Shuai, Z. Sun, et al. 2020. Susceptibility of ferrets, cats, dogs, and other domesticated animals to SARS-coronavirus 2. Science (New York, N.Y.) 368 (6494):1016–20. doi:https://doi.org/10.1126/science.abb7015
- Smither, S. J., L. S. Eastaugh, J. S. Findlay, and M. S. Lever. 2020. Experimental aerosol survival of SARS-CoV-2 in artificial saliva and tissue culture media at medium and high humidity. Emerging Microbes and Infections 9 (1):1415–17.
- Stabile, L., A. Pacitto, A. Mikszewski, L. Morawska, and G. Buonanno. 2021. Ventilation procedures to minimize the airborne transmission of viruses at schools. MedRxiv 2021.03.23.21254179.
- Steinberg, J., E. D. Kennedy, C. Basler, M. P. Grant, J. R. Jacobs, D. Ortbahn, J. Osburn, S. Saydah, S. Tomasi, and J. L. Clayton. 2020. COVID-19 outbreak among employees at a meat processing facility – South Dakota, March–April 2020. MMWR. Morbidity and Mortality Weekly Report 69 (31):1015–9. doi:https://doi.org/10.15585/mmwr.mm6931a2
- Stein-Zamir, C., N. Abramson, H. Shoob, E. Libal, M. Bitan, T. Cardash, R. Cayam, and I. Miskin. 2020. A large COVID-19 outbreak in a high school 10 days after schools’ reopening, Israel, May 2020. Eurosurveillance 25 (29):2001352. doi:https://doi.org/10.2807/1560-7917.ES.2020.25.29.2001352
- Stephens, B. 2012. Wells-Riley & HVAC Filtration for infectious airborne aerosols NAFA Foundation Report HVAC filtration and the Wells-Riley approach to assessing risks of infectious airborne diseases Final Report Prepared for: The National Air Filtration Association (NAFA).
- Stephens, B. 2013. HVAC filtration and the Wells-Riley approach to assessing risks of infectious airborne diseases. NAFA Foundation Report, (March):44.
- Stern, R. A., P. Koutrakis, M. A. G. Martins, B. Lemos, S. E. Dowd, E. M. Sunderland, and E. Garshick. 2021. Characterization of hospital airborne SARS-CoV-2. Respiratory Research 22 (1):1–8. doi:https://doi.org/10.1186/s12931-021-01637-8
- Sternberg, S. 2020. Chicken Plants Take Center Stage in Delaware Coronavirus Fight | Healthiest Communities | US News.
- Stewart, A., I. Kottasova, and A. Khaliq. 2020. Why meat processing plants have become Covid-19 hotbeds.
- Sun, C., and Z. Zhai. 2020. The efficacy of social distance and ventilation effectiveness in preventing COVID-19 transmission. Sustainable Cities and Society 62:102390. doi:https://doi.org/10.1016/j.scs.2020.102390
- Swinkels, K. 2020. SARS-CoV-2 superspreading events database.
- Szablewski, C. M., K. T. Chang, M. M. Brown, V. T. Chu, A. R. Yousaf, N. Anyalechi, P. A. Aryee, H. L. Kirking, M. Lumsden, E. Mayweather, et al. 2020. SARS-CoV-2 transmission and infection among attendees of an overnight camp – Georgia, June 2020. MMWR. Morbidity and Mortality Weekly Report 69 (31):1023–5. doi:https://doi.org/10.15585/mmwr.mm6931e1
- Sze To, G. N., and C. Y. H. Chao. 2010. Review and comparison between the Wells-Riley and dose-response approaches to risk assessment of infectious respiratory diseases. Indoor Air 20 (1):2–16. doi:https://doi.org/10.1111/j.1600-0668.2009.00621.x
- Tabatabaeizadeh, S. A. 2021. Airborne transmission of COVID-19 and the role of face mask to prevent it: A systematic review and meta-analysis. European Journal of Medical Research 26 (1):1. doi:https://doi.org/10.1186/s40001-020-00475-6
- Tan, L., B. Ma, X. Lai, L. Han, P. Cao, J. Zhang, J. Fu, Q. Zhou, S. Wei, Z. Wang, et al. 2020. Air and surface contamination by SARS-CoV-2 virus in a tertiary hospital in Wuhan, China. International Journal of Infectious Diseases 99:3–7. doi:https://doi.org/10.1016/j.ijid.2020.07.027
- Tang, J. W., L. C. Marr, Y. Li, and S. J. Dancer. 2021. Covid-19 has redefined airborne transmission. BMJ (Clinical Research ed.) 373:n913. doi:https://doi.org/10.1136/bmj.n913
- Tang, S., Y. Mao, R. M. Jones, Q. Tan, J. S. Ji, N. Li, J. Shen, Y. Lv, L. Pan, P. Ding, et al. 2020. Aerosol transmission of SARS-CoV-2? Evidence, prevention and control. Environment International 144:106039. doi:https://doi.org/10.1016/j.envint.2020.106039
- Teran, R. A., I. Ghinai, S. Gretsch, T. Cable, S. R. Black, S. J. Green, O. Perez, G. E. Chlipala, M. Maienschein-Cline, K. J. Kunstman, et al. 2020. COVID-19 Outbreak Among a University’s Men’s and Women’s Soccer Teams – Chicago, Illinois, July–August 2020. MMWR. Morbidity and Mortality Weekly Report 69 (43):1591–4. doi:https://doi.org/10.15585/mmwr.mm6943e5
- The Lancet Respiratory Medicine. 2020a. COVID-19 transmission – up in the air. The Lancet Respiratory Medicine 8 (12):1159.
- The Lancet Respiratory Medicine. 2020b. COVID-19 transmission – up in the air. The Lancet Respiratory Medicine 8 (12):1159.
- The New York Times. 2020a. Coronavirus in the U.S.: Latest map and case count – The New York Times. The New York Times, 1–23.
- The New York Times. 2020b. More than 100,000 U.S. coronavirus deaths are linked to nursing homes.
- To, K. K. W., O. T. Y. Tsang, W. S. Leung, A. R. Tam, T. C. Wu, D. C. Lung, C. C. Y. Yip, J. P. Cai, J. M. C. Chan, T. S. H. Chik, et al. 2020. Temporal profiles of viral load in posterior oropharyngeal saliva samples and serum antibody responses during infection by SARS-CoV-2: An observational cohort study. The Lancet. Infectious Diseases 20 (5):565–74. doi:https://doi.org/10.1016/S1473-3099(20)30196-1
- Tung, Y. C., and S. C. Hu. 2008. Infection risk of indoor airborne transmission of diseases in multiple spaces. Architectural Science Review 51 (1):14–20. doi:https://doi.org/10.3763/asre.2008.5103
- Tyson Foods Inc. 2020. Tyson Foods, Inc. Releases results from covid-19 testing at Wilkesboro, NC Plant.
- U.S. CDC and NIOSH. 2009. Basic upper-room ultraviolet germicidal irradiation guidelines for healthcare settings. Department of Health and Human Services Centers for Disease Control and Prevention National Institute for Occupational Safety and Health.
- U.S. CDC. 2019. Long-term care facilities | CDC.
- U.S. CDC. 2020a. CDC COVID data tracker.
- U.S. CDC. 2020b. Considerations for institutions of higher education.
- U.S. CDC. 2020c. COVID-19: Considerations for wearing masks.
- U.S. CDC. 2020d. How coronavirus spreads | CDC.
- U.S. CDC. 2020e. Know your travel risk.
- U.S. CDC. 2020f. Manufacturing Workers and Employers.
- U.S. CDC. 2021a. Community, work, and school | COVID-19 | CDC.
- U.S. CDC. 2021b. Considerations for communities of faith | CDC.
- U.S. CDC. 2021c. Considerations for restaurants and bars | COVID-19 | CDC.
- U.S. CDC. 2021d. COVID-19: Strategies for optimizing the supply of PPE | CDC.
- U.S. CDC. 2021e. COVID-19 decontamination and reuse of filtering facepiece respirators | CDC.
- U.S. CDC. 2021f. COVID-19 employer information for office buildings | CDC.
- U.S. CDC. 2021g. Guidance on management of coronavirus disease 2019 (COVID-19) in correctional and detention facilities | CDC.
- U.S. CDC. 2021h. How to protect yourself & others | CDC.
- U.S. CDC. 2021i. Interim infection prevention and control recommendations to prevent SARS-CoV-2 spread in nursing homes | CDC.
- U.S. CDC. 2021j. Operational Strategy for K-12 Schools through Phased Prevention | CDC.
- U.S. CDC. 2021k. Protect yourself when using transportation | CDC.
- U.S. CDC. 2021l. Safer travel ideas | CDC.
- U.S. CDC. 2021m. SARS-CoV-2 variant classifications and Definitions.
- U.S. CDC. 2021n. SARS-CoV-2 variants of concern | CDC.
- U.S. CDC. 2021o. Travelers returning from Cruise Ship and River Cruise Voyages | CDC.
- U.S. CMS. 2021. COVID-19 nursing home data.
- U.S. EIA. 2018. Air conditioning accounts for about 12% of U.S. home energy expenditures – Today in Energy – U.S. Energy Information Administration (EIA).
- U.S. EIA. 2020. 2018 Commercial buildings energy consumption survey data.
- U.S. EPA. 2020. Indoor Air and Coronavirus (COVID-19). U.S. Environmental Protection Agency.
- U.S. NIC. 2011. Jail design guide third edition.
- Ueki, H., Y. Furusawa, K. Iwatsuki-Horimoto, M. Imai, H. Kabata, H. Nishimura, and Y. Kawaoka. 2020. Effectiveness of face masks in preventing airborne transmission of SARS-CoV-2. MSphere 5 (5):e00637-20. doi:https://doi.org/10.1128/mSphere.00637-20
- United Nations. 2020. The Impact of COVID-19 on children.
- Univstats. 2020. Total Number of Faculty & Staff at U.S. Colleges | UnivStats.
- UW Madison. 2020. Badger Seal (Mask Fitter, Mask Sealer, Mask Brace).
- van Doremalen, N., T. Bushmaker, D. H. Morris, M. G. Holbrook, A. Gamble, B. N. Williamson, A. Tamin, J. L. Harcourt, N. J. Thornburg, S. I. Gerber, et al. 2020. Aerosol and surface stability of SARS-CoV-2 as compared with SARS-CoV-1. New England Journal of Medicine 382 (16):1564–7. doi:https://doi.org/10.1056/NEJMc2004973
- Viner, R. M., O. T. Mytton, C. Bonell, G. J. Melendez-Torres, J. Ward, L. Hudson, C. Waddington, J. Thomas, S. Russell, F. Van Der Klis, et al. 2020. Susceptibility to SARS-CoV-2 infection among children and adolescents compared with adults: A systematic review and meta-analysis. JAMA Pediatrics 175 (2):143–56.
- VirusLights. 2021. LIGHTDIS upper air fixtures – viruslights.
- Vuorinen, V., M. Aarnio, M. Alava, V. Alopaeus, N. Atanasova, M. Auvinen, N. Balasubramanian, H. Bordbar, P. Erästö, R. Grande, et al. 2020. Modelling aerosol transport and virus exposure with numerical simulations in relation to SARS-CoV-2 transmission by inhalation indoors. Safety Science 130:104866. doi:https://doi.org/10.1016/j.ssci.2020.104866
- Wallace, M., L. Hagan, K. G. Curran, S. P. Williams, S. Handanagic, A. Bjork, S. L. Davidson, R. T. Lawrence, J. McLaughlin, M. Butterfield, et al. 2020a. COVID-19 in correctional and detention facilities – United States, February–April 2020. MMWR. Morbidity and Mortality Weekly Report 69 (19):587–90. doi:https://doi.org/10.15585/mmwr.mm6919e1
- Wallace, M., M. Marlow, S. Simonson, M. Walker, N. Christophe, O. Dominguez, L. Kleamenakis, A. Orellana, D. Pagan-Pena, C. Singh, et al. 2020b. Public health response to COVID-19 cases in correctional and detention facilities – Louisiana, March–April 2020. MMWR. Morbidity and Mortality Weekly Report 69 (19):594–8. doi:https://doi.org/10.15585/mmwr.mm6919e3
- Walsh, K. A., K. Jordan, B. Clyne, D. Rohde, L. Drummond, P. Byrne, S. Ahern, P. G. Carty, K. K. O'Brien, E. O'Murchu, et al. 2020. SARS-CoV-2 detection, viral load and infectivity over the course of an infection. The Journal of Infection 81 (3):357–71. doi:https://doi.org/10.1016/j.jinf.2020.06.067
- Waltenburg, M. A., T. Victoroff, C. E. Rose, M. Butterfield, R. H. Jervis, K. M. Fedak, J. A. Gabel, A. Feldpausch, E. M. Dunne, C. Austin, et al. 2020. Update: COVID-19 among workers in meat and poultry processing facilities – United States, April–May 2020. MMWR. Morbidity and Mortality Weekly Report 69 (27):887–92. doi:https://doi.org/10.15585/mmwr.mm6927e2
- Wang, J., and G. Du. 2020. COVID-19 may transmit through aerosol. Irish Journal of Medical Science 189 (4):1143–4. doi:https://doi.org/10.1007/s11845-020-02218-2
- Wei, J., and Y. Li. 2016. Airborne spread of infectious agents in the indoor environment. American Journal of Infection Control 44 (9 Suppl):S102–S108. doi:https://doi.org/10.1016/j.ajic.2016.06.003
- Weissberg, D., J. Böni, S. K. Rampini, V. Kufner, M. Zaheri, P. W. Schreiber, I. A. Abela, M. Huber, H. Sax, and A. Wolfensberger. 2020. Does respiratory co-infection facilitate dispersal of SARS-CoV-2? Investigation of a super-spreading event in an open-space office. Antimicrobial Resistance and Infection Control 9 (1):191.
- Wells, W. F. 1955. Airborne contagion and air hygiene. An ecological study of droplet infections. JAMA 159 (1):90.
- WHO. 2020a. Air travel advice.
- WHO. 2020b. Coronavirus disease (COVID-19): How is it transmitted?
- WHO. 2020c. Modes of transmission of virus causing COVID-19: Implications for IPC precaution recommendations.
- WHO. 2020d. Multisystem inflammatory syndrome in children and adolescents with COVID-19. https://www.who.int/publications/i/item/multisystem-inflammatory-syndrome-in-children-and-adolescents-with-covid-19.
- WHO. 2020e. Report of the WHO-China Joint Mission on Coronavirus Disease 2019 (COVID-19).
- WHO. 2020f. Transmission of SARS-CoV-2: Implications for infection prevention precautions.
- WHO. 2020g. What we know about COVID-19 transmission in schools.
- WHO. 2021a. WHO Coronavirus Disease (COVID-19) Dashboard | WHO Coronavirus Disease (COVID-19) Dashboard.
- WHO. 2021b. WHO Guidelines.
- William, S. D., B. J. Polidoro, D. G. Poppendieck, and S. J. Emmerich. 2020. Fate and Transport of Indoor Microbiological Aerosols (FaTIMA).
- Wilson, E., C. V. Donovan, M. Campbell, T. Chai, K. Pittman, A. C. Seña, A. Pettifor, D. J. Weber, A. Mallick, A. Cope, et al. 2020. Multiple COVID-19 clusters on a university campus — North Carolina, August 2020. MMWR. Morbidity and Mortality Weekly Report 69 (39):1416–8. doi:https://doi.org/10.15585/mmwr.mm6939e3
- Wilson, N., S. Corbett, and E. Tovey. 2020a. Airborne transmission of covid-19. Bmj 370:m3206. doi:https://doi.org/10.1136/bmj.m3206
- Wilson, N., S. Corbett, and E. Tovey. 2020b. Airborne transmission of covid-19. BMJ 370:m3206. doi:https://doi.org/10.1136/bmj.m3206
- Wölfel, R., V. M. Corman, W. Guggemos, M. Seilmaier, S. Zange, M. A. Müller, D. Niemeyer, T. C. Jones, P. Vollmar, C. Rothe, et al. 2020. Virological assessment of hospitalized patients with COVID-2019. Nature 581 (7809):465–9. doi:https://doi.org/10.1038/s41586-020-2196-x
- Xiao, S., Y. Li, M. Sung, J. Wei, and Z. Yang. 2018. A study of the probable transmission routes of MERS-CoV during the first hospital outbreak in the Republic of Korea. Indoor Air 28 (1):51–63. doi:https://doi.org/10.1111/ina.12430
- Xu, P., H. Qian, T. Miao, H. Yen, H. Tan, B. Cowling, and Y. Li. 2020. Transmission routes of Covid-19 virus in the Diamond Princess Cruise ship. MedRxiv 2020.04.09.20059113.
- Xu, P., J. Peccia, P. Fabian, J. W. Martyny, K. P. Fennelly, M. Hernandez, and S. L. Miller. 2003. Efficacy of ultraviolet germicidal irradiation of upper-room air in inactivating airborne bacterial spores and mycobacteria in full-scale studies. Atmospheric Environment 37 (3):405–19. doi:https://doi.org/10.1016/S1352-2310(02)00825-7
- Xu, P., W. Jia, H. Qian, S. Xiao, T. Miao, H.-L. Yen, H. Tan, M. Kang, B. J. Cowling, and Y. Li. 2021. Lack of cross-transmission of SARS-CoV-2 between passenger’s cabins on the Diamond Princess Cruise ship. Building and Environment 198:107839. doi:https://doi.org/10.1016/j.buildenv.2021.107839
- Yang, X., C. Ou, H. Yang, L. Liu, T. Song, M. Kang, H. Lin, and J. Hang. 2020. Transmission of pathogen-laden expiratory droplets in a coach bus. Journal of Hazardous Materials 397:122609. doi:https://doi.org/10.1016/j.jhazmat.2020.122609
- Yao, M., L. Zhang, J. Ma, and L. Zhou. 2020. On airborne transmission and control of SARS-Cov-2. The Science of the Total Environment 731:139178. doi:https://doi.org/10.1016/j.scitotenv.2020.139178
- Yates, T. A., P. Y. Khan, G. M. Knight, J. G. Taylor, T. D. McHugh, M. Lipman, R. G. White, T. Cohen, F. G. Cobelens, R. Wood, et al. 2016. The transmission of Mycobacterium tuberculosis in high burden settings. The Lancet. Infectious Diseases 16 (2):227–38. doi:https://doi.org/10.1016/S1473-3099(15)00499-5
- Yoon, J. G., J. Yoon, J. Y. Song, S. Y. Yoon, C. S. Lim, H. Seong, J. Y. Noh, H. J. Cheong, and W. J. Kim. 2020. Clinical significance of a high SARS-CoV-2 viral load in the Saliva. Journal of Korean Medical Science 35 (20):e195. doi:https://doi.org/10.3346/jkms.2020.35.e195
- Yoon, Y., K.-R. Kim, H. Park, S. Kim, and Y.-J. Kim. 2020. Stepwise school opening and an impact on the epidemiology of COVID-19 in the children. Journal of Korean Medical Science 35 (46):e414. doi:https://doi.org/10.3346/jkms.2020.35.e414
- You, R., C. H. Lin, D. Wei, and Q. Chen. 2019. Evaluating the commercial airliner cabin environment with different air distribution systems. Indoor Air 29 (5):840–53. doi:https://doi.org/10.1111/ina.12578
- Yu, I. T. S., Y. Li, T. W. Wong, W. Tam, A. T. Chan, J. H. W. Lee, D. Y. C. Leung, and T. Ho. 2004. Evidence of airborne transmission of the severe acute respiratory syndrome virus. New England Journal of Medicine 350 (17):1731–9. doi:https://doi.org/10.1056/NEJMoa032867
- Zemouri, C., S. F. Awad, C. M. C. Volgenant, W. Crielaard, A. M. G. A. Laheij, and J. J. de Soet. 2020. Modeling of the transmission of coronaviruses, measles virus, influenza virus, mycobacterium tuberculosis, and legionella pneumophila in dental clinics. Journal of Dental Research 99 (10):1192–8. doi:https://doi.org/10.1177/0022034520940288
- Zhang, J. 2020. Integrating IAQ control strategies to reduce the risk of asymptomatic SARS CoV-2 infections in classrooms and open plan offices. Science and Technology for the Built Environment 26 (8):1013–8. doi:https://doi.org/10.1080/23744731.2020.1794499
- Zhang, R., Y. Li, A. L. Zhang, Y. Wang, and M. J. Molina. 2020. Identifying airborne transmission as the dominant route for the spread of COVID-19. Proceedings of the National Academy of Sciences of the United States of America 117 (26):14857–63.
- Zhang, S., and Z. Lin. 2020. Dilution-based evaluation of airborne infection risk-thorough expansion of Wells-Riley model 2 running head: Thorough expansion of Wells-Riley model. MedRxiv 2020.10.03.20206391.
- Zhang, Z., T. Han, K. H. Yoo, J. Capecelatro, A. L. Boehman, and K. Maki. 2021. Disease transmission through expiratory aerosols on an urban bus. Physics of Fluids 33 (1):015116. doi:https://doi.org/10.1063/5.0037452
- Zhao, B., Y. Liu, and C. Chen. 2020. Air purifiers: A supplementary measure to remove airborne SARS-CoV-2. Building and Environment 177:106918. doi:https://doi.org/10.1016/j.buildenv.2020.106918
- Zhao, M., L. Liao, W. Xiao, X. Yu, H. Wang, Q. Wang, Y. L. Lin, F. S. Kilinc-Balci, A. Price, L. Chu, et al. 2020. Household materials selection for homemade cloth face coverings and their filtration efficiency enhancement with triboelectric charging. Nano Letters 20 (7):5544–52. doi:https://doi.org/10.1021/acs.nanolett.0c02211
- Zhao, S., Z. Zhuang, J. Ran, J. Lin, G. Yang, L. Yang, and D. He. 2020. The association between domestic train transportation and novel coronavirus (2019-nCoV) outbreak in China from 2019 to 2020: A data-driven correlational report. Travel Medicine and Infectious Disease 33:101568. doi:https://doi.org/10.1016/j.tmaid.2020.101568
- Zheng, R., Y. Xu, W. Wang, G. Ning, and Y. Bi. 2020. Spatial transmission of COVID-19 via public and private transportation in China. Travel Medicine and Infectious Disease 34:101626. doi:https://doi.org/10.1016/j.tmaid.2020.101626
- Zheng, S., J. Fan, F. Yu, B. Feng, B. Lou, Q. Zou, G. Xie, S. Lin, R. Wang, X. Yang, et al. 2020. Viral load dynamics and disease severity in patients infected with SARS-CoV-2 in Zhejiang province, China, January-March 2020: Retrospective cohort study. The BMJ 369:m1443.
- Zhou, L., M. Yao, X. Zhang, B. Hu, X. Li, H. Chen, L. Zhang, Y. Liu, M. Du, B. Sun, et al. 2021. Breath-, air- and surface-borne SARS-CoV-2 in hospitals. Journal of Aerosol Science 152:105693. doi:https://doi.org/10.1016/j.jaerosci.2020.105693
- Zietsman, M., L. T. Phan, and R. M. Jones. 2019. Potential for occupational exposures to pathogens during bronchoscopy procedures. Journal of Occupational and Environmental Hygiene 16 (10):707–16. doi:https://doi.org/10.1080/15459624.2019.1649414