
 ?Mathematical formulae have been encoded as MathML and are displayed in this HTML version using MathJax in order to improve their display. Uncheck the box to turn MathJax off. This feature requires Javascript. Click on a formula to zoom.
Abstract
The design, fabrication, and experimental characterization of a counterflow Micro-pin array Polymer Heat eXchanger (MPHX) for HVAC applications is described. The design consists of water flow through microscale pin array plates, and airflow paths in a counterflow direction through adjacent rectangular channels. When compared to a Finned Tube Heat eXchanger (FTHX), the water plates take the place of fins and the crossflow tube bank is eliminated. The MPHX is fabricated by 3 D printing using a digital light synthesis method. A correlation-based model is developed and used to explore the parametric space to arrive at a baseline MPHX core geometry. Mechanical and fluidic simulations are performed on the baseline geometry to further develop the design. A sub-scale MPHX with a nominal cross duct area of 10.1 cm × 20.3 cm is designed and fabricated. Its thermal performance over a range of air and water flow rates corresponding to heat capacity rate ratios in the range of 0.25–1 is investigated. Results show that the effectiveness varies from 0.65 to 0.95 corresponding to a of 1 to 0.25. The experimental data are used to validate a correlation-based thermo-fluidic model of the MPHX. The validated model is further used to compare the performance advantages of the MPHX design over a FTHX. For a given heat exchanger volume and thermo-fluidic conditions, the MPHX transfers 55% more thermal energy when compared to a FTHX at comparable air-side pressure drops.
Introduction
Air conditioning in the Unites States accounts for about 6% of electricity usage with an annual cost of around $29 billion and 117 million metric tons of associated CO2 emission per year (U.S. Department of Energy Citation2019). Refrigerant leakage has an additional detrimental impact since the most commonly used refrigerants today, such as R-22, have high global warming potentials (California ARB Citation2019). Regulatory acts and incentives are in place to phase out high GWP refrigerants. Due to the flammability and/or toxicity concerns associated with low GWP and natural refrigerants, a potential system could consist of refrigerant contained in hermetically factory-sealed heat pump packages outside the built environment and a secondary loop to transfer heat to air within the built environment via central or distributed water coils. The addition of a secondary heat exchange loop between the refrigerant and air introduces inefficiencies in HVAC systems that need to be minimized by the use of high effectiveness heat exchangers. The focus of this work is on the development of a high effectiveness secondary loop heat exchanger in place of conventional water coils.
Heat exchangers can be classified as counterflow or crossflow depending on the direction of passage of fluid within the Heat eXchanger (HX). In a counterflow HX, the most efficient configuration, hot and cold fluids flow in opposite directions. The performance of the HX is defined in terms of effectiveness, the ratio of actual heat transfer rate to the maximum possible heat transfer rate, the latter of which is attained in an infinitely long counterflow for consistency HX. Thus, a higher effectiveness HX can transfer the same amount of heat in a smaller size. The HX flow configuration does not matter as much for a refrigerant-to-air evaporator HX wherein refrigerant undergoes phase change (boiling) since the effectiveness is independent of the refrigerant side thermal performance under saturation conditions. However, the configuration of a water-to-air HX is critically important in determining its effectiveness. In a typical finned-tube water coil HX, a cross-counter flow configuration is used wherein water flows perpendicular to airflow in rows of tubes spaced in several passes; the progression of water through the tube rows occurs counter to the direction of airflow. Fins are used around the tubes on the air side to enhance surface area. Such a cross-counter flow configuration is less effective than counterflow for consistency but is easier to manufacture. The effectiveness of current state-of-the-art chilled water-to-air HXs, with a chilled water and air inlet temperatures of 45 °F and 80 °F, respectively, is about 0.7 for a reasonable pressure drop across the coil (under 100 Pa). The operating flow rates are typically selected to result in a 10 °F increase in chilled water temperature at the exit (Emergent Coils Citation2021).
FTHXs are prone to performance degradation due to either air side clogging by dirt, dust, and other pollutants, or water side corrosion and deposition of dissolved minerals on copper tubes. As identified by researchers (Field Citation2002; Goodway Technologies Corporation Citation2018), organic acids and even regular household cleaners, solvents, paints, and carpet glue can travel into the air conditioning system and pass across the copper coil in the Air Handler (AH). The condensate on the coil provides a suitable environment for the mix of chemicals to initiate a reaction (known as formicary corrosion) with copper and form holes that branch into several tunnels, of which a few penetrate into the tube wall resulting in leakage. In order to overcome corrosion problems, HVAC industry leaders proposed solutions like tube tin coating (Carrier Citation2007), adopting oxygen free copper (Fujitsu Citation2015), replacing copper with aluminum tubes (Trane Citation2007; International Comfort Products Citation2019), or annual maintenance by washing the FTHXs with a non-acidic, non-caustic cleaning solution (Goodway Technologies Corporation Citation2019).
To address corrosion problems, researchers have investigated use of all polymer FTHXs for HVAC applications, especially in corrosive environments (Malik and Bullard Citation2005; Cheng and Geld Citation2005; Park and Jacobi Citation2008; Chen, Li, and Guo Citation2009). The use of thin-walled plastics is viable for high effectiveness HXs because the dominant impediment to heat transfer in the air handler HX is on the air side. Utilizing polymers for HXs enables the use of simpler and more cost-effective manufacturing techniques like injection molding and extrusion. Plastics are more versatile and cheaper than metals, and have good chemical stability and corrosion resistance (T’Joen et al. Citation2009). As a feasibility study on polymer heat exchangers in HVAC applications, Malik and Bullard (Citation2005) modeled the effect of FTHX material on the system performance for both heating and cooling applications that coupled a 1 Ton vapor compression system (R-410A) with a secondary loop (water). The results showed that in order for an optimally configured polymer HX to achieve thermal performance similar to a copper FTHX, it would occupy a volume of 20 times and 10 times larger, respectively, for heating and cooling applications compared to the metallic counterpart.
Lowrey, Hughes, and Sun (Citation2021) compared the performance of two identical crossflow air-air heat exchangers, one constructed of aluminum, the other from a thermoplastic (polylactic acid). The polymer prototype was constructed with Fused Deposition Modeling (FDM). The thermal capacities were similar in dry conditions, while under wet operating conditions, the capacity was overall higher for the aluminum model. The thermal and dehumidification capacities of the aluminum prototype exceeded those of the polymer prototype by up to 22% and 38%, respectively. Despite the limitations observed under wet conditions, the authors noted that further refinement of the design and better manufacturing quality can help improve the performance of the polymer heat exchanger.
Hein and Mortean (Citation2021) investigated the potential of different 3 D printing techniques for creating an air-water crossflow heat exchanger. The heat exchanger consisted of circular channels for fluid flow 2 mm in diameter and 64 mm long, with overall heat exchanger core dimensions of 64 mm × 64 mm × 72.5 mm. An overall heat transfer coefficient of 194 W/m2-K was attained. The authors used both FDM and Selective Laser Sintering (SLS) to manufacture prototypes. While the prototype made with FDM had issues with leaks, the model made with SLS (from Polyamide 2200) exhibited no leaks during testing, and the authors noted the potential of this technology for creating polymer heat exchangers.
Extended surfaces are not generally effective due to the very low thermal conductivity of polymers. Chen, Li, and Guo (Citation2009) implemented two modified types of polypropylene with thermally conductive filler particles resulting in enhanced thermal conductivities of 2.3 and 16.5 W/m-K to manufacture FTHXs through injection molding. The manufactured FTHXs had air-side inlet cross-section dimensions of 245 mm × 240 mm and a depth along the airflow of 240 mm. As the baseline, a third FTHX was made by commercially available polypropylene that has a thermal conductivity of 0.2 W/m-K. The tube and fin dimensions were optimized by parametric studies of fin height, fin thickness, and spacing between fins while considering the dimensional tolerance limitations posed by the injection molding technology for polypropylene. Manufactured FTHXs had 10 mm ID tubes with 2 mm wall thickness and equal longitudinal and transverse pitches of 28 mm; fins were 1 mm thick spaced 5 mm apart. At three different airflow rates, the experimental results showed that the FTHX with a thermal conductivity of 16.5 W/m-K achieved an overall heat transfer coefficient of about 34 W/m2-K whereas the FTHX with 2.3 and 0.2 W/m-K thermal conductivities resulted in 19 and 9 W/m2-K, respectively. With the help of experimental data, the authors validated their empirical model and investigated the effect of further enhancement in thermal conductivity on overall heat transfer coefficient. The results showed that for the studied FTHX geometry, a thermal conductivity of about 20 W/m-K was a threshold over which the impact of improving thermal conductivity had a negligible contribution in improving FTHX thermal performance.
Cheng and Geld (Citation2005) used extruded polymer plates to propose an innovative HX geometry for water-to-air HXs, while still based on a crossflow configuration. The authors employed extruded plates (400 mm × 76.3 mm) to make a compact HX by placing 48 of plates next to each other with 2 mm wall-to-wall spacing. The airflow passage was along the 76.3 mm width of the extruded plates. Inside each extruded plate, there were 1.37 mm × 1.47 mm parallel channels separated by a 0.436 mm wall thickness. The plates were manifolded at the ends of the 400 mm side with appropriate headers such that inlet water flowed through 24 plates and returned by passing through the next 24 plates. For a constant water inlet temperature of 24 °C and an air inlet temperature of 80 and 90 °C and an air side Reynolds number ranging from 1200 to 2600, an overall heat transfer coefficient of 80 to 130 W/m2-K was obtained in the polymer compact HX.
Arie et al. (Citation2017) created a novel thin-walled water-to-air heat exchanger by line welding thin layers of HDPE. Two 150-μm thick sheets were welded to create a single 15.5 cm × 29 cm plate, through which water flows in a primarily crossflow fashion. The water entered at one corner and followed a multi-pass path down one half of the plate, then reversed and returned on the other side in a similar trajectory. The plates could then be scaled up by stacking them together, with air flowing between the plates. The authors performed testing on a single plate, with the airflow duct cross-section parallel to the 29 cm length of the plate. The air and water inlet temperatures were held constant at 22.5 °C and 50 °C, respectively. For a water flowrate of 12.5 mL/s and air flowrates ranging from 3 to 24 L/s (corresponding to an air side Reynolds number ranging from about 1000–10000), the authors obtained an air pressure drop from 13 to 530 Pa and an overall heat transfer coefficient from 35 to 120 W/m2-K.
Cevallos (Citation2014) designed and tested a novel webbed tube liquid-to-gas polymer-composite heat exchanger. One layer consisted of multiple pipes connected by webbing. Multiple layers could be stacked together (with spacing to allow for gas flow). Liquid flowed through the pipes, while gas flowed in a serpentine path between the staggered pipes. Although it was mentioned that the heat exchanger could be arranged in a counterflow fashion, testing was done with a crossflow setup. Additionally, the liquid headers would have to be designed so as to not interfere with gas flow for the counterflow configuration. Designs for 3 D printing and injection molding were made with different materials, including filled and unfilled polymers. For the injection molded design, the pipes had an inner diameter of 4.76 mm, a wall thickness of 1.59 mm, and a center-to-center spacing along the webbing of 9.97 mm. The layers had a center-to-center spacing of 10.31 mm. Each webbed sheet was 59.31 mm by 36.58 mm. The authors concluded that medium to high thermal conductivity in composites is required in achieving higher heat transfer rates in liquid-to-gas HXs; however, in liquid-to-liquid HXs the thermal conductivity effect on heat transfer rate could be neglected for conductivities over 5 W/m-K.
Burns and Jachuck (Citation2001) studied condensation of water vapor in a liquid-to-gas crossflow heat exchanger, with condensation occurring in the humid gas stream. The heat exchanger consisted of seven corrugated poly-ether-ether-ketone (PEEK) sheets stacked at alternating angles to form a crossflow heat exchanger. Each sheet was 13.5 cm × 13.5 cm and 53 μm thick with a 1 mm amplitude. For the experiments, humid air and water were used. Humid air inlet temperatures ranged from 32 to 37 °C with an estimated Reynolds number varying from 55 to 550. The humidity of air at the inlet was near saturation (88–97% relative humidity). Water entered at temperatures ranging from 20 to 25 °C with an estimated Reynolds number varying from 2 to 25. The authors observed drop-wise condensation in the air stream. The heat transfer coefficients on the gas side ranged from 60 to 500 W/m2-K. They found that the gas flow rate did not have a significant effect on heat transfer, but it did impact the amount of condensate inside the heat exchanger. The liquid flow rate, on the other hand, had a greater impact on the heat transfer.
Tiwari et al. (Citation2019) developed and tested a water-to-water compact tubular manifold microchannel heat exchanger. The manifold was additively manufactured from ABS plastic to facilitate flow distribution on the shell side, and was used in conjunction with a commercial tube with fins on the outer surface and helical grooves on the inner surface. The water flowrate was varied from 189 g/s to 806 g/s and 9 g/s to 100 g/s on the tube and shell sides, respectively. The water inlet temperatures were fixed at 15 °C for the tube side and 30 °C for the shell side. An overall heat transfer coefficient of up to 25,000 W/m2-K was obtained in experiments, which is about an order of magnitude higher than that of traditional shell and tube heat exchangers. They mentioned the potential such a design has in larger scale to allow for more compact heat exchangers, but also the need to consider modifying the design to reduce the pressure drop, which ranged from about 0.1 to 0.7 bar on the shell side.
There are comprehensive literature reviews on recent developments in polymer heat exchangers (Cevallos et al. Citation2012; Chen et al. Citation2016; Hussain et al. Citation2017; Deisenroth et al. Citation2018; Klein et al. Citation2018) and number of commercial companies and startups (TMW (Citation2019) in France, Aetna Plastics Corp (Citation2019)/Calorplast in Germany, HeatMatrix (Citation2019) in Netherland, Kansetu (Citation2019) in Japan, PolyCoil (Citation2019) in Canada, and Fluorotherm (Citation2019) and AMETEK Fluoropolymer Products (Citation2019) and Treau (Citation2019) in the USA) have products in the market for different applications. However, to the best of the authors’ knowledge, none of the prior efforts have focused on developing a concept based on the most efficient HX configuration, i.e., counterflow for a liquid-to-gas HX. This may be mainly due to manufacturing limitations and the fact that, based on conventional fabrication techniques, liquid side bulky headers may obstruct the gas side flow passages.
In this study, the design of a novel, counterflow Additively Manufactured (AM) polymer heat exchanger for HVAC applications is presented. Advances in microchannel technology and AM of plastics are leveraged to develop a high-effectiveness MPHX for use as central and distributed fan coil units. The performance of the proposed counterflow MPHX design is assessed using a correlation-based thermo-fluidic model. A small-scale MPHX for a nominal duct size of 10.2 cm × 20.3 cm (4 in × 8 in) and estimated heat load of up to 400 W is 3 D printed and its thermal performance is characterized over a range of water and airflow rates (Rasouli et al. Citation2020). The experimental data are used to validate the thermo-fluidic model. The validated model is further used to compare the performance advantages of the MPHX design relative to a FTHX.
MPHX concept
An illustration of the traditional cross-counter current FTHX is shown in . The progression of water flow between rows of tubes in a multi-row FTHX is in a counterflow direction with airflow, however as seen in , the flow direction of water while exchanging heat with air stream is in the less efficient crossflow configuration. Fins made of aluminum are used to reduce the resistance to heat transfer on the air side. The proposed air-to-water MPHX placed within a rectangular cross-section duct is shown in . The water distributor and collector manifolds are located at the either ends of the MPHX and outside the air duct, directing water into and from each plate through designated openings. As depicted in the cut-away view in , the MPHX consists of several water plates, each consisting of flow passages, spaced a certain distance () apart, that run along the duct. Return air flows in the duct around and in between the plates counter to the water flow within the plates. To provide mechanical rigidity to the core, straight rectangular support structures are located on the outer surface of the water plates in the air side (see inset in ).
Fig. 1. (a) Illustration of cross-counter current FTHX design (top view). (b) Conceptual isometric model of the MPHX assembly place in a rectangular air duct, the inset picture depicts air and water flow passages, yellow arrows denote air and blue arrow denote water flow. Cut-away on water plates show the pin fins architecture within the water plates. Also shown are finned support structures on the air passage side.
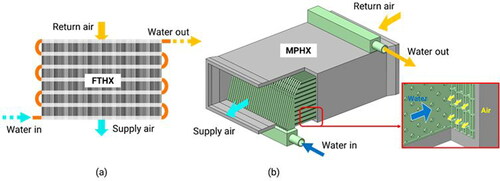
The water stream flows through an array of microscale pin fins within each plate. A pin fin architecture (see detail in ) is used for the microscale regions since it lends itself to a higher heat transfer rate and better flow distribution than parallel microchannels (Tuckerman Citation1984; Peles et al. Citation2005). When compared with the FTHX, the MPHX architecture has the following differences: (a) near counterflow design of air and water streams as opposed to a cross-counter design of FTHX, (b) elimination of crossflow tubes and associated form drag, and (c) elimination of fin resistance in FTHX by replacing fins with microchannel water plates.
MPHX performance model and design
A simplified thermo-fluidic model for a MPHX was developed in Engineering Equation Solver (EES, F-chart Inc.). Classical assumptions including negligible heat loss to the environment, constant properties, and negligible axial conduction were used. The heat transfer rate from the hot to the cold stream is obtained using the effectiveness- Number of Transfer Units (NTU) approach as
(1)
(1)
where ε is the effectiveness,
is the minimum heat capacity rate and Thi and Tci are the inlet temperatures of the air and water streams, respectively.
The effectiveness in EquationEquation 1(1)
(1) is obtained as a function of NTU and heat capacity rate ratio,
as Incropera et al. (Citation1996),
(2)
(2)
The heat capacity rate ratio is defined as the ratio of the minimum heat capacity rate stream to the maximum heat capacity rate stream in the heat exchanger:
(3)
(3)
The heat capacity rates on the cold and hot sides are determined as
(4)
(4)
(5)
(5)
where subscripts
and
denote cold (water) and hot (air) streams. The
is defined as:
(6)
(6)
where the overall heat transfer coefficient can be obtained from the convective resistances on the hot (Rconv,h) and cold sides (Rconv,c) and the conductive resistance (Rcond)
(7)
(7)
The conductive and convective thermal resistances can be obtained as:
(8)
(8)
and
(9)
(9)
The overall surface efficiency in EquationEquation (9)(9)
(9) is determined as: (Incropera et al. Citation1996),
(10)
(10)
where
is the fin surface area, and
is the total heat transfer area found by summation of
and the exposed surface area at the base of fin. The fin efficiency,
is obtained from relations in literature (Incropera et al. Citation1996) that are also available as embedded functions in EES. The heat transfer coefficient in EquationEquation (9)
(9)
(9) ,
of either cold or hot side flow needs to be estimated using predictive correlations related to the geometry that was used on the either side of the HX. In the MPHX design, as shown in , flow goes through rectangular straight channel passages. Hence, the “duct flow” embedded function provided in EES was used to obtain
in a rectangular channel. This function calculates Reynolds number number in a rectangular cross section channel and determines if the flow is laminar or turbulent and uses applicable correlations to calculate Nusselt number and friction factor as dimensionless numbers and consequently determines
and pressure drop values (Nellis and Klein Citation2009). On the water side, the Nusselt number in the pin array was estimated using correlations developed by Rasouli, Naderi, and Narayanan (Citation2018):
(11)
(11)
where
and
are based on the hydraulic diameter calculated at the minimum flow area within the pin array. EquationEquation (11)
(11)
(11) correlates the heat transfer in a pin array geometry with longitudinal and transverse pitch ratios (
), and aspect ratio (
). The corresponding
can be calculated from:
(12)
(12)
where DAmin is the hydraulic diameter based on the minimum cross-sectional area for water flow in the pin array.
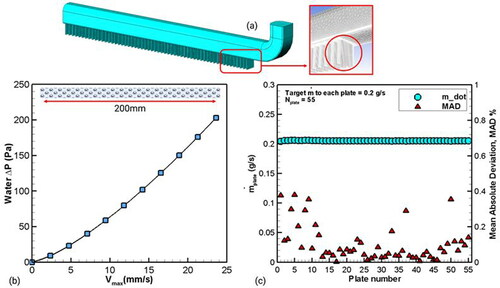
The above relations were solved in EES for a range of geometric variables of interest in the design of the MPHX indicated in . Several parameters play a role in determining the overall size and performance of the MPHX, such as cross-sectional dimensions of the duct carrying return air, water plate spacing, fin spacing, water plate pin fin geometry design, hot and cold flow inlet temperatures, heat load capacity, MPHX material, and 3 D printing technology limitations. The baseline geometry was determined through a parametric study with consideration of the fabrication constraints of the digital light synthesis method. The fabrication constraints of the minimum feature size (Hpin, thfin) and wall thickness (thwall) were determined by initial part-scale prints.
Fig. 2. Geometrical parameters used for the parametric study: (a) Side view of the MPHX showing water plates and air channels next to each other, (b) Top view of the pin array on water side.
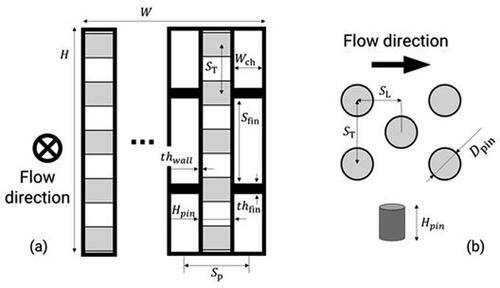
shows baseline values of the MPHX design parameters. The range of selected parameters that were varied one at a time while keeping the rest of the parameters at their baseline values for the parametric study is also listed in . For the parametric study, the width and height of the MPHX was fixed at 61 cm × 61 cm (2 ft × 2 ft). Inlet temperatures of 26.7 °C (80 °F) and 7.2 °C (45 °F) were assumed for air and chilled water, respectively. The airflow rate was fixed at 42.5 m3/min (1500 CFM) and the water flow rate was set to 22.7 LPM (6 GPM). These values would present a typical flow condition in a single-family home HVAC system with an approximately 10.5 kW (3 Ton) thermal load. For the sake of simplicity, the incoming air was assumed to be dry and condensation was not modeled.
Table 1. Fixed and varied parameters in the MPHX design.
The variation of MPHX effectiveness and air side pressure drop due to variation in the air channel width () is shown in . A decrease in Wch from 3 mm to 0.8 mm also results in an increase in the number of hot-cold pairs in the core of the MPHX from 127 to 238, since the cold side dimensions and total width, W, are kept constant. It is seen that reducing the
from 3 mm to 0.8 mm would significantly increase the effectiveness from 0.65 to 0.95, but at the same time exponentially increase the air side pressure drop from 30 Pa to 530 Pa. Due to the constraint of fan power, a practical channel width (
) that keeps the air side pressure drop to under 100 Pa (0.4 in. of H2O) is typically desired, as indicated by the blue zone in . From MPHX thermal performance stand point, the
selected shall be small enough to have an efficient design;
yellow zone in . It should be noted that for the range of
variation, the air channel Re was less than 1000, hence the flow was laminar. The main reason for observed enhancement in heat transfer was the inverse relationship between
and the channel hydraulic dimeter (
), such that a smaller
resulted in a higher
for a constant
Viable Wch values that can satisfy both high
and low
is are noted with a black box shown in , and range between 1.6 mm to 1.8 mm.
Fig. 3. (a) Parametric effect of variation of on MPHX effectiveness and air side pressure drop (b) Parametric effect of variation of HX length on MPHX effectiveness and air side pressure drop (c) Parametric effect of HX material conductivity on the effectiveness and thermal load of the MPHX.
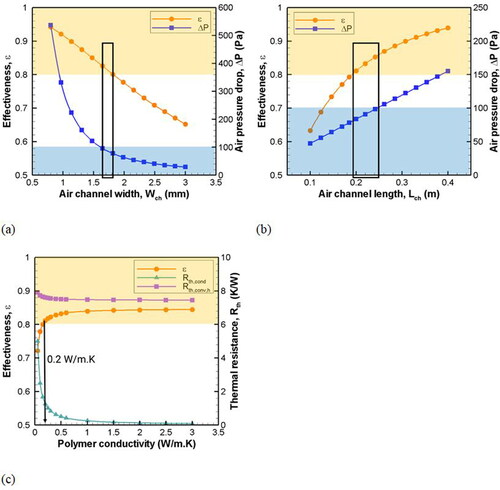
The effect of variation on in MPHX length from 10 cm to 40 cm on the HX effectiveness and air side pressure drop is shown in . Since the rest of the parameters were kept unchanged from their baseline values, increase in the length increases the heat transfer surface area and residence time for heat exchange. The inverse relationship of and
with the heated surface area (see EquationEquations (8)
(8)
(8) and Equation(9)
(9)
(9) ) results in a decrease in the thermal resistances, hence higher UA values and
The increase in length, however, has a detrimental impact on pressure drop, which increases three-fold linearly from 50 Pa at L = 10 cm to 150 Pa at L = 40 cm. The range marked with the black box in of L between 20 and 24 cm satisfies both
and
The low thermal conductivity of the polymers in comparison with typical metals such as copper and aluminum used in FTHXs may raise the question of the practicality of the polymer MPHX design. However, for the design presented in this study, utilizing the microchannels and pin array architecture on the water side helped in reducing the required wall thickness for the water plates to 0.5 mm. Mechanical simulations revealing the integrity of the design in holding the water line pressure will be discussed in the following section. The effect of thermal conductivity of the wall material on the performance of the MPHX is plotted in . For the baseline wall thickness of 0.5 mm, it is seen that increasing from 0.05 to 3 W/m-K improves the MPHX effectiveness and associated thermal load, but only for
; for higher values the enhancement effect diminishes. On the secondary ordinate of , the conductive resistance is compared against the convective resistance on the air (hot) side. While the conductive resistance is high at 5 K/W for k = 0.1 W/m-K, it diminishes rapidly and is about 1.5 K/W for k = 0.2 W/m-K. The hot side convective resistance, on the other hand, is larger at 7.5 K/W, and is the dominant resistance to heat transfer. Hence, the effectiveness is relatively unchanged past k = 0.5 W/m-K. The polymer used in the MPHX design, EPX-82, has a thermal conductivity of 0.2 W/m-K (Carbon 3D Citation2021). From , it is seen that
can still result in
The thermal conductivity enhancement by mixing the base resin with additives may be a path to attain higher thermal performance; however, this aspect is out of the scope of the current study.
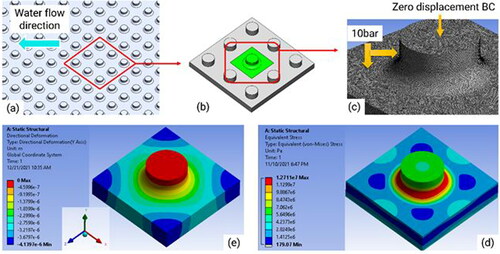
The baseline geometry listed in was used for detailed structural and computational CFD analyses. These simulations were iteratively performed to arrive at a viable header and core design capable of withstanding an internal pressure of 10 bar while having uniform flow distribution. Within each water plate, as shown in , micro pin structures provided structural support against internal system pressure. The pin array shown in is made up of repeating identical entities (unit cell) highlighted in green in ; hence, the first step of the design was focused on a single pin with symmetric boundary conditions in the water plate. Because of symmetry in the thickness of the water plate, the unit cell pin was sliced in two. This half pin, as shown in , was meshed and set up in Ansys Mechanical in order to assess the structural integrity under the expected loads. As seen in , an absolute pressure of 10 bar was imposed on all the internal surfaces while the outer exposed surfaces were left at atmospheric pressure (1 bar). The pin fin geometry and dimensions shown in and were selected after several mechanical simulation iterations. The corresponding stress contours on the unit cell pin fin due to the 10 bar internal pressure is shown in . The maximum stress of 12.7 MPa occurs at the pin fin base, which has a fillet of radius 0.25 mm. The tensile yield strength of EPX-82 resin, the material of choice for the application, at 20 °C is 80 MPa, providing a factor of safety of over 6 for the design. The stress map seen in (d) results in a deformation contour shown in . The blue corners at the farthest distance from pin have the largest Y direction deformation of about 4 mm. This deformation value is negligible in relation to the air side channel width (Wch) of 1.75 mm, indicating that no blockage of the air channels will be observed.
Fig. 4. Mechanical simulations of the MPHX water plate (a) Internal architecture of a single water plate in the MPHX (b) Repeating entity in the microchannel pin array design (c) Unit cell pin array meshed in the Ansys Mechanical, yellow arrows indicate surfaces exposed to 10 bar pressure. (d) Equivalent Von-Mises stress contours in the unit cell pin array revealing maximum 12.7 MPa stress at the base of pin fin (e) deformation in Y axis based on EPX82 properties.
For demonstration of the concept, a sub-scale MPHX with 55 water plates were stacked to form a MPHX unit of 20 cm (8 in) length, 20 cm (8 in) width, and 5 cm (2 in) height. Upon verification of the structural aspects of the design, CFD simulations using Ansys Fluent were performed to ensure uniform flow distribution from the header into each water plate and across the plates. The fluid volume in the inlet header formed by assembling the plates is shown in , where the interface region between the header and each of the water plates can be distinguished by the rectangular tabs at the bottom of the header. Since the pressure drop in the water plates plays a prominent role in determining flow uniformity across the header, it was important to incorporate the effect of the pressure drop inside the microchannel pin array accurately. The actual MPHX geometry has a large number of pin fins inside each water plate, so it is not computationally feasible to simulate the effect of all the pins inside the plates. For this reason, during the flow uniformity analysis simulation, a porous media modeling approach was adopted to incorporate the effect of pressure drop within each pin array. A quadratic curve-fit equation that correlates velocity to pressure drop for the range of flow rates inside the microchannel pin array plates was obtained using a pressure drop correlation from Short, Raad, and Price (Citation2002a) for the geometry of the pin array in the water plate (). The regression equation was then used to obtain inertial and viscous parameters for the porous media model such that equivalent pressure drop of water flow passing through the water plate could be reproduced by passing through the simulated small section of porous plate circled in red in the inset picture in . Results from the simulation of the mass flow rate discharged into each of the water plates is plotted in . It can be seen that the mass flow rate into each water plate is uniform at about 0.2 g/s, which was the target flow rate per plate for an overall incoming water flow rate of 11 g/s to the MPHX demonstration unit. The Mean Absolute Deviation (MAD) for flow rate distribution among the plates is also plotted in on the secondary ordinate in ; all MADs are well below 1%, indicating acceptable uniformity in flow distribution.
Fig. 5. (a) The fluid body within the MPHX inlet header that distributes the flow into stack of water plates. The inset picture with red circled section shows the part which porous media parameters were applied. (b) The estimated water in a pin array with 20 cm length by Short, Raad, and Price (2002) plotted against
used for porous media parameter calculation (c) Discharged mass flow rate into the stack of 55 water plates. The mean absolute deviation % from the target mass flow rate (0.2 g/s) for each of the plates is shown in second ordinate.
MPHX fabrication
The MPHX water plates were 3 D printed using a Digital Light Synthesis process via a Carbon® M2 printer. In this technique, the 3 D model of the water plate was projected in a series of UV images of the part cross section through an oxygen-permeable window into a reservoir containing UV-curable resin. As the sequence of UV images was projected, the water plate solidified layer by layer while the build platform was pulling out the solid body. Advantages of this printing technique include the short print time, the ability to print complex geometries with internal flow passages, better mechanical properties even at higher temperatures (Cyanate Ester resin with a 231 °C heat deflection temperature), and pixel resolution as low as 75 μm (Carbon 3D Citation2021). EPX-82 resin was chosen to be the material for the eventual printed heat exchanger since it had good mechanical properties. The EPX-82 has a yield strength of 80 MPa, with a heat deflection temperature (at 1.82 MPa, as per ASTM D64) of 120 °C. Thermal conductivity of the EPX-82 is 0.2 W/m-K and this resin takes up to 2% by weight of water when exposed more than 80 days to an environment with 50% relative humidity at 23 °C. The water uptake decreases the yield strength down to about 70 MPa. Due to availability and cost considerations, the sub-scale MPHX demonstration units used in heat transfer experiments in this study were made with UMA90 (Urethane Methacrylate) resin. A smaller stack of 5 plates was made with EPX-82 resin by an external vendor to characterize mechanical integrity of the design.
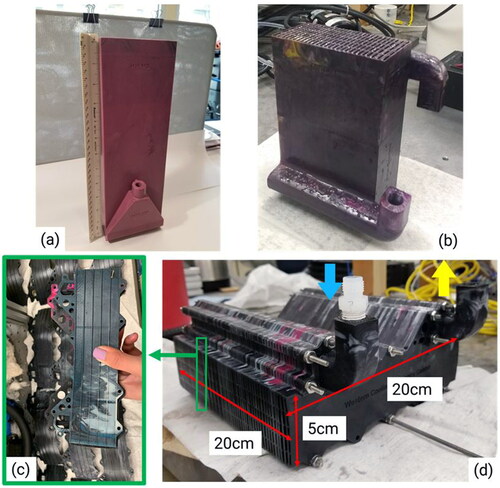
Different monolithic variations of fabricated small-scale MPHXs are shown in and b. The large-scale MPHX is envisioned to be built in this fashion in commercial-grade printers (for example, Carbon L1). Due to the size limitation of the Carbon M2 printer, the MPHX demonstration unit used for thermal characterization was re-designed to be printed as individual water plates and assembled by stacking multiple water plates together. The water plates had integrated inlet and exit header sections with tongue-and-groove features, which formed leak-free inlet and exit headers when stacked together (see ). Scalability in the proposed MPHX prototype was achieved in the lateral direction by increasing the number of plates and in the vertical direction by stacking up MPHX units (modules). shows an overall picture of the 3 D printed MPHX assembly with a modular and scalable design that fits into a 5 cm x 20 cm (2 in x 8 in) duct. Two such units were stacked on top of each other for testing. The printed water plates were assembled together laterally to build two MPHX units, each with nominal cross-sectional dimensions of 5 cm × 20 cm (2in × 8in). The units were stacked vertically to fit within a 10 cm × 20 cm (4in × 8in) duct for lab testing.
Fig. 6. Variants of monolithic small scale MPHX for 2in × 4in duct size in (a) 32 cm and in (b) 16 cm length with different header design. (c) Individual water plates used in the MPHX sub-scale demonstration assembly. (d) Overall look of the 3 D printed MPHX assembly with modular and scalable design that fits into a duct size of 5 cm × 20 cm (2in × 8in).
Experimental facility
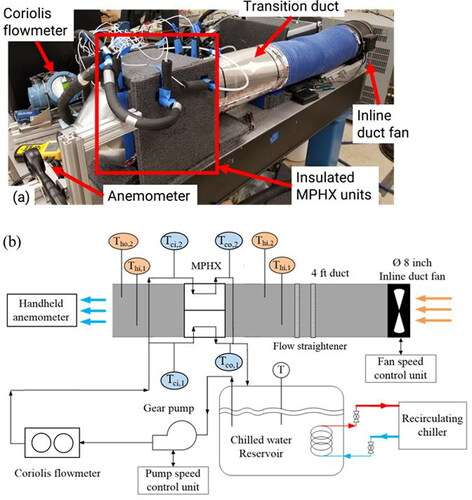
A picture of the flow loop and corresponding line schematic are shown in and b, respectively. The two MPHX units, when assembled together, fit within the 10 cm × 20 cm (4 in. × 8 in.) duct. The MPHX assembly was insulated with 5 cm (2 in.) thick polyethylene foam with an RSI value of 1.4 m2-K/W (8 hr-ft2-°F/BTU). The cold side of the MPHX was a closed loop of chilled water supplied by a reservoir, while the hot side was an open loop created by blowing room temperature air across the MPHX and then exhausting it back to the room. Deionized water in the reservoir was cooled by recirculating water from a chiller (Thermo Scientific NESLAB ThermoFlex™ 5000) through a cooling coil. Water was circulated to and from the reservoir into the test loop using a variable speed gear pump (Micropump®). A Coriolis flowmeter (Micromotion® Elite® II) located downstream of the pump was used to measure the water mass flow rate. A variable speed inline duct fan (AC Infinity CLOUDLINE T8) was used upstream of the MPHX to direct room temperature air into a 0.9 m (3 ft) long circular ducting (for flow development) followed by a 0.5 m (20in) transition from a 20 cm (8in) circular to a rectangular cross section of 10 cm × × 20 cm (4in × 8in) and then across the MPHX. As show in , two stainless steel mesh-wire flow straighteners with a 20 cm (8in) diameter and a 20 × 20 mesh size were installed 5 cm (2in) apart at the end of circular ducting. Calibrated RTD probes (PT100) were installed in both air and water streams at the inlet and exit of either of the MPHX units, see . A handheld anemometer (HOLDPEAK HP-856A Pro) was placed one duct diameter downstream of the 4-inch duct exhaust to quantify the air volumetric flow rate.
Fig. 7. (a) Picture of MPHX flow test loop (b) line schematic annotated with the loop components.
Test procedure
Prior to experiments, the chiller was turned on and its supply temperature was adjusted such that the chilled water temperature at the inlet of the MPHX units was higher than the test day dew point to prevent condensation. Once the reservoir temperature reached steady state, the inline duct fan speed was set to the appropriate value and the water gear pump speed was adjusted to reach a desired heat capacity rate ratio between the two streams, (nominally 0.25, 0.5, 0.75, and 1). The cold and hot stream flow rates were adjusted such that the water side (cold stream) always had the dominant heat capacity rate, i.e.,
Data for temperatures, water mass flowrate, and air volumetric flowrate were recorded throughout the experiment. Steady state conditions were indicated by stable readings of MPHX cold and hot stream inlet/outlet temperatures, and was deemed to have been achieved when temperatures changed by 0.1 °C or less over five minutes. Upon recording steady state data, the water mass flow rate was changed to cover different
values for the same fan speed. Once all steady state conditions for a pre-set fan speed were recorded, the fan speed was changed to a higher value and the procedure was repeated. shows the range of air and water flow rates and their inlet temperatures recorded during MPHX testing. The corresponding Reynolds number calculated based on
on the air side varied from 490 to 1050. The water side Reynolds number calculated based on
a hydraulic diameter obtained at the minimum flow area within the pin array, varied from 2 to 12.
Table 2. Flow conditions and the range of variability during MPHX testing.
Data reduction and uncertainty
The raw data collected from testing were processed to characterize the performance of the MPHX. As shown in , the fluid temperatures were measured at the inlet/exit ports of each of the MPHX units; the collected data were arithmetically averaged at corresponding ports and used for performance calculations. Density, dynamic viscosity, and specific heat of the air and water were computed based on the average between the inlet and outlet temperatures at lab ambient pressure. MPHX effectiveness, was calculated as the ratio of the net heat transfer rate (from air to water) to the maximum possible heat transfer rate using EquationEquation (1)
(1)
(1) .
The maximum possible heat transfer rate,
was given as:
(13)
(13)
As detailed in the Experimental Facility section, the air stream entered the MPHX units at lab ambient temperature and was cooled down by rejecting heat into the chilled water stream. Based on collected data, the rate of heat exchange, can be calculated based on either the hot or cold side energy balance,
(14)
(14)
or
(15)
(15)
where subscripts
and o denote inlet and outlet of the MPHX. Theoretically, the exchanged heat calculated from both streams should match (
) if all walls of the MPHX units exposed to the environment have zero heat loss (adiabatic boundary condition). In practice, achieving zero heat loss in an experimental test rig is not possible. Upon insulating the MPHX (see ), the Mean Absolute Difference (MAD) percentage between
and
for all collected data with nominal
of 0.5, 0.75, and 1 was limited to 3.4% (with minimum 0.2% and maximum 6.2%). When the smaller
of 0.25 were included, the MAD increased to 5.7%. To calculate the heat exchanger effectiveness, an average of
and
was used as
in EquationEquation (1)
(1)
(1) . The overall conductance between the fluid streams in the heat exchanger,
was determined from,
(16)
(16)
is the overall heat transfer coefficient,
is the area for heat exchange, and
is the log mean temperature difference, defined as,
(17)
(17)
Since all the required temperature data to calculate were available, using EquationEquations (16)
(16)
(16) and Equation(17)
(17)
(17) the experimental
value could be determined. With the determined
the
that is typically used in HX thermal load calculations was estimated using EquationEquation (6)
(6)
(6) . The hot air mass flow rate was also represented in a non-dimensional form as Reynolds number from,
(19)
(19)
where
is the velocity of the hot air stream passing through the rectangular passages with hydraulic diameter
Air density (
) and dynamic viscosity (
) were calculated at the average temperature of the hot stream across the MPHX units.
All RTDs were calibrated using a NIST-traceable lab calibrator (Omega, CL3001) coupled to a Fluke 5626 RTD. The calibrator and a Fluke 750P23 differential pressure module were used for precise differential pressure drop measurements of the air stream across the MPHX. The calibration error includes errors associated with the calibrator (bias error), the calibration precision error, and the curve fit error. The Coriolis flowmeter (Micromotion® Elite® II) was factory calibrated. The Kline and McKlintock error propagation method (Moffat Citation1988) was used to determine uncertainties in the calculated parameters based on the bias and precision errors of the measured variables. Uncertainties in measured parameters were obtained by combining the measurement precision errors and the calibration errors in a root-sum-square manner. Propagation of errors was performed using Engineering Equation Solver (EES, F-chart Inc.). Maximum uncertainties in measured variables were propagated into the dependent variables using the aforementioned equations. The representative errors in measured and determined variables are listed in .
Table 3. Representative uncertainties of measurement and determined variables.
Results and discussion
Structural integrity
In order to validate the structural integrity of the water plate design, a sub-scale monolithic design of the MPHX consisting of 5 water plates was 3 D printed using Carbon M2 printer with EPX-82 resin, see black component shown in . This resin combines functional toughness and temperature resistance with a heat deflection temperature of 120 °C at 1.82 MPa. Upon successful printing of the subscale MPHX core, fluidic inlet and exit ports and endcaps (brown parts shown in ) were designed and 3 D printed with ABS plastic in-house to complete the apparatus for testing. Mechanical integrity testing was performed through static tests and limited cyclic tests. Static pressure testing of the MPHX was performed up to 7 bar (100 Psia). Limitations on the pressure transducer precluded testing to the design pressure of 10 bar. The MPHX internal channels were pressurized with 1 bar step increments and a 2 minute hold time at each step, see . At the maximum tested pressure of 7 bar (100 Psia) the hold time increased to 10 minutes to ensure that the MPHX was holding pressure without any leak. The MPHX core was inspected throughout the test with soapy water and no leak was observed.
Fig. 8. (a) Subscale monolithic design of MPHX consisting of 5 water plates with integrated headers printed using EPX-82 resin (b) Static pressure testing, (c) Cyclic pressure testing (d) and (e) Pictures showing MPHX core outer walls and a few air channels at the end of experiments that showed no visible sign of failure.
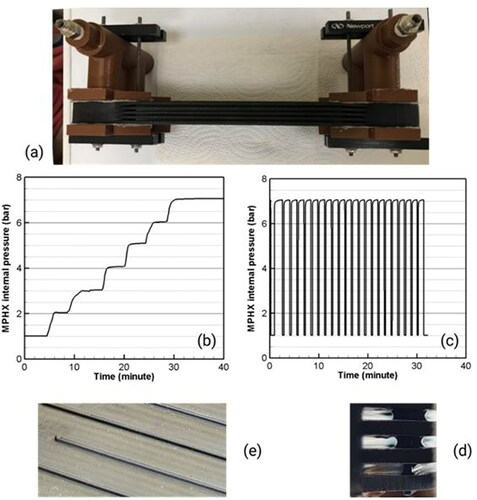
In order to test the impact of sudden pressurization and de-pressurization events on the structural integrity, the MPHX core was subjected to more than 20 cycles of pressurizing and de-pressurizing events between 7 bar and atmospheric pressure. As seen in , once the MPHX was pressurized, it was held for one minute and then it was purged and the cycle was repeated after 15 seconds. At the end of the cyclic pressure testing, as shown in and , the MPHX core held its structural integrity with no visible plate failure on the outer walls of the water plates or on the air channels (space between the water plates).
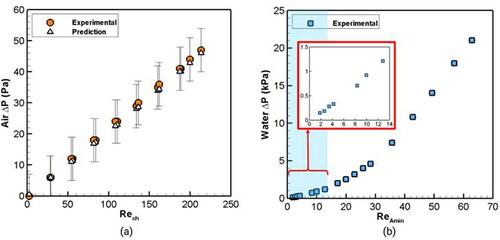
Pressure drop and heat transfer
As was mentioned in the MPHX Fabrication section, the MPHX demonstration units used for heat transfer testing in this study were made with UMA90 resin, a surrogate lower-strength resin that was available for in-house printing. shows the results of adiabatic pressure drop measurements of airflow on the hot side. Also shown in is the comparison with fully-developed laminar flow theory pressure drop. The results indicate that in the range of tested flow rates (Re up to 210), the experimental air pressure drop agrees with the laminar theory prediction. The predicted values had minimum, maximum, and average MADs of 1.9%, 8.4%, and 4.2% respectively. It should be noted that for the range of tested Re, the measured pressure drop was low (<50 Pa); hence the uncertainty is dominated by the bias error of the utilized differential pressure transducer (Fluke 750P23 with ±7 Pa manufacturer uncertainty). The variation of water side pressure drop with flow rate through a monolithic MPHX is shown in . The monolithic HX that was used for the water pressure drop test had pin array dimensions identical to those used in the MPHX units and is depicted in the . The presented water is for the pin array; local losses due to contraction/expansion within the header and connecting ports were calculated and subtracted from the measurement. For the range of tested flow rates, local losses varied between 13 to 26% of the pin array
The water pressure drop increasing trend with the flow rate (Re) follows a power-law curve trend and is in accord with the pin array
trends reported in literature, for example Prasher et al. (Citation2007), Türker, Koz, and Koşar (Citation2015), and Rasouli, Naderi, and Narayanan (Citation2018). The operating Re range corresponding to the test conditions in the MPHX units is highlighted in blue in ; the inset plot shows a magnified view of the low end of the curve. It is seen that the water pressure drop for
, which was the maximum tested flow rate in the heat transfer experiments, is relatively small (< 2 kPa).
Fig. 9. (a) Air side pressure drop at different flow rates of air flowing through the air channels (b) Water side pressure drop at different flow rates of water flowing through the microchannel pin array plates.
For different tested values, the net heat transfer rate is plotted against air stream Reynolds number (
) in . It can be seen that for
reaches up to 388 W at the highest tested Re of 1050 (corresponding to a 2.63 m3/min (93 CFM) airflow rate). If the results at this Re are scaled up from a 0.1 m × 0.2 m demonstration unit to a MPHX with a cross-sectional dimension of 0.61 m × 0.61 m (2 ft × 2 ft), this is equivalent to 48.1 m3/min (1700 CFM) and the scaled up thermal load (
) is 7.2 kW (2 tons of cooling). This example of a scale-up prediction is based on the test with water and air inlet temperatures of 11.6 °C (52.9 °F) and 20.7 °C (69.3 °F), respectively. The scaled-up MPHX would require a water flow rate of 26.9 LPM (7.1 GPM).
Fig. 10. MPHX bundle performance results (a) heat transfer rate trend against air stream Re for tested values. (b) variation of effectiveness with calculated NTU values for range of tested.
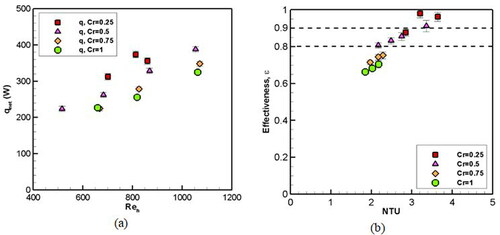
The variation of the MPHX effectiveness as a function of (calculated from test data using EquationEquations (16)
(16)
(16) , Equation(17)
(17)
(17) , and Equation(6)
(6)
(6) ) for tested
values is shown in . The general trend seen in for a fixed
is that MPHX effectiveness increases with an increase in
Increasing NTU at a fixed
was enabled in experiments by proportionally lowering both hot and cold mass flow rates. This increased residence time for heat exchange, resulting in an increase in effectiveness with NTU. At a fixed
the effectiveness of the MPHX is higher for a smaller
value. This trend is in agreement with the expected trends in any heat exchanger (Incropera et al. Citation1996) where the maximum and minimum values of
are respectively associated with
of 0 and 1. In the MPHX testing, for a fixed
lower
was obtained at higher water flow rates for a fixed airflow rate. Hence, the increase in effectiveness is due to the higher heat transfer coefficient on the water side and, hence, a higher overall heat transfer coefficient (
) in the HX. It is noteworthy that the recommended operational
in FTHX units is about 0.25 (Emergent Coils Citation2021). At this
value, from , it is seen that MPHX effectiveness for all tested fan speeds is above 0.87. The MPHX bundle also exchanged heat with an effectiveness greater than 0.80 for all fan speeds in tests with
Fig. 11. Comparison of experimental correlation-based model results for (a) overall conductance, UA and (b) Effectiveness.
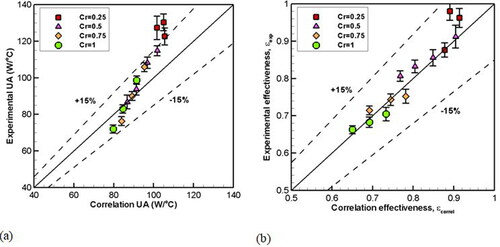
Correlation-based model validation
The experimental data were used to validate the correlation-based thermo-fluidic model described in the MPHX Performance Modeling section. The experimental MPHX UA, determined using EquationEquation (14)–(17), are compared with predicted values from the model, determined using EquationEquation (7)(7)
(7) , in . The minimum, maximum, and mean absolute deviation between experimental and correlation-based conductance was 0.01%, 20.1% and 9.7% respectively. It is seen that at the low
of 0.25, corresponding to the highest water flow rate, the experimental UA is higher than the correlation-based UA, while at the highest
of 1, corresponding to the lowest water flow rate, the trend is reversed. While the reason for this difference is not fully understood, it should be noted that the Rasouli, Naderi, and Narayanan (Citation2018) correlation used in the prediction (EquationEquation (11)
(11)
(11) ) is valid for Re ranging from 40 < ReAmin < 2300 whereas the ReAmin range on the water side in the current experiments ranged between 2 and 12. A sensitivity study was performed using other correlations for pin array heat transfer from literature such as those by Zukauskas (Citation1972), Short, Raad, and Price (Citation2002b), and Prasher et al. (Citation2007). The resultant MAE between experimental conductance and correlation-based conductance using Zukauskas (Citation1972), Short, Raad, and Price (Citation2002b) and Prasher et al. (Citation2007) correlations were 18.5%, 18.6%, and 10.7%, respectively. It should be noted that none of these correlations are valid for such low ReAmin. Further refinement of a correlation for a lower ReAmin range is likely needed to improve the match between experiments and correlation-based conductance values.
The correlation-based effectiveness for a counterflow heat exchanger was calculated using EquationEquation (2)(2)
(2) , based on using the Rasouli, Naderi, and Narayanan (Citation2018) correlation conductance. compares the experimentally-determined effectiveness against the correlation-based effectiveness. The minimum, maximum, and mean absolute deviation between experimental effectiveness and correlation-based effectiveness were 0.14%, 9.2%, and 3.3%, respectively. In general, the data points related to lower
values (i.e., 0.25 and 0.5) could be predicted with better accuracy.
Comparison of MPHX and FTHX performance
A performance comparison between a FTHX and the MPHX concept for a duct of 0.61 m × 0.61 m (2 ft × 2 ft) cross section is shown in . Inlet temperatures of 26.7 °C (80 °F) and 7.2 °C (45 °F) were assumed for air and water, respectively. The airflow rate was fixed at 42.5 m3/min (1500 CFM) and the water flow rate was set to 22.7 LPM (6 GPM). These values would present a typical flow condition in a single-family home HVAC system with an approximately 10.5 kW (3 Ton) thermal load. For the sake of simplicity, the incoming air was assumed to be dry and condensation was not modeled for either heat exchanger. The FTHX geometry matched Emergent Coil model no. 5W24X24-610-ZRC; salient geometrical parameters are listed in . The MPHX pin array geometry dimensions are listed in . The FTHX modeling was performed based on a cross-counter flow configuration in Engineering Equation Solver (EES, F-chart Inc.) where heat transfer coefficients the for water and air sides were obtained from internal functions. The FTHX EES model prediction was validated with available commercial software by FTHX manufacturers (EZ-Coil Software Citation2021). For example, under identical flow rates and inlet temperatures of the air and water streams, the sensible heat exchange capacity estimated by the EES model of a FTHX with 7 rows of tubes and dimensions similar to the coil specs listed in was within 1.8 % of the commercial software. Depending on the number of tube rows, the FTHX depth and consequently air side pressure drop varies (see typical tube spacing in ). A comparison of the two HXs was made under nearly equal pressure drop on the air side of 84 and 88 Pa for the MPHX and FTHX, respectively. The effectiveness and heat transfer rate of the FTHX and MPHX are shown in in the ordinate as a function of HX depth (in the direction of airflow) on the abscissa. The extent of the highlighted region in corresponds to the 20-cm-long MPHX characterized experimentally. It can be seen from that, for the same HX depth (or HX volume), the MPHX has a better heat transfer performance than the FTHX (and a nearly identical pressure drop). For example, for the same length as the tested small scale MPHX (i.e., 20 cm, or 8 in.) and identical flow conditions and inlet temperatures, a MPHX can transfer 12.6 kW with an effectiveness of 0.78, compared with the 8.1 kW heat transfer rate with an effectiveness of 0.5 in a FTHX.
Fig. 12. Comparison of effectiveness and heat rate vs heat exchanger length in a FTHX and MPHX with cross section of 0.61 m × 0.61 m (2 ft × 2 ft). Pressure drop across a 20 cm long MPHX and FTHX are 84 and 88 Pa respectively.
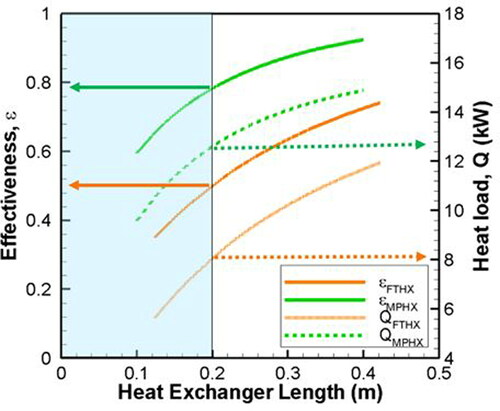
Table 4. FTHX geometry (matching Emergent Coil model no. 5W24X24-610-ZRC).
Conclusions
In this study, advances in microchannel technology and additive manufacturing (AM) of polymers were used to develop a novel, high-effectiveness counterflow, microchannel polymer heat exchanger (MPHX) for use in residential air handler units. The novel MPHX design was based on replacing metallic fins in a traditional finned tube heat exchanger with mm-scale-thick “water plates” within which water flowed through a staggered array of pins. In this design, the tubes of a traditional FTHX were completely eliminated, thereby reducing form drag for the airflow. The MPHX was designed to be fabricated using a digital light synthesis 3 D printing method.
A correlation-based model was developed and used to determine the impact of varying geometrical parameters and thermal conductivity on the performance of the MPHX. Detailed mechanical and fluid flow simulations were used to develop a design of the baseline MPHX. Mechanical integrity tests, performed on a sub-scale monolithic EPX-82 MPHX, confirmed the design integrity for pressures in the water plates up to 7 bar under static and limited cycling conditions.
A prototype MPHX thermo-fluidic demonstration unit was fabricated to fit a cross duct area of 10 cm × 20 cm (4in × 8in) with an estimated heat load of about 390 W. The thermal performance of the MPHX was characterized over a range of water and airflow rates corresponding to values of 0.25, 0.5, 0.75, and 1 for air side Re ranging from 490 to 1050. At all fan speeds with
values of 0.25 and 0.5, the MPHX had an effectiveness higher than 0.8. For the range of tested Re, the air side pressure drop could be well predicted using laminar theory.
The experimental results were used to validate the thermo-fluidic model. The experimentally-determined conductance was higher than the correlation-based conductance at higher flow rates while the opposite trend was observed at lower flow rates. Overall, the mean absolute deviation between experimental- and correlation-based conductance was 9.7%. The mean absolute deviation in predicting all experimental effectiveness values was 3.3%.
The validated model was used for performance comparison of a full scale (10.5 kW ∼ 3 Ton load) MPHX with a FTHX. For about the same pressure drop on the air side, results showed that for the same HX volume, flow rate, and inlet temperatures, the MPHX transferred 55% more thermal energy than a FTHX.
| Nomenclature | ||
| = | surface area for heat exchange ( | |
| = | fin surface area ( | |
| = | total heat transfer area ( | |
| = | heat capacity rate ( | |
| = | heat capacity rate ratio | |
| = | specific heat capacity ( | |
| = | dimeter ( | |
| = | height ( | |
| = | heat transfer coefficient ( | |
| = | thermal conductivity ( | |
| = | length ( | |
| = | log mean temperature difference ( | |
| = | mean absolute deviation, | |
| = | mass flow rate ( | |
| = | number of transfer units | |
| = | Nusselt number | |
| = | pressure drop (Pa) | |
| = | transferred heat ( | |
| = | maximum possible heat transfer in a heat exchanger ( | |
| = | thermal resistance ( | |
| Re | = | Reynolds number |
| = | Fin spacing ( | |
| = | pin array longitudinal spacing ( | |
| = | plate spacing ( | |
| = | pin array transverse spacing ( | |
| = | temperature ( | |
| = | thickness ( | |
| = | overall heat transfer coefficient in a heat exchanger ( | |
| = | inverse of thermal resistance for heat to be transferred from the hot to the cold fluid in a heat exchanger ( | |
| = | velocity ( | |
| = | volumetric flow rate ( | |
| = | width ( | |
| Greek Symbols | ||
| = | pin array aspect ratio, | |
| = | longitudinal pitch ratio, | |
| = | transverse pitch ratio, | |
| = | heat exchanger effectiveness | |
| = | surface efficiency | |
| = | dynamic viscosity ( | |
| = | unspecified terms | |
| = | density ( | |
| Subscripts | ||
| = | attributed to air | |
| = | calculated at minimum flow area within the pin array | |
| = | attributed to cold flow in a heat exchanger | |
| = | attributed to air flow channel | |
| = | attributed to conduction heat transfer | |
| = | attributed to convection heat transfer | |
| = | experimental value | |
| = | attributed to fin | |
| = | attributed to hot flow in a heat exchanger | |
| = | calculated at the inlet | |
| = | maximum value | |
| = | minimum value | |
| = | calculated at the outlet | |
| = | attributed to pin array | |
| = | based on correlation prediction | |
| = | attributed to solid wall or calculated at the wall | |
| = | attributed to water | |
Disclosure statement
No potential conflict of interest was reported by the author(s).
Additional information
Funding
References
- Aetna Plastics Corp. 2019. Heat exchangers/calorplast. www.aetnaplastics.com/products/d/HeatExchangers.
- AMETEK Fluoropolymer Products. 2019. Fluoropolymer heat exchangers. www.ametekfpp.com/products/fluoropolymerheatexchangers.
- Arie, M. A., A. H. Shooshtari, R. Tiwari, S. V. Dessiatoun, M. M. Ohadi, and J. M. Pearce. 2017. Experimental characterization of heat transfer in an additively manufactured polymer heat exchanger. Applied Thermal Engineering 113:575–84. doi:https://doi.org/10.1016/j.applthermaleng.2016.11.030
- Burns, J., and R. Jachuck. 2001. Condensation studies using cross-corrugated polymer film compact heat exchanger. Applied Thermal Engineering 21 (4):495–510. doi:https://doi.org/10.1016/S1359-4311(00)00063-6
- California ARB. 2019. High-GWP refrigerants. ww2.arb.ca.gov/resources/documents/high-gwp-refrigerants.
- Carbon 3D. 2021. www.carbon3d.com.
- Carrier. 2007. Indoor coil corrosion industry research report. aplusair.ca/wp-content/uploads/Carrier-Evaporator-Coil-Formicary-Corrosion-Report.pdf.
- Cevallos, J. G. 2014. Thermal and manufacturing design of polymer composite heat exchangers. PhD diss., University of Maryland.
- Cevallos, J. G., A. E. Bergles, A. Bar-Cohen, P. Rodgers, and S. K. Gupta. 2012. Polymer heat exchangers—history, opportunities, and challenges. Heat Transfer Engineering 33 (13):1075–93. doi:https://doi.org/10.1080/01457632.2012.663654
- Chen, L., Z. Li, and Z. Y. Guo. 2009. Experimental investigation of plastic finned-tube heat exchangers, with emphasis on material thermal conductivity. Experimental Thermal and Fluid Science 33 (5):922–8. doi:https://doi.org/10.1016/j.expthermflusci.2009.04.001
- Chen, X., Y. Su, D. Reay, and S. Riffat. 2016. Recent research developments in polymer heat exchangers – a review. Renewable and Sustainable Energy Reviews 60:1367–86. doi:https://doi.org/10.1016/j.rser.2016.03.024
- Cheng, L., and C. W. M. V. D. Geld. 2005. Experimental study of heat transfer and pressure drop characteristics of air/water and air-steam/water heat exchange in a polymer compact heat exchanger. Heat Transfer Engineering 26 (2):18–27. doi:https://doi.org/10.1080/01457630590897033
- Deisenroth, D. C., R. Moradi, A. H. Shooshtari, F. Singer, A. Bar-Cohen, and M. Ohadi. 2018. Review of heat exchangers enabled by polymer and polymer composite additive manufacturing. Heat Transfer Engineering 39 (19):1648–64. doi:https://doi.org/10.1080/01457632.2017.1384280
- Emergent Coils. 2021. Chilled water coils. Accessed November 2021. https://emergentcoils.com/collections/chilled-water-coil
- EZ-Coil Software. 2021. USA coil. Version 1.0.0.429.
- Field, J. E. 2002. Corrosion of aluminum-fin, copper-tube heat exchange coils. Proceedings of the 13th Symposium on Improving Building Systems in Hot and Humid Climates, Houston, TX, May 20–22.
- Fluorotherm. 2019. Heat exchanger. www.fluorotherm.com/products/heat-exchangers.
- Fujitsu. 2015. Formicary corrosion and your HVAC system. fujitsugeneral.zendesk.com/hc/en-us/article_attachments/360001360207/Formicary_Corrosion_12-12-16_JC.pdf.
- Goodway Technologies Corporation. 2018. Coil corrosion causes and reduction. www.goodway.com/hvac-blog/2018/11/coil-corrosion-causes-and-reduction.
- Goodway Technologies Corporation. 2019. CoilShine® Coil cleaning solution. https://www.goodway.com/accessories/coil-cleaning-accessories/coilshine-coil-cleaning-solution.
- HeatMatrix. 2019. Gas to liquid exchanger. www.heatmatrixgroup.com/products/#gas.
- Hein, L. L., and M. V. V. Mortean. 2021. Theoretical and experimental thermal performance analysis of an additively manufactured polymer compact heat exchanger. International Communications in Heat and Mass Transfer 124:105237. doi:https://doi.org/10.1016/j.icheatmasstransfer.2021.105237
- Hussain, A. R. J., A. A. Alahyari, S. A. Eastman, C. Thibaud-Erkey, S. Johnston, and M. J. Sobkowicz. 2017. Review of polymers for heat exchanger applications: factors concerning thermal conductivity. Applied Thermal Engineering 113:1118–27. doi:https://doi.org/10.1016/j.applthermaleng.2016.11.041
- Incropera, F. P., D. P. DeWitt, T. L. Bergman, and A. S. Lavine. 1996. Fundamentals of heat and mass transfer. 6th ed. New York: Wiley.
- International Comfort Products. 2019. Indoor coil corrosion industry research report. www.utcccs-cdn.com/hvac/docs/1011/Public/0C/ICP_42106111203_28414.pdf.
- Kansetu. 2019. Plastic heat exchanger. www.kansetu-intl.com/kic-product111.htm.
- Klein, E., J. Ling, V. C. Aute, Y. Hwang, and R. Radermacher. 2018. A review of recent advances in additively manufactured heat exchangers. International Refrigeration and Air Conditioning Conference. Paper 1983.
- Lowrey, S., C. Hughes, and Z. Sun. 2021. Thermal-hydraulic performance investigation of an aluminum plate heat exchanger and a 3d-printed polymer plate heat exchanger.
- Malik, T., and C. W. Bullard. 2005. Suitability of polymer heat exchangers for air conditioning applications. Project report for Air Conditioning and Refrigeration Center.
- Moffat, R. 1988. Describing the uncertainties in experimental results. Experimental Thermal and Fluid Science 1 (1):3–17. doi:https://doi.org/10.1016/0894-1777(88)90043-X
- Nellis, G. F., and S. A. Klein. 2009. Heat transfer. New York, NY: Cambridge University Press.
- Park, Y., and A. M. Jacobi. 2008. Polymer-tube-bundle heat exchanger for liquid-to-gas applications. Proceedings of International Refrigeration and Air Conditioning Conference Purdue University, West Lafayette, IN, July 14–17.
- Peles, Y., A. Koşar, C. Mishra, C. J. Kuo, and B. Schneider. 2005. Forced convective heat transfer across a pin fin micro heat sink. International Journal of Heat and Mass Transfer 48 (17):3615–27. doi:https://doi.org/10.1016/j.ijheatmasstransfer.2005.03.017
- PolyCoil. 2019. Plastic heat exchangers. www.plasticheatex.com/wp/plastic-heat-exchangers-information.
- Prasher, R. S., J. Dirner, J. Y. Chang, A. Myers, D. Chau, D. He, and S. Prstic. 2007. Nusselt number and friction factor of staggered arrays of low aspect micropin–fins under cross flow for water as fluid. Journal of Heat Transfer 129 (2):141–53. doi:https://doi.org/10.1115/1.2402179
- Rasouli, E., A. Strong, and V. Narayanan. 2020. High efficiency microchannel polymer heat exchangers for heating and cooling applications. 2020 ASHRAE Virtual Summer Conference, ASHRAE Transactions 126 (2), VC-20-C041, pp. 341–349.
- Rasouli, E., C. Naderi, and V. Narayanan. 2018. Pitch and aspect ratios effects on single-phase heat transfer through microscale pin fin heat sinks. International Journal of Heat and Mass Transfer 118:416–28. doi:https://doi.org/10.1016/j.ijheatmasstransfer.2017.10.105
- Short, B. E., P. E. Raad, and D. C. Price. 2002a. Performance of pin fin cast aluminum cold walls, part. 1: friction factor correlations. Journal of Thermophysics and Heat Transfer 16 (3):389–96. doi:https://doi.org/10.2514/2.6692
- Short, B. E., P. E. Raad, and D. C. Price. 2002b. Performance of pin fin cast aluminum coldwalls. Part 2: Cilburn j-factor correlations. Journal of Thermophysics and Heat Transfer 16 (3):397–403. doi:https://doi.org/10.2514/2.6693
- T’Joen, C., Y. Park, Q. Wang, A. Sommers, X. Han, and A. Jacobi. 2009. A review on polymer heat exchangers for HVAC&R applications. International Journal of Refrigeration 32 (5):763–79. doi:https://doi.org/10.1016/j.ijrefrig.2008.11.008
- Tiwari, R., R. S. Andhare, A. Shooshtari, and M. Ohadi. 2019. Development of an additive manufacturing-enabled compact manifold microchannel heat exchanger. Applied Thermal Engineering 147:781–8. doi:https://doi.org/10.1016/j.applthermaleng.2018.10.122
- TMW. 2019. Heat transfer. www.aetnaplastics.com/products/d/HeatExchangers.
- Trane. 2007. All-aluminum evaporative coil. www.achrnews.com/articles/103410-trane-all-aluminum-evaporator-coil.
- Treau. 2019. www.treau.cool.
- Tuckerman, D. B. 1984. Heat-transfer microstructures for integrated circuits. PhD diss., Stanford University.
- Türker, İ., M. Koz, and A. Koşar. 2015. The effect of micro pin-fin shape on thermal and hydraulic performance of micro pin-fin heat sinks. Heat Transfer Engineering 36 (17):1447–57.
- U.S. Department of Energy. 2019. Air conditioning. www.energy.gov/energysaver/home-cooling-systems/air-conditioning.
- Zukauskas, A. 1972. Heat transfer from tubes in crossflow. Advances in Heat Transfer 8:93–160.