
Abstract
Many facility acquired infection (FAI) causing pathogens are airborne and controlling them is critical to preventing illness. An advanced air purification technology (AAPT) was designed to inactivate the genetic material of pathogens and remediate volatile organic compounds (VOCs). This study explores the effect of the AAPT on critical metrics in multiple healthcare settings. The AAPT was installed in the heating, ventilation, and air conditioning (HVAC) ductwork of a hospital’s medical surgical floor (ACH-MSF), a second hospital’s post-anesthesia care unit (PACU), intensive care unit (ICU), and medical surgical (MS) unit, and in a senior living facility’s (SLF) memory support unit. In all installations, the control area(s) were protected only by high efficiency particulate air (HEPA) filtration. The measured airborne fungal levels, airborne and surface bacterial levels, and VOC levels decreased with the installation of AAPT. The AAPT removed infectious airborne pathogens and reduced surface pathogens and VOCs. The ACH-MSF and SLF protected by the AAPT documented improved clinical and economic metrics including a 39.5% decrease in patient length of stay, 23% in cost savings improvement, and a 39.6% decrease in FAIs. The current findings support the hypothesis that indoor environmental quality impacts wellness and has potential applications in diverse indoor environments.
Introduction
Healthcare facilities, including hospitals and senior living facilities (SLFs), are constantly working to remove pathogens responsible for facility acquired infections (FAIs). Successful infection control protocols and room sterilization methods have been implemented that have been proven to reduce FAI rates (Sharpe and Schmidt Citation2011). Although surface cleaning and infection control protocols have been the focus within healthcare facilities, literature on hospital acquired infections indicates that many FAI causing pathogens originate from the air (Kowalski Citation2007).
This study focuses on the effects of technology employed in an advanced air purification technology (AAPT), which was designed to comprehensively remediate harmful airborne pathogens in both outside and return air before it enters the protected space (LifeAire Systems Citation2021). The AAPT is installed within the facility’s heating, ventilation, and air conditioning (HVAC) ductwork and utilizes ultraviolet germicidal irradiation (UVGI) technology for pathogen remediation, instead of typical high efficiency particulate air (HEPA) filtration. HEPA filtration has a history of success within healthcare settings. One study found significantly reduced numbers of airborne Aspergillus organisms in HEPA filtered environments compared to other locations in the same hospital (Sherertz et al. Citation1987). Another published meta-analysis reported a lower rate of invasive fungal infections among patients in HEPA filtered environments (Eckmanns, Rüden, and Gastmeier Citation2006). HEPA filters function by capturing particulates of a particular size. These captured particulates, including bacteria, viruses, and mold/fungal spores can remain in the filter and continue to proliferate. Fungal pathogens trapped in the HEPA filters can release infectious fungal volatile organic compounds (VOCs). In situations with bypass, captured pathogens can dislodge and reenter the airstream to be delivered into the space (Price et al. Citation2005). The AAPT utilized in this study differentiates itself from standard HEPA filtration by inactivating harmful pathogens on a single pass, thereby removing any opportunity for the pathogens to infect occupants. The AAPT provides a level of airborne purity and protection beyond that of traditional HVAC filters such as HEPA filtration. This study describes the first installation of this type of technology within hospital and SLF settings.
The AAPT used in the SLF setting included VOC remediation media in conjunction with the UVGI pathogen remediation technology. VOCs are organic compounds that are highly volatile due to their low vapor pressure at room temperature (Kamal, Razzak, and Hossain Citation2016). VOCs are a known air pollutants and include compounds such as benzene, formaldehyde, toluene, isopropyl alcohol, acetaldehyde, phenol, and xylene (Xiao et al. Citation2014). VOCs are generated and released through typical activities including construction, fuel burning, the use of solvents, paints, adhesives, and cleaning products (Anand, Philip, and Mehendale Citation2014; Conboy et al. Citation2020; Cui, Schito, and Cui Citation2020; Kim Citation2011; Wang et al. Citation2018). VOCs can be classified or grouped based on their chemical structure or their source. There are over 300 unique biochemical groups of VOCs and some common classifications include polar, nonpolar, low molecular weight, high molecular weight, fungal, microbial, and biogenic (Xiao et al. Citation2014). VOCs are dangerous to individuals with compromised respiratory systems and are known to have detrimental effects on pulmonary function, particularly in elderly populations (Yoon et al. Citation2010).
The purpose of the current study was to retrospectively explore the effect of the AAPT on environmental and clinical outcomes utilizing quantitative and qualitative data from two previous large sample studies involving a hospital and SLF. The environmental and clinical hospital data was previously published (Stawicki et al. Citation2019, Citation2020) and the SLF data was previously published (Urrutia et al. Citation2023) and presented at a peer-reviewed international forum (Kelley et al. Citation2021). The combined single-site hospital data and SLF data were presented at the 2022 ASHRAE Annual Conference in Toronto, Canada, and is an extension of the previously published conference paper (Worrilow et al. Citation2022). The multi-site hospital data presented in this study provides additional environmental data with respect to the application of the AAPT within critical clinical spaces in acute care hospitals. The multi-site hospital data has never been published or presented previously. The combination of the single-site hospital data, multi-site hospital data, and the senior living data has not been previously published or presented.
This publication is an expansion of the previously published ASHRAE conference paper (Worrilow et al. Citation2022). The data and analyses for the multi-site hospital setting were not included in the original conference paper. As such, all multi-site hospital setting information and analysis throughout the paper has been added and has never been published or presented before. The descriptions of both the AAPT and the collection and analysis of the environmental and clinical data have been expanded relative to the ASHRAE Transactions publication. Additional metrics have been evaluated for the single site hospital setting including discharge destination and FAI incidence. Resident demographics and information on the cultured pathogens collected from ill and infected residents were also added to the SLF analysis. The novelty of this study lies in the use of the AAPT across the three unique healthcare environments and how the AAPT protected environments compare to similar acute care clinical spaces protected only by HEPA filtration. This air quality management technique, namely the use of the AAPT, has not been used by any other authors or in other studies beyond those cited (Kelley et al. Citation2021; Stawicki et al. Citation2019, Citation2020; Urrutia et al. Citation2023; Worrilow et al. Citation2022).
As such, this work provides an important evaluation of a novel air purification technology across multiple healthcare settings. With airborne pathogens being a common vector of illness across healthcare facilities, the findings highlight the importance of reducing these pathogens to reduce the transmission of harmful illnesses and infections and increase positive clinical outcomes. These results and analysis are an important contribution to the understanding of indoor air quality and overall occupant comfort and health within healthcare facilities. The findings could be applied to buildings across many different industries.
Materials and methods
Advanced air purification technology
The AAPT possesses a unique combination of flexibility and standardization because it is available in a variety of standard sizes and indoor and outdoor configurations. These options allow for flexibility when installing the unit and ensure that each facility can install the technology to best fulfill their unique needs. In this way, the AAPT ensures that form follows function. Facilities install the AAPT in their HVAC ductwork downstream of the air handling unit (AHU), which already contains HEPA filtration. The AAPT replaces a section of ductwork and can be installed either into the ceiling of the facility or in an all-weather configuration on the roof. The installation location, whether inside or on the rooftop, does not affect the effectiveness of the technology. Since the AAPT is installed in the ductwork of the facility, it is continuously operational as long as the air handler is operating. Unlike some other disinfection technologies commonly employed in healthcare settings, the AAPT does not require rooms to be vacated to be used. Its location within the ductwork also ensures that it does not physically take up floorspace within the clinical areas it protects.
The pathogen remediation section of the AAPT employs UVGI technology. This technology is housed inside a reflective enclosure designed to ensure adequate dwell time to remediate all pathogens in the air stream before entering the protected space. The required dwell time is determined by the airflow and the ultraviolet dose required to provide a single pass kill of all pathogens. The AAPT is available in standard sizes to provide the necessary dwell time based on the airflow. The UVGI section of the AAPT is mathematically modeled to provide a single pass kill of all infectious airborne pathogens. This is achieved by destroying the pathogens’ genetic material (DNA and RNA), which prevents them from infecting the occupants of the protected space. The technology destroys the genetic material of microorganisms through a process called photochemical sterilization in which the quantum energy of the UV photons separates covalent bonds within the DNA and RNA of the organism. The separation of these covalent bonds leads to the destruction of nucleic acids and renders the organism nonviable, thus making them incapable of infecting a host (Brais Citation2017). This modeling has been confirmed by testing at the National Homeland Security Research Center in which the AAPT was verified to kill the anthrax spore on a single pass. The AAPT provides a 99.94% kill of the anthrax spore on a single pass, and therefore, the expected kill rates of all other harmful airborne pathogens are expected to be higher. The AAPT achieves this level of air purification without creating any byproducts, intermediate molecules, or ozone. During the lamp making process, UV-C lamps used for disinfection are optimized to fully absorb wavelengths <240 nanometers (nm) and do not emit 184 nm wavelengths. This optimization makes the production of ozone impossible, as ozone can only be produced at wavelengths of 184 nm (Claus Citation2021). The use of a UVGI technology that delivers this level of air disinfection, on a single pass, is unique to this AAPT and is not available elsewhere.
Similar systems were installed in all healthcare settings with the exception of the system installed in the SLF. The hospital installations contained only the pathogen remediation section, described above. The system installed in the SLF contained the same pathogen remediation section as the systems installed in the hospital but also included multiple additional stages of proprietary molecular media. The additional stages of molecular media are specifically designed to remediate all classes of VOCs. Elderly populations contain individuals with compromised respiratory systems and exposure to VOCs causes oxidative stress that can lead to impaired pulmonary function, particularly in these vulnerable populations (Bentayeb et al. Citation2013; Yoon et al. Citation2010). For this reason, it was critical that the SLF environment include aggressive VOC remediation in addition to the pathogen remediation section used in the hospital installations. The use of UVGI technology in combination with the proprietary molecular media is unique to this AAPT and is not available elsewhere.
Single site hospital setting (medical surgical floor)
The AAPT was retrofitted within the existing HVAC ductwork of an acute care hospital’s medical surgical floor (ACH-MSF) and three air filtration zones were studied on two medical surgical floors. The data was collected over the course of a year from December 18, 2017 to December 31, 2018. The three air filtration zones contained the control floor (zone C) that only utilized AHU HEPA remediation, a section of an adjacent medical surgical floor that contained a mixture of AHU HEPA and AAPT remediated return air (zone B), and the remainder of the medical surgical floor with comprehensive AAPT remediation (zone A), as shown in . All three zones contained HEPA filtration within the AHU. The return air from zones A and B were mixed before returning to the AHU, meaning that a portion of the air delivered to zone B was returned from zone A and therefore had a higher purity than the return air on the control floor (zone C). This study uses the term comprehensive AAPT remediation to describe zone A, where all air entering zone A was purified by the AAPT before entering the space.
Fig. 1. Schematic representing zones A, B, and C and the existing heating ventilation, and air conditioning layout for all zones (Stawicki et al. Citation2020). Figures reproduced under the terms of byncnd4.0 international license. Figure previously published in Conference Paper for the 2022 ASHRAE Annual Conference (Worrilow et al. Citation2022).
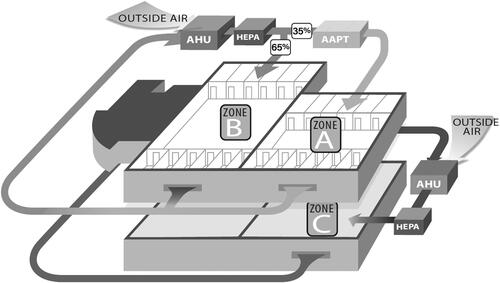
The two ACH-MSF floors had exactly the same physical layout. Zone C, the control floor, was located directly beneath the floor containing zones A and B. The floor with zone C was constructed before the floor with zones A and B, but similar construction practices and materials were employed on both floors. The clinical practices on each floor were also similar, including staffing and standard operating procedures across the different study zones. Care was taken not to implement any new nursing or patient care initiatives during the study period. The study was double blinded to staff, patients, and visitors.
Environmental data
The environmental data was studied prospectively and was previously published (Stawicki et al. Citation2019; Worrilow et al. Citation2022). In each of the three zones, two patient rooms were selected for environmental sampling. These rooms were sampled monthly for eleven out of twelve months. Environmental sampling was performed on the same day each month, using identical staff and protocols. The rooms were active and occupied during the comprehensive air sampling and were selected in such a way to minimize the impact of building features such as entrances, exits, and elevators. Additionally, the rooms were selected to be central to the zone, especially for zones A and B, which were on the same floor. The research team was careful not to perform air sampling in rooms on the border between zones A and B. Finally, the room selection was purposed to assure that direct comparisons of the data would be optimal and that the data collected in each zone could be compared to the other two zones without concern about outside variables impacting the quality of the data.
Each sampling event included a comprehensive sampling of airborne metrics including total VOC (TVOC) loads and airborne bacterial and fungal loads. Additional surface sampling was performed in each patient room which consisted of surface bacterial and fungal swabbing of commonly touched patient and clinical surfaces within the patient room. Three commonly touched patient surfaces were swabbed, including the bedside table directly in front of or next to the patient, the IV support pole, and the number buttons on the patient remote control. These surfaces were selected to be representative of surfaces that patients routinely touch throughout their hospital stay. The clinical surfaces selected for sampling included the IV control faceplate and the pressure cuff bulb. Again, these surfaces were selected because they are routinely touched by doctors, nurses, and other hospital staff throughout a patient’s stay in the hospital. The serial numbers of all equipment sampled was monitored to ensure that the same equipment remained in each room specific to each zone.
displays the various locations sampled and the samples taken in each location. All samples were evaluated by independent third-party laboratories. EMSL Analytical, located in Cinnaminson, NJ, evaluated the fungal and bacterial samples, and SGS Galson, located in East Syracuse, NY, evaluated the VOC samples. Airborne bacterial and fungal air samples were taken by pulling 28 liters per minute of air for 5 min onto agar plates. The samples were drawn onto the agar plates using calibrated pumps and Viable Anderson Cascade Impactors. Soy agar plates were used for the bacterial air samples and MEA agar plates were used for the airborne fungal samples. EMSL used proprietary testing method, MICRO-SOP-132, for the bacterial samples and method MICRO-SOP-202 for the fungal samples. The testing methods used by the laboratory dictated that they culture the samples for 72 h and identify the five most prominent species of bacteria and fungi present.
Table 1. ACH-MSF environmental sampling.
Surface samples were collected using a sterile swab to sample a 2-inch by 2-inch area for each selected surface. Each surface was sampled for ten seconds and the swab was rolled in a forward and backward motion across the surface. After the sample was taken, the swab was sterilely capped and sent to the lab for testing. The third party testing laboratory, EMSL, is capable of running both the bacterial and fungal analysis on the same swab without requiring the use of two swabs. EMSL used proprietary testing method, MICRO-SOP-132 for the bacterial assay and MICRO-SOP-202 for the fungal assay. The laboratory identified and quantified the five most prominent species of bacteria and fungi present on each swab.
TVOC measurements were taken according to the EPA TO-15 method. The TO-15 method of VOC sampling is a canister-based collection method. In this method, cleaned and evacuated stainless steel canisters are fitted with calibrated regulators to draw up to one liter of ambient air into the canister. During each air sampling event, the ambient air was collected over the course of 15 min. Once collected, the samples were sent to a third party independent laboratory for analysis. The laboratory used to analyze the samples in this study was SGS Galson. The analysis laboratory uses gas chromatography mass spectrometry to identify the speciation and concentration of all VOCs present in the sample. The concentration of TVOCs present is reported in both parts per billion by volume (ppbv) and micrograms per cubic meter (µg/m3).
Clinical data
The clinical data was studied retrospectively and was previously published (Stawicki et al. Citation2020; Worrilow et al. Citation2022). The clinical data studied focused on hospital length of stay, hospital charges, and discharge destination. The study was evaluated by the institutional review board (IRB) committee of the hospital and was approved as an IRB exempt protocol. The total admissions to the three zones during the 1-year study period included 8255 patients. Patients were excluded if they did not have a case mix index (CMI) in their medical record when they were discharged. CMI was assigned by the hospital and was used in the statistical analysis of the data to account for comorbidities, diagnoses, and underlying diseases. CMI is traditionally used to determine the number of resources the patient will require during their stay and is a major factor in the payment for admissions. In addition to excluding patients who did not have a CMI in their medical record at discharge, unbalanced bariatric and medicine patients were also excluded from the analyses. Unbalanced subsets of patients were determined utilizing sensitivity analyses and were defined as groups of patients with a skewed distribution between study zones. Sensitivity analyses were used to determine patient distributions across the zones and both these subsets of patients had skewed distributions and were unable to be included. Bariatric patients were excluded because they were not balanced across the three zones. Zone C had two bariatric patients while zone A had 223 and zone B had 238. Zone C clearly did not have an adequate number of bariatric patients to perform any valuable comparisons between this surgical subspecialty. Additionally, emergency surgery was also not included in the final analyses because the data provided did not allow for differentiation between elective operations and emergency operations. After these exclusions, the final number of patients included in the study analysis was 1002, which met all robust statistical criteria.
The data provided did not contain enough detail to properly use statistics to match cases with specific recorded diagnoses. For this reason, the CMI assigned by the hospital was used as a covariate in the statistical analysis to account for the severity of illness. The statistical analyses used included one-way analysis of variance, chi-squared testing, covariance, nonparametric tests, and logistic regression. Additional information on the statistical methods used can be found in the previously published manuscript (Stawicki et al. Citation2020). Significance was set at alpha <0.01 with a 99% confidence interval and the study was powered at 95%. All normalized data used zone C, the control floor, as the reference point and utilized a 95% confidence interval. All data, including hospital length of stay (LOS) and hospital charges, was provided by the hospital directly to an independent third-party epidemiologist.
Multi-site hospital setting (PACU, ICU, MS)
Following the single site hospital setting installation of the AAPT and data collection, the AAPT was installed in a second campus within the same hospital network. The second campus has multiple acute care clinical areas that receive air purified by the AAPT. The AAPT was installed as the hospital was being constructed. Similar to the single site hospital setting, the AAPT was installed into the HVAC ductwork serving the post-anesthesia care unit (PACU), intensive care unit (ICU), and the medical surgical unit (MS). All of the AAPTs installed were located within the ceiling of the hospital. The AAPT units were installed and commissioned in October 2021 and went live in November 2021.
Unlike the single site hospital study, the second hospital with AAPT protected spaces did not have any regions of HEPA-only filtration that could be used as a control zone. For this reason, the multi-site hospital study included two campuses within the same hospital network, one campus with AAPT remediation and HEPA filtration and the other with only HEPA remediation. The two campuses have the exact same physical footprint and are both within the same hospital network, in the same region of Pennsylvania.
Environmental data
The environmental data was studied retrospectively following the same evaluation and sampling methods as the single site hospital setting described previously. Only one room in each critical care space was sampled per campus. The rooms sampled included a patient room in each campus’ PACU, ICU, and MS unit. Two swab sites were selected in each room to represent commonly touched patient and clinical surfaces. These tested surfaces included the bed table and bed rail, both frequently touched by patients and members of the clinical team. All rooms were active and occupied during the sampling to ensure that a representative view of the operational environment was collected during the sampling event. shows the various locations sampled and the samples taken in each location.
Table 2. Multi-site hospital setting environmental sampling.
Clinical data
The demographics were different between the patients at each hospital campus studied and therefore could not be compared in a statistically meaningful manner. There were also differences in the implementation of standard operating procedures because of varying acuity. Most initiatives are standard across the hospital network but do differ between locations due to differences in patient demographics and acuity. The cleaning products used are standardized but the specific cleaning technique may vary from campus to campus. There were too many confounding variables to compare secondary endpoints such as clinical data or economic data. Due to the differences between the demographics and SOPs of the two campuses, clinical and economic outcomes were not able to be accurately evaluated.
Senior living setting
In December 2016, the IRB for the SLF reviewed and approved the proposed study. Since the SLF building was an older structure and there was no space above the ceiling, an all-weather version of the AAPT was retrofitted onto the roof of the facility. During the retrofit process, it was important to the study team that the existing HVAC layout of the facility was not altered, because that layout was representative of a standard HVAC layout found within SLFs. The existing HVAC layout was preserved during installation and none of the terminal air conditioners or unit ventilators were changed. Additionally, all packaged terminal air conditioners and unit ventilators remained operational throughout the duration of the study.
Two different air filtration zones were studied on portions of two different resident floors of the SLF (Kelley et al. Citation2021; Urrutia et al. Citation2023). The data was collected from October 2019 to January 2021. The two zones studied contained a control floor with HEPA filtration and a study floor with comprehensive AAPT remediation, including VOC remediation and HEPA filtration. The floors had identical physical layouts, with the control floor being located directly below the study floor. The building that housed this SLF was an older building that had gone through multiple renovations and additions since its original construction. Both the study floor and the control floor had been originally constructed at the same time by the same contractors, utilizing the same construction materials and techniques. All subsequent renovations and additions to these two floors also occurred at the same time and were completed by the same construction teams. Both study floors also received the same sun exposure. The residents residing on the study floor and the control floor were both memory support residents who did not frequently leave the SLF. Staffing, standard operating procedures, and cleaning protocols were standard across both floors for the duration of the study. All members of staff, residents, and visitors were blinded to the study to ensure that there were no outside factors that could impact the integrity of the study data. Finally, there were no changes made to cleaning procedures, infection control initiatives, or resident care activities to either the study or control floor throughout the study period. Great care was taken when designing the study to ensure that the only difference between the floors was the presence of the AAPT on the study floor.
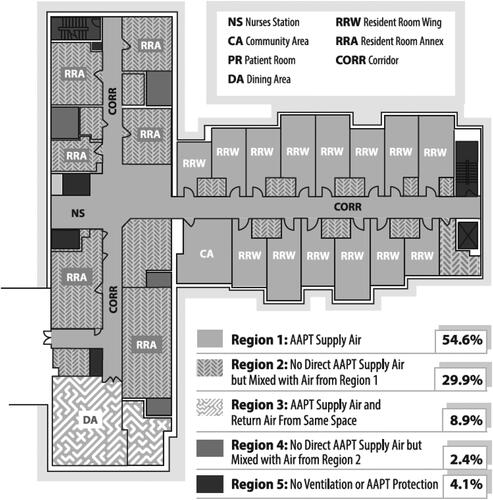
shows the layout of the study floor and a summary of the quality of the air in each location of the floor. The study was performed in a typical SLF HVAC layout. Due to the nature of the ductwork in the building and the individual temperature control required for resident rooms, it was not feasible to supply comprehensively remediated AAPT air to all spaces on the study floor. The system was designed to deliver comprehensive AAPT remediated air to as many spaces as possible (Region 1 on the diagram) and to have locations that did not receive direct AAPT air (Region 2 on the diagram) negatively pressurized and directly adjacent to spaces that did receive purified air. The spaces that received comprehensive AAPT remediated air constituted 54.6% of the total floor space and only 4% of the floor did not have any ventilation and therefore could not benefit from any mixing with AAPT protected air. This airflow design was intended to allow the air that came directly from the AAPT to be directed into and mixed with the non-AAPT remediated air in these adjacent locations.
Fig. 2. Schematic representing the air purity in the various locations of the study floor. Region 1 represents areas that were directly supplied by the AAPT (54.6%). Region 3 represents ventilation air that is AAPT protected air mixed with return air from the same space (8.9%). Region 2 represents areas with no direct supply of AAPT air to the space and these spaces are negative to one of the Region 1 spaces which pull diluted AAPT protected air into the space (29.9%). Region 4 represents no direct supply of AAPT air to the space and these spaces are negative to one of the Region 2 spaces and pull even more diluted AAPT air into the space (2.4%). Region 5 represents spaces that have no ventilation at all and have no AAPT protection (4.1%).
Environmental data
The environmental data was studied and previously published (Urrutia et al. Citation2023; Worrilow et al. Citation2022). The environmental data was studied prospectively following the same evaluation and sampling methods as the single site hospital setting described previously with the exception that the TVOCs were collected for 4 h instead of 15 min. Five different locations were selected on each of the floors for environmental sampling and air quality sampling. The specific locations identified for environmental sampling were selected based on their physical location on the floor and the typical use of the room. The study team performed the environmental sampling during time periods when the rooms were occupied by residents and staff to best capture an accurate representation of the environment in each room sampled. For example, the dining area was sampled during a typical lunch service when the room was filled with residents and staff members. The types of rooms selected for sampling included resident rooms, dining spaces, and community activity spaces. Each resident room has a private bathroom and airborne bacterial and fungal samples were taken in the bathrooms associated with the tested resident rooms. These particular rooms were identified because they were representative of locations residents would frequent throughout a typical day in the SLF. Since the study floor and the control floor had the same physical layout, the rooms sampled on both floors were in the same relative location in the layouts of their respective floors.
The surfaces selected for surface swabbing were chosen to represent commonly touched resident and staff surfaces in each sampled room. These surfaces included hallway railings, the nurses’ station, the remote control for the television, bathroom fixtures, the bedside table in the resident rooms, chair handles, and the food cart handle in the dining room. The environmental sampling was performed on both the study floor and the control floor before and after the installation of the AAPT. shows the various locations sampled and the samples taken in each location.
Table 3. SLF environmental sampling.
Clinical data
The clinical data was studied and published previously (Urrutia et al. Citation2023; Worrilow et al. Citation2022). The clinical data was studied prospectively between the control and study floors and retrospectively between pre- and post-installation. The study took place between October 2019 and January 2021. There were 14 staff and 38 residents per floor and none were excluded. All statistical analyses were performed using SPS 24.0 (IBM, Armonk, NY, USA), and the study was initially powered at 90%. Data were indexed using the control floor as the reference point. All data were provided by the SLF provider and analyzed by an independent third-party epidemiologist. None of the data was normalized because the differences in demographics were not statistically significant.
Results
Single site hospital setting (medical surgical floor)
The previously published environmental data, summarized in , shows that the airborne bacterial, fungal and VOC levels decreased from zone C to zone B to zone A (Stawicki et al. Citation2019; Worrilow et al. Citation2022). This decrease in the airborne contaminants between zones coincides with the increasing air purity between zones, with zone A having the purest air and zone C the least. Similarly, there was a decrease in measured pathogens present on common patient and clinical touch surfaces across the three study zones. In zone A, low levels of Staphylococcus epidermidis, Corynebacterium, and Staphylococcus capitis were identified in the viable bacteria by swab samples. No viable bacteria by air were identified within zone A, therefore the presence of bacteria on the commonly touched surfaces was likely transferred through direct surface-to-surface contact by a patient or member of staff.
Table 4. ACH-MSF key environmental metrics associated with environmental purity.
The main study results for the ACH-MSF data are shown in (Stawicki et al. Citation2020). This graph overlays the environmental data from with the normalized clinical outcomes and compares the study zones (zone A and B) to the control floor (zone C). The clinical outcomes that were studied include hospital LOS and hospital charges. These two metrics were chosen because of their importance to hospital administrators, who strive to maintain a high standard of care for their patients while minimizing LOS and hospital charges (Alexander et al. Citation2007). As seen in , these two critical metrics decreased with increased environmental purity. There was a statistically significant decrease in LOS of 39.5% and the hospital realized cost savings of 23% over the course of the study in zone A compared to zone C.
Fig. 3. The clinical and economic outcomes mirrored the level of environmental purity from zone C to zone B to zone A. PT: particulates; VBBA: viable bacteria by air; VBBS: viable bacteria by swab; VFBA: viable fungi by air; VFBS: viable fungi by swab (Stawicki et al. Citation2020). Figures reproduced under the terms of byncnd4.0 international license. Figure previously published in Conference Paper for the 2022 ASHRAE Annual Conference (Worrilow et al. Citation2022).

The study team also examined differences in discharge destinations between the three zones. It was determined that a statistically significant 87.8% of patients in zone A, the AAPT zone, and 86.5% in zone B, the mixed zone, were discharged to home. In the control zone, zone C, only 63.7% of patients were discharged to home.
An evaluation was performed to determine differences in FAIs, mortality, and readmissions through the use of logistic regression. The analysis adjusted for CMI, age, and source of admission because there were differences in CMI and patient age across the three study zones. It was found that differences in FAIs, mortality, and readmissions were not statistically significant across the three study groups. There was, however, a trend toward lower FAIs with increasing environmental purity. Zone A, the AAPT zone, had an FAI incidence of 0.40%, zone B, the mixed zone, had an FAI incidence of 0.48%, and finally, zone C, the control floor, had an FAI incidence of 0.63%.
Multi-site hospital setting (PACU, ICU, MS)
The environmental data is summarized in . It demonstrates that the airborne bacterial and fungal levels were lower in the AAPT protected acute care clinical spaces than in those with only HEPA filtration. All of the viable bacteria by air samples from the campus with HEPA filtration alone showed confluent growth, which is denoted in the table by CG. Confluent growth is a result of an excessive number of bacterial colonies, such that the lab was unable to accurately quantify or identify the species of bacteria. This is an indication that there were thousands of colonies of bacteria present in the sample. There were also lower levels of measured bacterial pathogens present on commonly touched patient and clinical surfaces in the AAPT protected PACU and ICU compared to the HEPA protected PACU and ICU.
Table 5. ACH-MSF key environmental metrics associated with environmental purity.
Senior living setting
Resident demographics were analyzed for the control floor and the study floor of the SLF during the study period. The demographics analyzed, summarized in , included the number of residents living on the floor during the study period, the gender of the residents represented by the percentage of female residents, the race of residents represented by percent Caucasian, African American, Hispanic, and other, the etiology represented as the percentage of residents with dementia, and the mean age of the residents. There was no statistical significance found for any of the demographics analyzed between the study floor and the control floor. This lack of statistical significance indicates that there were no outside factors influencing the results of the study and that the two floors were statistically equivalent. The only difference between the control floor and the study floor was the presence of the AAPT on the study floor.
Table 6. SLF demographics.
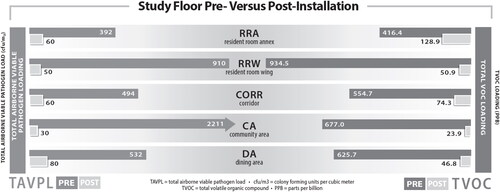
The environmental data comparing the study floor pre- and post-AAPT installation is presented in . This data clearly shows that there was a significant reduction in airborne pathogens and VOC levels that coincided with the installation of the AAPT across all sample locations. An 88.43% reduction in airborne biological and fungal pathogens and an 89.88% reduction in VOCs was achieved by the SLF.
Fig. 4. SLF airborne environmental metrics associated with environmental purity. Figure modified from previously published figure in Conference Paper for the 2022 ASHRAE Annual Conference (Worrilow et al. Citation2022).
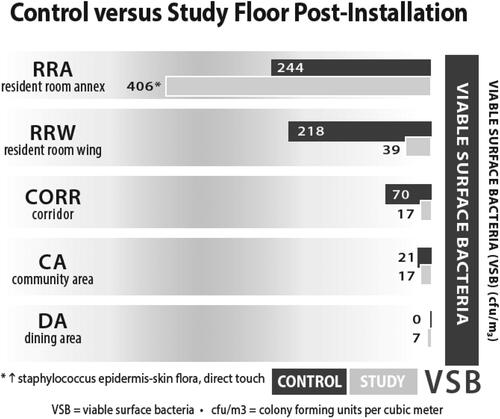
summarizes the surface pathogen data collected on commonly touched surfaces swabbed in each location between the study and control floors. The data presented in this figure summarizes all swab data taken in each sample location. There was a significant reduction in surface bacteria in all locations except for the resident room annex. The bacteria identified in the samples taken in the resident room annex of the study floor was Staphylococcus epidermidis, which is commonly found on the skin and in mucous membranes (Vuong and Otto Citation2002). Since this pathogen is typically identified on the skin, it was likely transferred to the surface directly from a resident or staff member. It is unlikely that the Staphylococcus epidermidis identified in this sample was originally from the air and subsequently settled onto the surface. Since the AAPT only eliminates airborne pathogens as they pass through the system, it is unable to influence any pathogen transfer that occurs between residents, staff, or visitors and the surfaces they directly contact.
Fig. 5. SLF surface environmental metrics associated with environmental purity. Figure previously published in Conference Paper for the 2022 ASHRAE Annual Conference (Worrilow et al. Citation2022).
The clinical outcomes are summarized in . The overall pre-installation FAI rate for the SLF was 17.3% and is defined as the total number of infections divided by the total number of patient days. The FAI rates were analyzed in two different ways. First, a prospective evaluation compared the FAIs on the study floor to the control floor during the study period. This evaluation demonstrated a 39.6% reduction in FAIs on the study floor. Secondly, a retrospective evaluation compared the FAI rates on the study floor pre- versus post-installation. This evaluation demonstrated a 54.5% reduction in FAIs on the study floor post-installation. The difference in FAI rates pre- and post-installation for the control floor was not statistically significant, which confirms that there were no outside factors influencing the FAI rate during the study period. Staff callouts, though not originally included as a metric in the study, were also analyzed with a 47% reduction in call outs post-installation compared to pre-installation. This reduction in staff call outs was statistically significant.
Table 7. SLF clinical outcomes: number of FAIs.
The SLF provided a list of pathogens cultured from ill and infected residents on the control floor throughout the study period. These pathogens were determined to be responsible for FAIs and illness on the control floor. lists all the microorganisms cultured from the control floor and whether these pathogens are transmissible by the air. The vast majority of the pathogens cultured on the control floor have an airborne mode of transmission. These pathogens were notably absent from the study floor, indicating that the AAPT was successfully remediating all airborne pathogens from the air entering the study floor.
Table 8. Pathogens cultured from control floor residents.
Discussion
Airborne and surface pathogens are common vectors of illness and infection. The hospital and SLF settings examined in this study adhered to industry standards of air filtration and room sterilization practices before the installation of the AAPT. These practices, including HEPA filtration and routine cleaning, were consistently maintained throughout the studies in both the control and AAPT areas. It was critical to keep all aspects of each facility’s operation unchanged during the study periods, with no new initiatives introduced except for the installation of the AAPT for the single site hospital study and the SLF study. Care was also taken to keep these studies confidential from healthcare workers, cleaning staff, patients, and residents to prevent any behavioral changes that could influence the study results. By maintaining consistent operations and blinding, the results of the studies show the impact of the AAPT when compared to the single site hospital and SLF building types pre-retrofit. The control floor data along with the pre- and post-installation data provide insight into the typical operation of these facilities.
The results demonstrate the presence of both airborne and surface pathogens in the samples taken from the HEPA protected control floor of the single site hospital facility. The significant reduction in LOS and hospital costs experienced by the ACH-MSF provides a compelling argument for the installation of the AAPT beyond the environmental benefits. Hospitals are continuously striving to uphold the highest standard of care available while reducing costs (Alexander et al. Citation2007). In this study, 87.8% of patients in zone A were discharged to home compared to 63.7% in the control zone (zone C). The improved discharge metrics and reduced LOS indicate that there was no lapse in standard of care provided in the zones that experienced cost savings (Stawicki et al. Citation2020; Worrilow et al. Citation2022). In fact, patients in these zones experienced better outcomes than those in the control zone. Furthermore, given the remarkably low baseline FAI rate, the trend toward lower FAIs in the AAPT zones compared to the control zone is a promising insight, despite not meeting statistical significance.
The multi-site hospital analysis was conducted after both hospital campuses were constructed and operational. Due to the nature of this study, it was impossible to implement the same controls as had been implemented in the single site hospital study or the SLF study. For example, there was a hand washing initiative implemented at the campus with the AAPT units that was not implemented at the campus with only HEPA filtration. For this reason, surface data is not a good indicator of the overall effectiveness of the AAPT in purifying the air. The airborne bacterial and fungal data, however, is a strong indicator that the AAPT was remediating airborne pathogens compared to standard HEPA filtration. The airborne bacteria and fungi levels were lower in all clinical areas tested in the AAPT-protected hospital campus as compared to the hospital campus with HEPA filtration alone. In addition, the hospital campus with only HEPA filtration showed confluent growth on all agar plates used for the collection of airborne bacterial samples. Although confluent growth does not allow for accurate quantification of the bacteria collected, it is an indicator of an extremely large number of bacteria present in the sample. Conversely, the AAPT protected spaces showed extremely low levels of airborne bacteria. Due to the nature of the multi-site hospital study, it was not possible to perform an analysis on clinical or economic metrics.
Likewise, the results from the SLF show the presence of airborne and surface pathogens present on the HEPA protected control floor and in the pre-installation samples. The Community Area had comparatively low airborne and surface pathogen levels measured during the pre-installation sampling and the sampling of the control floor. The authors hypothesize that the lower levels of pathogens in this area compared to the others tested, particularly the resident rooms, was because this space was larger and less densely occupied. Residents on the study floor in the SLF experienced statistically significant reductions in FAIs. The reduction in FAIs is especially important in SLFs because the aging population in these facilities are particularly susceptible to infections and illness because of underlying conditions, compromised immune systems, and fragility (Stuart, Lim, and Kong Citation2014). Reducing FAIs has a direct and positive impact on resident wellness and quality of life, preferred provider ratings, increased referrals, citation reductions, and reduced admissions of residents to hospitals for FAIs.
The presence of airborne and surface pathogens on the control floors of the single site hospital facility and the SLF poses a potential risk of illness and infection for occupants, highlighting the need for improvement. Installing the AAPT in the ACH-MSF and SLF resulted in significant reductions in airborne pathogens, which also led to a substantial decrease in surface pathogens because airborne pathogens can be deposited onto surfaces and infect individuals on contact (Lee et al. Citation2022). The multi-site hospital study further demonstrated lower levels of airborne bacteria and fungi in the AAPT-protected spaces compared to those with only HEPA filtration. The study confirmed that the AAPT effectively removes infectious airborne bacteria and fungi, surpassing the capabilities of HEPA filtration alone. Consequently, the AAPT mitigates a common vector of illness that is present even in facilities with HEPA filtration. The reduction in airborne pathogen loading was concomitant with reductions in FAIs, LOS, improved discharge outcomes, and positive economic implications. Minimizing airborne pathogens, a prominent source of illness, is crucial for establishing a safe environment for all individuals including patients, senior residents, staff, and visitors.
Conclusion
Indoor air quality is known to be of great importance in providing safe and healthy environments across all facilities, particularly, in healthcare and senior living environments (Lindvall, Maroni, and Seifert Citation1995). Others have previously shown the link between ventilation and airflow within buildings and the spread of harmful pathogens and diseases (Li et al. Citation2007). Air quality management systems are needed in healthcare facilities to protect patients, residents, staff, and visitors (Leung and Chan Citation2006). The AAPT offers an effective solution to significantly reduce a common vector of illness and infection by decreasing the presence of harmful airborne pathogens. The comprehensive removal of infectious airborne pathogens in the operational healthcare and SLF study coincided with improved clinical and wellness outcomes. Additionally, the AAPT technology provides significant improvements to indoor air quality and clinical and economic metrics without requiring any changes in staff protocol or behavior. Such improvements are uncommon and without any impact on daily operations.
The findings of this study support the hypothesis that environmental factors impact wellness and can be applied to other indoor environments across different industries. These studies demonstrate, for the first time, the impact of an AAPT on environmental, clinical, and economic metrics during live operation. Healthcare and SLFs are not the only facilities that could benefit from high levels of indoor air quality. The AAPT could be implemented to create environmental health benefits for individuals and settings in other industries and applications. Consequently, further research is warranted in this important and understudied area.
Acknowledgments
St. Luke’s University Hospital Network (SLUHN) and Phoebe Ministries made significant contributions toward the research design, sample collection, and analysis. The single site and multi-site hospital data was collected in collaboration with SLUHN. The SLF data was collected in collaboration with Phoebe Ministries. Thanks are due to SLUHN and Phoebe Ministries for their work on these studies.
Disclosure statement
A portion of this paper was presented as a Conference Paper at the 2022 ASHRAE Annual Conference in Toronto, Ontario, Canada that took place from June 25 to 29, 2022. The Conference Paper was published in ASHRAE Transactions and the title of the Conference Paper was “The Effects of Air Purification Technology on Environmental and Clinical Metrics in Two Healthcare Settings.” This manuscript is an extension of the previously published Conference Paper.
References
- Alexander, J. A., L. R. Hearld, H. J. Jiang, and I. Fraser. 2007. Increasing the relevance of research to health care managers: Hospital CEO imperatives for improving quality and lowering costs. Health Care Management Review 32 (2):150–9. 10.1097/01.hmr.0000267792.09686.e3.
- Anand, S. S., B. K. Philip, and H. M. Mehendale. 2014. Volatile organic compounds. Encyclopedia of Toxicology 3:967–70.
- Bentayeb, M., M. Simoni, D. Norback, S. Baldacci, S. Maio, G. Viegi, and I. Annesi-Maesano. 2013. Indoor air pollution and respiratory health in the elderly. Journal of Environmental Science and Health. Part A, Toxic/Hazardous Substances & Environmental Engineering 48 (14):1783–9. 10.1080/10934529.2013.826052
- Brais, N. 2017. Air disinfection for ART clinics using ultraviolet germicidal irradiation. In Clean room technology in ART clinics: A practical guide, ed. S. C. Esteves, A. C. Varghese, and K.C. Worrilow, 119–32. Boca Raton, FL: Taylor & Francis Group; CRC Press.
- Claus, H. 2021. Special issue invited review: Ozone generation by ultraviolet lamps. Photochemistry and Photobiology 97 (3):471–6. 10.1111/php.13391
- Conboy, N. J. A., T. McDaniel, D. George, A. Ormerod, M. Edwards, P. Donohoe, A. M. R. Gatehouse, and C. R. Tosh. 2020. Volatile organic compounds as insect repellants and plant elicitors: An integrated pest management (IPM) strategy for glasshouse whitefly (Tiraleurodes vaporariorum). Journal of Chemical Ecology 46 (11–12):1090–104. 10.1007/s10886-020-01229-8
- Cui, P., G. Schito, and Q. Cui. 2020. VOC emissions from asphalt pavement and health risks to construction workers. Journal of Cleaner Production 244:118757. 10.1016/j.jclepro.2019.118757
- Eckmanns, T., H. Rüden, and P. Gastmeier. 2006. The influence of high-efficiency particulate air filtration on mortality and fungal infection among highly immunosuppressed patients: A systematic review. The Journal of Infectious Diseases 193 (10):1408–18. 10.1086/503435
- Kamal, M. S., S. A. Razzak, and M. M. Hossain. 2016. Catalytic oxidation of volatile organic compounds (VOCs) – A review. Atmospheric Environment 140:117–34. 10.1016/j.atmosenv.2016.05.031.
- Kelley, K. C., S. D. Schlener, L. Levicoff, and S. P. Stawicki. 2021. Economic effects of air purification technology on healthcare-acquired infection costs: A study of simulated implementation across low-and-middle-income regions of the globe. International Journal of Academic Medicine 7:285–6.
- Kim, B. R. 2011. VOC emissions from automotive painting and their control: A review. Environmental Engineering Research 16 (1):1–9. 10.4491/eer.2011.16.1.001
- Kowalski, W. J. 2007. Air-treatment systems for controlling hospital-acquired infections. HPAC Engineering 79:2–22.
- Lee, L. D., G. Delclos, M. L. Berkheiser, M. T. Barakat, and P. A. Jensen. 2022. Evaluation of multiple fixed in-room air cleaners with ultraviolet germicidal irradiation, in high-occupancy areas of selected commercial indoor environments. Journal of Occupational and Environmental Hygiene 19 (1):67–77. 10.1080/15459624.2021.1991581
- Leung, M., and A. H. S. Chan. 2006. Control and management of hospital indoor air quality. Medical Science Monitor 12 (3):SR17–23.
- Li, Y., G. M. Leung, J. W. Tang, X. Yang, C. Y. H. Chao, J. Z. Lin, J. W. Lu, P. V. Nielsen, J. Niu, H. Qian, et al. 2007. Role of ventilation in airborne transmission of infectious agents in the built environment? A multidisciplinary systematic review. Indoor Air 17 (1):2–18. 10.1111/j.1600-0668.2006.00445.x.
- LifeAire Systems. 2021. https://lifeaire.com/.
- Lindvall, T., M. Maroni, and B. Seifert. 1995. Indoor air quality: A comprehensive reference book. Vol. 3. Amsterdam: Elsevier.
- Price, D. L., R. B. Simmons, S. A. Crow, and D. G. Ahearn. 2005. Mold colonization during use of preservative-treated and untreated air filters, including HEPA filters from hospitals and commercial locations over an 8-year period (1996–2003). Journal of Industrial Microbiology & Biotechnology 32 (7):319–21. 10.1007/s10295-005-0226-1.
- Sharpe, P. A., and M. G. Schmidt. 2011. Control and mitigation of healthcare-acquired infections: Designing clinical trials to evaluate new materials and technologies. HERD: Health Environments Research & Design Journal 5 (1):94–115. 10.1177/193758671100500109.
- Sherertz, R. J., A. Belani, B. S. Kramer, G. J. Elfenbein, R. S. Weiner, M. L. Sullivan, R. G. Thomas, and G. P. Samsa. 1987. Impact of air filtration on Nosocomial aspergillus infections: Unique risk of bone marrow transplant recipients. The American Journal of Medicine 83 (4):709–18. 10.1016/0002-9343(87)90902-8
- Stawicki, S. P., C. Brisendine, L. Levicoff, F. Ford, B. Snyder, S. Eid, and K. C. Worrilow. 2019. Comprehensive and live air purification as a key environmental, clinical, and patient safety factor: A prospective evaluation. Vignettes in Patient Safety 4:968–74. 10.5772/intechopen.84530.
- Stawicki, S. P., S. Wolfe, C. Brisendine, S. Eid, M. Zangari, F. Ford, B. Snyder, W. Moyer, L. Levicoff, and W. R. Burfeind. 2020. The impact of comprehensive air purification on patient duration of stay, discharge outcomes, and health care economics: A retrospective cohort study. Surgery 168 (5):968–74. 10.1016/j.surg.2020.07.021.
- Stuart, R., C. J. Lim, and D. Kong. 2014. Reducing inappropriate antibiotic prescribing in the residential care setting: Current perspectives. Clinical Interventions in Aging 9:165–77. 10.2147/cia.s46058.
- Urrutia, A. R., S. D. Schlener, S. Eid, K. A. Bock, and K. C. Worrilow. 2023. The effects of an advanced air purification technology on environmental and clinical outcomes in a long-term care facility. The Journals of Gerontology: Series A 78:glad113. 10.1093/gerona/glad113
- Vuong, C., and M. Otto. 2002. Staphylococcus epidermidis infections. Microbes and Infection 4 (4):481–9. 10.1016/s1286-4579(02)01563-0
- Wang, H., Z. Xiang, L. Wang, S. Jing, S. Lou, S. Tao, J. Liu, M. Yu, L. Li, L. Lin, et al. 2018. Emissions of volatile organic compounds (VOCs) from cooking and their speciation: A case study for Shanghai with implications for China. The Science of the Total Environment 621:1300–9. 10.1016/j.scitotenv.2017.10.098
- Worrilow, K. C., S. P. Stawicki, S. D. Schlener, A. R. Urrutia, and C. N. Kimble. 2022. The effects of air purification technology on environmental and clinical metrics in two healthcare settings. Paper presented at 2022 ASHRAE Annual Conference, Toronto, Ontario, Canada, June 26.
- Xiao, G., W. Xu, R. Wu, M. Ni, C. Du, X. Gao, Z. Luo, and K. Cen. 2014. Non-thermal plasmas for VOCs abatement. Plasma Chemistry and Plasma Processing 34 (5):1033–65. 10.1007/s11090-014-9562-0
- Yoon, H.-I., Y.-C. Hong, S.-H. Cho, H. Kim, Y. H. Kim, J. R. Sohn, M. Kwon, S.-H. Park, M.-H. Cho, and H.-K. Cheong. 2010. Exposure to volatile organic compounds and loss of pulmonary function in the elderly. The European Respiratory Journal 36 (6):1270–6. 10.1183/09031936.00153509.