
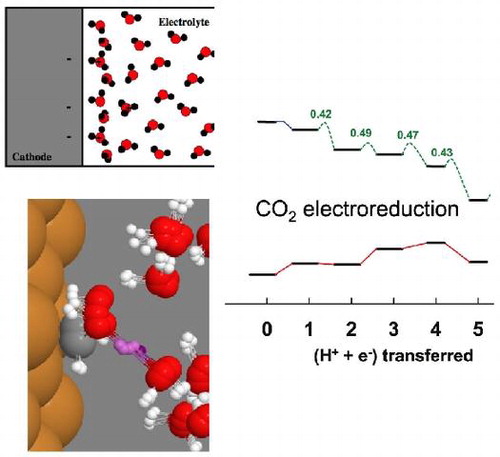
Graphical Abstract
Abstract
The methodology for atomic scale calculations of electrocatalysis in order to identify mechanisms and estimate reaction rates is reviewed. These include: (1) the application of an external electrical field or potential in density functional theory calculations, (2) the thermochemical model for estimating the onset potential of an electrochemical reaction, and (3) calculations of transition paths in atomic scale models of the electrical double layer. Hydrogen evolution reaction, oxygen reduction reaction as well as CO and N
electrochemical reduction to form methane and ammonia are taken as examples. Calculations of reaction rates based on the estimation of the activation energy of elementary steps from minimum energy paths and transition state theory have been shown to provide accurate estimates of rates even for complex reactions and competing reaction mechanisms. There is room, however, for further improvements and some of those are also mentioned at the end of this mini-review.
1. Introduction
Over the past few decades, computational methods based on density functional theory (DFT) for describing electronic degrees of freedom and rate theory for estimating reaction rates, in particular transition state theory, have been highly successful in describing atomic scale processes at metal surfaces. Surface catalyzed reactions have been described in great detail and the results found to be in close agreement with experimental measurements [Citation1,Citation2]. This has laid the foundation for designing new heterogeneous catalysts in a rational way based on predictions obtained from computer simulations [Citation3].
Analogous calculations of electrocatalysis are more difficult because of the complexity of the electrode–electrolyte interface. In addition to adsorbed species on a solid surface, it is necessary to describe an electrolyte, typically a liquid with solvated ions, as well as the effect of applied electrical potential. Several theoretical approaches have been proposed, representing different levels of approximation and considerable advance has been made in recent years. The goal of this mini-review is to give a brief overview of some of these approaches and present examples that illustrate successes as well as failures. Since the length of this review article is limited, only a few examples are given, admittedly biased towards the work done in our research groups. Reviews which complement the present one can be found in Refs. [Citation4–Citation9].
The charge at the surface of an electrode creates a cloud of counter charge in the electrolyte to form what is referred to as the electrical double layer. This has been analyzed extensively using statistical mechanics [Citation10,Citation11]. The charge at the electrode surface is screened so the electrical field is limited to a small region near the electrode as illustrated schematically in Figure for a water splitting cell. As a result, the two electrodes can be treated separately as half cells. By convention the potential of a half cell is measured with respect to the standard hydrogen electrode or reversible hydrogen electrode. In computer simulations, it is more convenient to use the vacuum as a reference [Citation12–Citation16].
Figure 1. Schematic of an electrolytic cell for splitting water to form H and O
.
We discuss below three different levels of approaches for atomic scale calculations of electrocatalysis. First, calculations with an applied external electrical field or potential difference are discussed including some examples of the effect on molecular binding at surfaces. Then, a simple model is presented where the free energy of the various intermediates in an electrochemical reaction is estimated without taking the electrical potential into account, but subsequently modified to include the effect on the chemical potential of the electrons. Finally, detailed modeling is described where the electrical double layer is simulated and transition paths for electrochemical reactions calculated to estimate the activation energy and reaction rate as a function of electrical potential.
2. Methodology
Several different issues come up when studying an electrochemical half cell. As illustrated in Figure , a large electrical field can be present close to the electrode surface. This can affect the energetics and structure of admolecules at the electrode surface. The presence of an electrical potential affects, furthermore, the chemical potential of electrons and ions in the electrolyte and a key issue is how this modifies the free energy changes in the elementary steps of the electrochemical reaction. Finally, the reaction mechanism and activation energy of the elementary steps is affected by the presence of the electrical potential. These issues can be addressed with methods of increasing complexity, as described in the following three subsections.
2.1. Applied external field or potential difference
An important question is how the presence of an external electrical potential affects the binding of molecules to the electrode surface. Typically, the surface of a solid is represented by a surface of a slab subject to periodic boundary conditions in two directions, but with vacuum boundaries on two sides in the third direction, as illustrated in Figure (a) (see, however, the discussion section below).
Figure 2. (a) Side view of a slab representing a missing row reconstructed Pt(110)-2x1 surface on each side. (b) A sawtooth-shaped exernal potential is applied over the slab to create an applied electrical field. A decrease in the electron density is denoted by blue color while an increase is denoted by red/yellow. (c) A near square wave-shaped external potential is applied over the slab to mimic an applied potential. The single slab represents an anode on one side and a cathode on the other side as well as the source of the applied potential in the center of the slab.
A constant external field can be applied over the slab by adding a sawtooth potential as illustrated in Figure (b). The metal slab responds to the applied electrical field by transferring electrons from one side of the slab to the other. The methodology for doing this is already in place in typical DFT software used for surface science calculations because of the need to cancel out surface dipoles and remove spurious interaction between the periodic images of the slab. This approach has been used to calculate an electrochemical phase diagram for the oxidation and reduction of water over the Pt(111) surface [Citation18]. There, a comparison was made with other approaches for assessing the effect of the electrical field and good agreement found. The effect of the electrical field on the adsorption energy of the covalently bound H, O, and OH on the surface relative to HO, was found to be small [Citation18]. The electrical field has, however, been found to have a relatively large effect on closed shell molecules, such as N
and CO
, which otherwise interact only weakly with the electrode surface. Figure shows how the interaction of the CO
molecule with a platinum surface increases and the molecule becomes bound when the magnitude of the local electrical field exceeds 0.5 V/Å [Citation17]. For a positive field where electrons are driven from the surface to the CO
, the admolecule becomes distorted and chemical bonding can be detected through orbital hybridization seen in the local density of states calculated within Bader volumes [Citation17]. For the opposite polarity, the CO
molecule remains linear and the interaction with the surface is only due to polarization. Similar, polarization interaction and binding to the surface has been found for the N
molecule [Citation17].
Figure 3. Adsorption of a CO molecule on a platinum surface when an electrical field is applied. The molecule binds to the ridge of a missing row reconstructed Pt(110)-2x1 surface.
Instead of applying an external field of a given magnitude, a specified potential difference can be applied between the two sides of the slab as illustrated in Figure (c). There, the slab is effectively representing both the cathode and the anode as well as the source of the applied bias. Again, the charge transfer from one side of the slab to the other is evident in the electron density, as illustrated in Figure (c).
While the direct influence of the electrical field on, for example, the H-adatom binding on an electrode surface is rather weak, the applied potential directly modifies the chemical potential of the electrons involved in the electrochemical process. That in turn affects the formation and stability of surface species relative to ions in the electrolyte, and thereby affects the surface coverage. An increase in the coverage results in occupation of weaker binding sites [Citation19,Citation20]. The interaction between the adatoms can, furthermore, cause the binding energy of a given site to be strongly coverage dependent [Citation21,Citation22].
A key issue in electrochemical simulations with an aqueous electrolyte is the ordering of water molecules near the electrode surface. An appropriate water surface structure is important for establishing the appropriate electrochemical and electrocatalytic behavior. Several simulation studies have been carried out to address this issue [Citation23–Citation25].
2.2. The thermochemical model
The change in chemical potential and, thereby, the free energy of the reactants, intermediates and products by the electrical potential is typically more important than the local electrical field discussed above. This can be taken into account in a simple way by realizing that the free energy calculated in the absence of an electrical potential needs to be adjusted by for each electron that reacts [Citation26]. At zero potential with respect to the hydrogen electrode,
, the reaction
is in equilibrium so the free energy of H
in the gas phase at standard conditions can be directly related to the free energy of electrons in the electrode and protons in the dielectric. By applying an external potential, U, the chemical potential of the electron changes by
. If the free energy of reactants, intermediates and products is first calculated with respect to H
at standard conditions, an applied potential of U can then easily be taken into account by shifting the free energy by
for each electron that reacts [Citation26]. The calculated free energy change in each of the elementary step of the electrochemical reaction can thus be adjusted to take the presence of the external potential into account. This is referred to as the thermochemical model (TCM) because it is based on thermodynamics without accounting for the effect of activation energy in each of the elementary step on the kinetics.
The TCM was first applied to the oxygen reduction reaction (ORR) where the overpotential was estimated as the applied potential required to ensure that no step in the reaction mechanism is uphill in free energy. This gave an estimate in close agreement with the experimentally observed overpotential [Citation26]. The key issue for this reaction turns out to be the Sabatier principle: too large oxygen adsorption energy gives too stable *O and *OH intermediates on the surface, while too weak interaction between O and the surface makes the activation of O too difficult. A great deal of computational studies has been carried out in the past decade on ORR using this approach. For example, several reaction paths have been studied on various substrates including metal overlayers and alloys (see, for example, [Citation27,Citation28]). Since ORR is the rate limiting reaction in hydrogen fuel cells, the search for an improved or less expensive catalyst than Pt is an important ongoing research topic.
Figure 4. Examples of calculations where the thermochemical model is used to predict the onset potential as the U needed for the free energy not to increase in any of the elementary steps.
Other examples of the use of the TCM are shown in Figure . A free energy diagram for the stepwise reduction of N to ammonia on a stepped Ru(0001) surface by the associative mechanism [Citation29] is shown in Figure (a). In the absence of an applied potential, the largest free energy rise in an elementary step occurs when *N
H is reduced to *N
H
, 0.43 eV. This means that a potential of –0.43 V needs to be applied so that none of the elementary steps is uphill in free energy. The TCM estimate of the onset potential is, therefore, –0.43 V but the overpotential is estimated to be 0.49 V because the products are 0.06 eV higher in free energy than the reactants. At present, there is no experimental estimate to compare with. The development of a practical way to reduce N
to ammonia electrochemically under ambient conditions, remains an important challenge because of the great need for less expensive fertilizer. Some progress towards the identification of an efficient catalyst for this reaction has recently been made [Citation31,Citation32].
Figure (b) shows another example of an important reduction reaction, the formation of methane from CO [Citation30,Citation33]. This free energy diagram shows electrochemical reduction at a Pt(111) electrode and is chosen here to illustrate how the free energy of an intermediate can be placed in such a way as to minimize the TCM estimate of an overpotential. The increase in the free energy in the two elementary steps with the largest rise, the reduction of *CO–*COH and the reduction of *COH–*CHOH, happens to be equally large at
. In both cases the free energy increases by 0.35 eV so the TCM estimate of the onset potential is –0.35 V. The free energy of the intermediate *COH has an optimal value on this surface for minimizing the estimated overpotential since a lowering of the free energy of *COH will make its reduction more difficult, while raising the free energy of *COH will make its formation more difficult. In either case, the onset potential would become a larger negative number.
The TCM calculation of CO reduction on Pt(111), however, also illustrates a limitation of the approximations involved since it is known experimentally that CO
is not reduced on platinum electrodes even at a much larger negative potential [Citation35,Citation36]. The TCM does not take into account activation energy, i.e. energy of transition states. It can, therefore, only give a lower bound on the magnitude of the overpotential.
2.3. Atomic model of the double layer
In order to determine the reaction mechanism and the activation energy and, thereby, the rate of electrochemical reactions, a more detailed simulation needs to be carried out than the one involved in the TCM. As mentioned in the introduction, this is a challenging task because of the complexity of the electrical double layer. Several different approaches have been proposed and three of those are illustrated schematically in Figure . They differ mostly in the way the counterions in the dielectric are represented.
Figure 5. Comparison of three different approaches to atomic scale simulations of an electrochemical half cell, here a cathode for the hydrogen evolution reaction. In each case, excess electron(s) are introduced in the metal slab representing the electrode, but the compensating positive charge is represented in different ways.
Figure (a) illustrates an approach where a model atomic structure of the dipole layer is first set up [Citation14]. Additional H-atoms are introduced in a water layer and they turn into solvated protons as electrons get transferred to the electrode when the configuration of the atoms as well as the electronic structure are relaxed so as to minimize the energy. The external potential is then deduced from the long range value of the effective potential in the vacuum, i.e. the work function. This method was first used to determine the mechanism and rate of the hydrogen evolution reaction, where it was found that the Volmer/Tafel mechanism is preferred on most transition metal surface at small applied voltage, but Heyrovsky mechanism becomes possible for large, negative potential [Citation14,Citation20].
Figure (b) illustrates an approach where a uniform compensating charge is spread over the simulation box to balance out charge placed in the electrode [Citation13,Citation42]. A correction to the energy due to the interaction with the uniform charge with the system needs to be applied. Since the counter charge is not localized near the surface of the electrode, the variation of the effective potential of an electron is smoother than in Figure (a) and the electrical field near the electrode surface smaller, as illustrated in Figure (b). This approach has been used to study the electrochemical oxidation of methanol [Citation43].
Figure (c) illustrates an approach where the counter charge is represented by a continuum dielectric layer placed in contact with an atomistic representation of the dielectric [Citation44–Citation46]. The continuum dielectric is charged in such a way as to ensure overall charge neutrality. Here, the effective potential of an electron changes significantly at both interfaces, the electrode/dielectric interface and the atomistic-dielectric/continuum-dielectric interface. Continuum dielectric approaches have also been reported by other research groups [Citation47–Citation49,Citation68]. As mentioned above, a detailed atomic scale representation of the electrode and the dielectric is needed in order to study the reaction mechanism and estimate the rate of an electrochemical reaction. One example application of the method illustrated in Figure (a) will now be described, the electrochemical reduction of CO to form methane. Recently, several groups have presented calculations of energy barriers for the reduction of CO or CO
on metal surfaces [Citation30,Citation33,Citation50,Citation53]. Figure (a) shows part of the simulated system and the calculated minimum energy path for the protonation of a CO molecule adsorbed on a Cu(111) surface. First, a copper slab with (111) surfaces is set up with the CO admolecule, in contact with a bilayer of water including one or more extra hydrogen atoms. The system is annealed and the energy then minimized to a local energy minimum. The corresponding electrical potential is determined from the long range value of the work function in the vacuum region [Citation15,Citation20]. It is assumed that an equilibrium between protons in solution and protons in the water bilayer is maintained so the free energy of the two remains equal. The final state where a proton has attached to the O-atom is also annealed and local energy minimum found. The climbing image nudged elastic band method is then used to determine a minimum energy path for the reaction [Citation54–Citation56]. Figure (a) shows five images in a nine image calculation, including the initial state and up to the saddle point configuration (the remaining four images are not shown for clarity). The relaxation of the various atoms along the path can be seen from the distribution of the corresponding images. An analogous representation of the minimum energy path for the reduction of COH–CHOH is shown in Figure (b) where eight images representing the path from the initial state to the saddle point are shown. These are computationally intensive calculations. Recent improvements in NEB methodology can reduce the computational effort significantly, including better initial path generation [Citation57] and machine learning to reduce the number of DFT calculations needed to converge on the minimum energy path [Citation58,Citation59].
Figure 6. Calculations of CO reduction to methane at a Cu(111) electrode at 300 K using the method illustrated in Figure (a).
Since a proton is removed from the water layer and an electron from the electrode during these reactions, the corresponding electrical potential changes along the minimum energy paths. This is an artifact of the finite size of the simulated system and the calculation needs to be repeated for larger systems corresponding to the same initial density of protons and the results then extrapolated to infinite size to obtain an accurate estimate of the activation energy. The results of such calculations are shown in Figure (c) for the various steps in the electrochemical reduction of CO on Cu(111). As a larger negative potential is applied, the free energy landscape for forming CH
from CO
is tilted more in favor of the products and the activation energy for the various elementary steps is decreased. For an applied potential of –1.3 V all energy barriers are below 0.5 eV, in good correspondence with experimental observations of a significant rate of formation of CH
at this bias [Citation35,Citation36,Citation38].
The optimal mechanism for electrochemical CO reduction to methane on Cu(111) is found to be [Citation30,Citation33]
(1)
We note that this mechanism is quite different from the mechanism deduced from the TCM where only the free energy of intermediates (in the absence of a water layer) is taken into account, but not the activation energy of the elementary steps [Citation39–Citation41]. There, CHO, CHO and CH
O are predicted to be intermediates. However, CH
O has been excluded as an intermediate by laboratory measurements [Citation37]. This example, along with the Pt(111) calculation shown in Figure (b), illustrates the importance of having an estimate of the activation energy when determining the mechanism. The calculated rate of formation of other hydrocarbons and alcohols in electrochemical reduction of CO
[Citation34] using the approach outlined above for methane formation has been found to be in remarkably good agreement with experimental measurements [Citation36,Citation38].
3. Discussion
While a great deal of progress has been made in simulations of electrochemical reactions in recent years, it is clear that additional methodology development is needed. One problem with the atomic scale double layer model illustrated in Figure (a) is that a configuration is set up and then the corresponding potential is evaluated. There is only limited sampling of atomic configurations consistent with the potential of interest. It would be better to define the applied potential first and then sample atomic configurations that are consistent with the specified conditions described by experimentally controlled parameters. Also, the electical potential changes due to finite size effects as a the electrochemical reaction takes place and the number of solvated ions in the system changes. It would be better to fix the chemical potential of the electrons in the electrode and have it remain constant during the reaction. The chemical potential in the dielectric would need to be fixed as well.
A recent development that paves the way for an advance in this direction is the development of a Green function approach for simulating a semi-infinite solid where the electrons have a fixed chemical potential [Citation60]. This is accomplished by first calculating the electronic structure of an infinite solid and constructing from that a Green function. A calculation is then carried out for a slab, but instead of having a vacuum interface on each side, one side is matched with the solid. It has been found that calculations of work function and band structure at the surface converges both faster and smoother in this way with the number of layers included in the slab [Citation60]. Other approaches for constant chemical potential simulations have also been proposed, see e.g. [Citation61].
The generation of atomic configurations for the dielectric, for example the water layer, is particularly important for studying electrochemistry at irregular surfaces such as stepped surfaces. Here, a combination of a DFT calculation and a computationally less demanding empirical or semi-empirical description of the dielectric, a so-called QM/MM approach, would be valuable. It is important that the electrical potential in and coming from the MM region is consistent with the description of the QM region. Recently, a single center multipole expansion approach to modeling of water [Citation62] has been presented and is now being implemented in the GPAW software [Citation63] for QM/MM simulations. Since sampling of water configurations can be difficult because of the relatively strong hydrogen bonds, long-timescale simulation approaches, for example, the adaptive kinetic Monte Carlo approach, which has been used in studies of i.e. surfaces [Citation64–Citation66] and diffusion in complex systems [Citation67], could prove useful in electrochemical simulations. Another approach is to develop a functional that implicitly includes configurational averaging [Citation68].
Figure 7. An illustration of an improved simulation approach. The density functional theory calculation is carried out for a slab including a few layers representing electrode surface and a thin region of electrolyte (QM slab).
Finally, while Kohn–Sham DFT has been spectacularly successful and is being used widely in condensed matter simulations, there are systematic problems with practical implementations of this approach due to the self-interaction error that arises when the Coulomb interaction is estimated from the total electron density. One of the manifestations of this is an overemphasis on delocalized electronic states. This has been found to lead to problems in describing solvated ions and localized defect states. A simple example of this is the location of a positive charge in a diamine cation, where all generalized gradient as well as commonly used hybrid energy functionals fail to describe the state with positive charge localized on one of the N-atoms [Citation69]. Similar charge localization problems in DFT calculations have also been documented for defects in oxides [Citation70]. In both cases, the application of an explicit self-iteraction correction [Citation71] implemented in a variational and self-consistent way with complex orbitals [Citation72] resolves the problem and gives calculated results in close agreement with experiments. This procedure will likely turn out to be important in future simulations of some electrochemical processes.
Figure summarizes the considerations described above and shows schematically a possible improved approach to electrochemical half cell simulations.
Acknowledgements
We would like to thank our numerous collaborators, in particular Jens K. Nørskov, Jan Rossmeisl, Vladimir Tripković and Maarten E. Björketun, as well as Andrew Peterson and our Ph.D. students at the University of Iceland who carried out some of the calculations reviewed here, Sigrídur Gudmundsdóttir and Javed Hussain.
Additional information
Funding
Notes
No potential conflict of interest was reported by the authors.
References
- K. Honkala, A. Hellman, I.N. Remediakis, A. Logadóttir, A. Carlsson, S. Dahl, C.H. Christensen and J.K. Nørskov, Science 307 (2005) p.555.
- J.K. Nørskov, F. Abild-Pedersen, F. Studt and T. Bligaard, Proc. Natl. Acad. Sci. USA 108 (2011) p.937.
- J.K. Nørskov, T. Bligaard, J. Rossmeisl and C.H. Christensen, Nat. Chem. 1 (2009) p.37.
- J. Rossmeisl, J. Greeley and G.S. Karlberg, Electrocatalysis and catalyst screening from density functional theory calculations, in Fuel Cell Catalysis: A Surface Science Approach, M.T.M. Koper, ed., Wiley, Hoboken, NJ, 2009. p.55. doi:10.1002/9780470463772.ch3
- A. Gross and S. Schnur, Computational chemistry applied to reactions in electrocatalysis, In Catalysis in Electrochemistry: From Fundamentals to Strategies for Fuel Cell Development, E. Santos and W. Schmicklereds. Wiley, Hoboken, NJ, 2011. (chapter 5)
- J.E. Mueller, D. Fantauzzi and T. Jacob, Multiscale modeling of electrochemical systems, In Electrocatalysis, R.C. Alkire, D.M. Kolb, L.A. Kibler and J. Lipkowski, eds., Vol. 4, Wiley-VCH Verlag GmbH & Co. KGaA, Weinheim, 2013. doi:10.1002/9783527680436.ch1
- Y. Zheng, Y. Jiao, M. Jaroniec and S.Z. Qiao, Angew. Chem. Int. Ed. 54 (2015) p.52.
- M. Nielsen, M.E. Björketun, M.H. Hansen and J. Rossmeisl, Surf. Sci. 631 (2015) p.2.
- E. Skúlason, Procedia Comp. Sci. 51 (2015) p.1887.
- D.C. Grahame, Chem. Rev. 41 (1947) p.441.
- J.O.M. Bockris, M.A.V. Devanthan and K. Muller, Proc. Roy. Soc, Ser. A. 274 (1963), p.55.
- S. Trasatti, Electrochim. Acta 36 (1991) p.1659.
- C.D. Taylor, S.A. Wasileski, J.S. Filhol and M. Neurock, Phys. Rev. B 73 (2006) p.165402.
- E. Skúlason, G.S. Karlberg, J. Rossmeisl, T. Bligaard, J. Greeley, H. Jónsson and J.K. Nørskov, Phys. Chem. Chem. Phys. 9 (2007) p.3241.
- V. Tripković, M. Björketun, E. Skúlason, J.K. Nørskov and J. Rossmeisl, Phys. Rev. B 84 (2011) p.115452.
- T. Matsui, Y. Kitagawa, M. Okumura, Y. Shigeta and S. Sakaki, J. Comput. Chem. 5 (2013) p.21.
- S. Gudmundsdóttir, W. Tang, G. Henkelman, H. Jónsson and E. Skúlason, J. Chem. Phys. 137 (2012) p.164705.
- J. Rossmeisl, J.K. Nørskov, C. Taylor, M. Janik and M. Neurock, J. Phys. Chem. B 110 (2006) p.21833.
- I. Hamada and Y. Morikawa, J. Phys. Chem. C 112 (2008) p.10889.
- E. Skúlason, V. Tripković, M.E. Björketun, S. Gudmundsdóttir, G. Karlberg, J. Rossmeisl, T. Bligaard, H. Jónsson and J.K. Nørskov, J. Phys. Chem. C 114 (2010) p.18182.
- S. Gudmundsdóttir, E. Skúlason and H. Jónsson, Phys. Rev. Lett. 108 (2012) p.156101.
- S. Gudmundsdóttir, E. Skúlason, K.-J. Weststrate, L. Juurlink and H. Jónsson, Phys. Chem. Chem. Phys. 15 (2013) p.6323.
- P. Vassilev, R.A. van Santen and M.T.M. Koper, J. Chem. Phys. 122 (2005) p.054701.
- A. Roudgar and A. Gross, Chem. Phys. Lett. 409 (2005) p.157.
- M. Otani, I. Hamada, O. Sugino, Y. Morikawa, Y. Okamoto and T. Ikeshoji, Phys. Chem. Chem. Phys. 10 (2008) p.3609.
- J.K. Nørskov, J. Rossmeisl, A. Logadóttir, L. Lindqvist, J.R. Kitchin, T. Bligaard and H. Jónsson, J. Phys. Chem. B 108 (2004) p.17886.
- A.U. Nilekar and M. Mavrikakis, Surf. Sci. 602 (2008) p.L89.
- V. Tripković, E. Skúlason, S. Siahrostami, J.K. Nørskov and J. Rossmeisl, Electrochimica Acta 55 (2010) p.7975.
- E. Skúlason, T. Bligaard, S. Gudmundsdóttir, F. Studt J. Rossmeisl, F. Abild-Pedersen, T. Vegge, H. J\’{o}nsson and J.K. N{\o}rskov, Phys. Chem. Chem. Phys. 14 (2012) p.1235.
- J. Hussain, E. Skúlason and H. Jónsson, Procedia Comp. Sci. 51 (2015) p.1865.
- Y. Abghoui, A.L. Garden, V.F. Hlynsson, S. Bjorgvinsdóttir, H. Ólafsdóttir and E. Skúlason, Phys. Chem. Chem. Phys. 17 (2015) p.4909.
- Y. Abghoui, A.L. Garden, J.G. Howalt, T. Vegge and E. Skúlason, ACS Catal. 6 (2016) p.635.
- J. Hussain, H. Jónsson and E. Skúlason, Faraday Discuss. R. Soc. 195 (2016) p.619.
- J. Hussain, H. Jónsson and E. Skúlason, Calculations of the rate of Hydrocarbon and Alcohol formation in CO2 Electroreduction, (Submitted for Publication).
- Y. Hori, Modern Aspects of Electrochemistry, Vol. 42, C.G. Vayenas, R.E. White and M.E. Gamboa-Aldeco, eds., Springer, New York, NY, 2008, p.89.
- K.P. Kuhl, T. Hatsukade, E.R. Cave, D.N. Abram, J. Kibsgaard and T.F. Jaramillo, J. Am. Chem. Soc. 136 (2014) p.14107.
- K.J.P. Schouten, Y. Kwon, C.J.M. van der Ham, Z. Qin and M.T.M. Koper, Chem. Sci. 2 (2011) p.1902.
- K.P. Kuhl, E.R. Cave, D.N. Abram and T.F. Jaramillo, Energy Environ. Sci. 5 (2012) p.7050.
- A.A. Peterson, F. Abild-Pedersen, F. Studt, J. Rossmeisl and J.K. Nørskov, Energy Environ. Sci. 3 (2010) p.1311.
- W.J. Durand, A.A. Peterson, F. Studt, F. Abild-Pedersen and J.K. Nørskov, Surf. Sci. 605 (2011) p.1354.
- A.A. Peterson and J.K. Nørskov, J. Phys. Chem. Lett. 3 (2012) p.251.
- J.S. Filhol and M. Neurock, Angew. Chem. Int. Ed. 45 (2006) p.402.
- D. Cao, G.-Q. Lu, A. Wieckowski, S.A. Wasileski and M. Neurock, J. Phys. Chem. B 109 (2005) p.11622.
- M. Otani and O. Sugino, Phys. Rev. B 73 (2006) p.115407.
- O. Sugino, I. Hamada, M. Otani, Y. Morikawa, T. Ikeshoji and Y. Okamoto, Surf. Sci. 601 (2007) p.5237.
- M. Otani, I. Hamada, O. Sugino, Y. Morikawa, Y. Okamoto and T. Ikeshoji, J. Phys. Soc Jpn. 77 (2008) p.024802.
- R. Jinnouchi and A.B. Anderson, J. Phys. Chem. C 112 (2008) p.8747.
- R. Jinnouchi and A.B. Anderson, Phys. Rev. B 77 (2008) p.245417.
- G. Fisicaro, L. Genovese, O. Andreussi, N. Marzari and S. Goedecker, J. Chem. Phys. 144 (2016) p.014103.
- C. Shi, C.P. O’Grady, A.A. Peterson, H.A. Hansen and J.K. Nørskov, Phys. Chem. Chem. Phys. 15 (2013) p.7114.
- X. Nie, M.R. Esopi, M.J. Janik and A. Asthagiri, Angew. Chem. Int. Ed. 52 (2013) p.2459.
- T. Cheng, H. Xiao and W.A. Goddard III, J. Phys. Chem. Lett. 6 (2015) p.4767.
- H. Xiao, T. Cheng, W.A. Goddard III and R. Sundararaman, J. Am. Chem. Soc. 138 (2016) p.483.
- H. Jónsson, G. Mills and K.W. Jacobsen, Nudged elastic band method for finding minimum energy paths of transitions, in Classical and Quantum Dynamics in Condensed Phase Simulations, B.J. Berne, G. Ciccotti and D.F. Coker, eds., World Scientific, Singapore, 1998, p.385.
- G. Henkelman, B.P. Uberuaga and H. Jónsson, J. Chem. Phys. 113 (2000) p.9901.
- G. Henkelman and H. Jónsson, J. Chem. Phys. 113 (2000) p.9978.
- S. Smidstrup, A. Pedersen, K. Stokbro and H. Jónsson, J. Chem. Phys. 140 (2014) p.214106.
- A.A. Peterson, J. Chem. Phys. 145 (2016) p.074106.
- O.-P. Koistinen, E. Maras, A. Vehtari and H. Jónsson, Nanosyst. Phys. Chem. Math. 7 (2016) p.925.
- S. Smidstrup, T. Ghosh, E.\"{O}. Jónsson, K. Stokbro and H. Jónsson, Simulation of a Semi-infinite Solid Using a Green Function Method, (in Peparation).
- W.B. Schneider and A.A. Auer, Beilstein J. Nanotechnol. 5 (2014) p.668.
- K.T. Wikfeldt, E.R. Batista, F.D. Vila and H. Jónsson, Phys. Chem. Chem. Phys. 15 (2013) p.16542.
- J. Enkovaara, C. Rostgaard, J.J. Mortensen, et al., J. Phys.: Condens. Matt. 22 (2010), p.253202.
- H. Jónsson, Proc. Natl. Acad. Sci. 108 (2011) p.944.
- A. Pedersen, L.J. Karssemeijer, H.M. Cuppen and H. Jónsson, J. Phys. Chem. C 119 (2015) p.16528.
- E.R. Batista and H. Jónsson, Comput. Mater. Sci. 20 (2001) p.325.
- A. Pedersen and H. Jónsson, Acta Mater. 57 (2009) p.4036.
- K. Letchworth-Weaver and T.A. Arias, Phys. Rev. B 86 (2012) p.075140.
- X. Cheng, Y. Zhang, E.Ö. Jónsson, H. Jónsson and P.M. Weber, Nat. Comm. 7 (2016) p.11013.
- H. Gudmundsdóttir, E.Ö. Jónsson and H. Jónsson, New J. Phys. 17 (2015) p.083006.
- J.P. Perdew and A. Zunger, Phys. Rev. B 23 (1981) p.5048.
- S. Lehtola and H. Jónsson, J. Chem. Theory Comp. 10 (2014), p.5324; 11 839 (2015); 11 5052 (2015).