
Abstract
Inelastic electron tunneling spectroscopy (IETS) based on scanning tunneling microscopy (STM) opens a new avenue for vibrational spectroscopy at single bond level. Since its birth, STM-IETS has been widely used for chemical identification and investigating the intra- and inter-molecular interactions as well as chemical reactions. In this review, we mainly focus on the new development and application of STM-IETS in the past decade. After introducing the basic theoretical background of IETS, we will discuss the recent advances of STM-IETS as vibrational spectroscopy and microspectroscopy, with emphasis on the ability of probing weak intermolecular interactions. The coupling of inelastic tunneling electrons to other elementary excitations, such as rotation, phonon, spin, plasmon, photon, etc., will be also briefly reviewed. In the end, we present a perspective for the future directions and challenges of STM-IETS. The goal of this review is to demonstrate the versatility of STM-IETS and inspire new applications in interdisciplinary fields.
1. Introduction of IETS and STM-IETS
Vibrational spectroscopy has for long served as a fingerprint technique for chemical identification. Laser-based methods, like infrared and Raman spectroscopy, provide enormous bond information of different chemical or biological systems [Citation1,2]. But at single molecule level, their ability to characterize molecular vibrations is severely limited by the small scattering cross section. This limitation can be overcome by surface or tip-enhanced Raman and infrared spectroscopy [Citation3–10], where the interaction between photons and single molecules is greatly enhanced through strongly localized electromagnetic field.
On the other hand, electronic spectroscopy can deliver information about molecular vibrations as well. Inelastic electron tunneling process between two electrodes transfers energy to molecular vibrations through electron–vibration (e–vib) interaction. This process takes place at a threshold bias voltage corresponding to the vibrational energy, leading to the opening of a new conductance channel. Such an effect is manifested as a slight kink in I–V curve (Figure (a)), and a small step in dI/dV spectrum accordingly (Figure (b)). The vibrational fingerprint is most prominent in the second derivative of the current to the voltage (d2I/dV2) (Figure (c)), i.e. inelastic electron tunneling spectroscopy (IETS). IETS was first demonstrated in a metal–insulator–metal tunneling junction by Jaklevic and Lambe in 1966 [Citation11]. However, the signals came from ~109 molecules buried at the metal–insulator interface. In 1998, Stipe et al. reported the first single-molecule IETS of acetylene on Cu (100) surface using scanning tunneling microscopy (STM-IETS), which pushed the vibrational spectroscopy down to the single bond limit [Citation12]. The spatial distribution of the inelastic tunneling is well localized to the chemical bond being probed [Citation13], allowing the creation of atomic-scale spatial images of each vibrational mode.
Figure 1. (a–c) Schematic spectra of I–V, dI/dV, and d2I/dV2, respectively, showing the inelastic electron tunneling features at the threshold bias voltage ħω/e. ω is angular frequency of the vibration. (d–f) Schematic diagram of the inelastic electron tunneling process. (d) The single level model and model parameters. ε0 represents the nearest molecular level participating the transport. L and
R characterize the coupling of the molecular level with the left and right electrodes, respectively. (e) For
, electrons do not have enough energy to emit a phonon. The inelastic process is blocked. (f) For
, the inelastic process is allowed.
With the development of molecular electronics, IETS has also been employed as a spectroscopic tool to confirm the presence of single molecule and measure the electric transport properties in different experimental setups, e.g. mechanical controllable break junction [Citation27, 28], electromigration junction [Citation29], STM break junction [Citation30] and so on. At the same time, STM-IETS has been extensively used in the fields of surface science to study the chemical reactions on surfaces [Citation14–17], molecular identifications [Citation18,19], electron–phonon coupling [Citation20–22], intra- and inter-molecular interaction [Citation23–26]. In addition to molecular vibration, inelastic tunneling electrons can couple to other elementary excitations, such as rotation, phonon, spin, plasmon, photon, etc., which greatly expand the scope of the IETS-related techniques.
The theme of the current review is IETS measurements using STM setup, and IETS refers to STM-IETS if not explicitly specified in the following. In this review, we will mainly focus on the new development and application of STM-IETS in the past decade, in particular the ability of probing weak intermolecular interactions. Earlier IETS work could be found in some excellent review articles [Citation18, 19, 31]. Starting with the basic theoretical background of IETS, we discuss in Section 2 the physical process behind IETS and its theoretical modeling. In Section 3, we will discuss recent advances and new capabilities of IETS, by taking various vibrational spectroscopies as prototypes. The application of IETS in other inelastic processes will be also briefly described. In Section 4, we present a perspective for the future directions and challenges of IETS. To conclude this review, a summary is given in Section 5.
2. Theoretical background
When electrons traverse the molecular junction, there is a certain possibility that they interact with molecular vibrations. Without e–vib interaction, the electrons tunnel elastically through the junction. In the presence of it, the electrons may be scattered by molecular vibrations and transfer one or more quanta of the vibrational energy to them. If the e–vib interaction is weak, the lowest order process is dominant. Due to the fermionic statistics, in order for the scattering to happen, the initial state has to be occupied, and the final state has to be empty. At zero temperature, this requirement introduces a threshold bias below which the inelastic scattering process cannot happen due to Pauli blocking. The threshold bias is determined by the vibrational frequency, i.e. . Here,
is angular frequency of the vibration, ℏ is the reduced Planck constant, e is the unit charge. These vibrationally assisted scattering processes modify the junction conductance at the threshold bias
(Figure (a)–(c)). Their signature is prominent in the second-order differential conductance as peaks, dips or asymmetric line shapes depending on the junction parameters.
A single level Newns–Anderson model is often used to describe the ballistic transport process in a molecular junction, as shown in Figure (d)–(f). The single electronic state at energy ɛ0 represents the nearest predominant molecular level participating the transport. We have set the electrode Fermi level (EF) to zero. Depending on the molecular electronic structure, it could be the lowest unoccupied molecular orbital (LUMO) or the highest occupied molecular orbital (HOMO). The single level couples to the left and right electrodes, characterized by the broadening parameter with
. The Hamiltonian of system can be written as:
(1)
where , with
the creation (annihilation) operator of the molecular state,
is the hopping matrix element between the electrode
and the center molecular level,
is the creation (annihilation) operator of the electrons with wavevector k and energy
in electrode
. The level broadening parameter is expressed as
(2)
Ballistic electronic transport through the Newns–Anderson model can be described within the Landauer–Büttiker approach. Wherein, the transport process is viewed as electron scattering by the center molecule, and the key parameter is the energy-dependent transmission coefficient. This model has been widely used to analyze the experimental results of single molecular junction.
To study the effect of e–vib interaction, we need to consider the vibrational degree of freedom and its interaction with electrons. An onsite Holstein type coupling can be introduced to the model, i.e. the energy level depends on the mass-normalized displacement u of the vibrational mode. With this, the Hamiltonian of the molecule is modified to:(3)
Here, m is the e–vib coupling parameter, is the angular frequency of the vibrational mode.
There are several energy/time scales in this Newns–Anderson–Holstein model. The broadening parameter characterizes the hybridization of the molecular level with the electrode
. The energy level
defines the energy barrier that electrons or holes tunnel through during transport, the vibrational energy
gives the vibrational energy scale. Finally, the e–vib interaction parameter m together with
gives the strength of e–vib interaction
(4)
There is one time scale corresponding to each energy scale. One important time scale is the lifetime of electrons on the molecular level, normally expressed as(5)
The strength of e–vib interaction is determined by the relative magnitude of and g. In the limit of
, the e–vib interaction is weak, a perturbative treatment of e–vib interaction works well. But if
, perturbative treatment fails. Another time scale is the electron dephasing time τd, whose relation with the above energy scales is not at all obvious. If τd ≫ τt, the electrons keep their phase information during the tunneling. The electronic transport is in the coherent regime. Otherwise, electrons lose their phase information, and classical incoherent transport becomes dominant.
In most molecular junctions, the molecular level is relatively far away from the chemical potential of metal electrodes, i.e. is on the order of eV. Electronic transport is in the coherent tunneling regime, and e–vib interaction is weak. This makes the perturbative treatment feasible. The downside is that the correction to the electrical conductance, thus the IETS signal, is very small, rendering the experimental detection rather challenging.
We note that there is only one vibrational mode in this model. In real molecules, there are more. Although vibrational coupling, either directly or mediated by electrons, may introduce interesting physics, so far, one normally ignores these coupling and considers each mode separately in theoretical modeling of IETS.
2.1. Basic theory of IETS
To understand the IETS signal theoretically, one needs to study the electronic transport problem taking into account electron’s interaction with molecular vibrations. Thus, the standard Landauer–Büttiker approach is not applicable anymore. Most of the experiments fall into the weak interaction regime. Different forms of perturbative approaches, including scattering theory [Citation32–36] and nonequilibrium Green’s function (NEGF) method [Citation31, 37–46], have been used to describe the inelastic transport process. The scattering theory has the advantage of better physical transparency, and has been employed in the early works modeling both the metal–insulator–metal and single molecular junction [Citation32–35]. But its account of fermionic statistics is somewhat ad hoc. More systematic NEGF method is used to overcome this problem. Moreover, the NEGF method combined with Density Functional Theory (DFT)-based electronic structure calculation has further advantage in the simulation of IETS signal of realistic molecular junctions. We will focus on the NEGF method in this review.
In the NEGF method, the molecular junction is divided into three regions: the left, right electrode, and the central molecule. The electrical current is expressed using the central Green’s functions and self-energies. The effect of e–vib interaction is taken into account through the interaction self-energy. Assuming weak e–vib interaction, the expression for the electrical current is expanded up to the second order in the e–vib interaction matrix. Details of the theory can be found in previous publications [Citation47, 48]. Here, we quote the result directly. The correction to the second-order differential conductance due to e–vib interaction can be expressed as [Citation47, 48](6)
To arrive at this compact expression, we mainly focus on bias range near the vibrational threshold, and have ignored the background signal which does not have vibrational feature.
Here, Isym and are two universal functions describing the symmetric and asymmetric part of the signal
(7)
(8)
And, is the quantum of conductance,
is the Heaviside step function. The two functions and their contribution to the IETS signal are plotted in Figure .
Figure 2. Symmetric and asymmetric part of the vibration-induced correction to the tunneling current (a–b) and its second derivative with respect to eV (c–d). Figure reproduced from Ref. [Citation26].
![Figure 2. Symmetric and asymmetric part of the vibration-induced correction to the tunneling current (a–b) and its second derivative with respect to eV (c–d). Figure reproduced from Ref. [Citation26].](/cms/asset/0523383c-666f-4057-8142-0b56ce9f6d23/tapx_a_1372215_f0002_oc.gif)
For the Newns–Anderson–Holstein model, assuming symmetric potential drop () and ɛ0 = 0, the expressions for the two coefficients are [Citation34, 49]
(9)
and(10)
Meanwhile, in STM-type experiment, the molecular level couples stronger to the substrate than to the tip. Assuming we have
, the expression then simplifies to
(11)
and(12)
This result was firstly obtained by Persson and Baratoff [Citation34]. It has been widely used to fit the experimental results.
2.2. Resonantly enhanced IETS
The magnitude of IETS signal can be drastically enhanced when the molecular level lies near the chemical potential of the electrodes [Citation34, 50]. In this case, the molecular level directly involves in the tunneling process. Both the tunneling density of states and the e–vib interaction increase, thus the IETS signals are greatly enhanced. In fact, this resonantly enhanced IETS was firstly proposed theoretically as a possible way to observe IETS in single molecular junction [Citation34], although its experimental realization was only made possible recently. In all these experiments, it seems that e–vib interaction is still relatively weak, e.g. no higher order scattering process involving multiple vibrations was detected in the IETS signal.
2.3. DFT-based transport theory
To model realistic molecular junctions, one can combine the NEGF transport theory with DFT-based electronic structure calculations (DFT–NEGF). The development of numerical tools along this line has been proven useful in explaining the experimentally observed, rather complicated IETS signals. This has led to fruitful interplay between experimental and theoretical groups.
In this type of calculations, the electronic structure, molecular vibrations and e–vib interaction matrix are all obtained from DFT-based calculations. These parameters are then fed into the NEGF transport theory. As mentioned above, normally one considers independent vibrational modes, so that contributions from each mode are simply summed over. Under the lowest order expansion of e–vib interaction matrix, the two coefficients in Eq. (Equation6(6) ) can be approximately expressed using the NEGF theory, which are calculated from DFT [Citation43, 47, 48].
2.4. IETS simulation: intensity and line shape
Detailed analysis of transport processes shows that the simple physical picture in Figure (a)–(c) is not complete. Actually, both inelastic and new high-order elastic channels open at the vibrational threshold contributing to the IETS signals (Figure (a)–(c)). The inelastic process contributes only to the , which is shown in Figure (c). The high-order elastic process, involving phonon emission and re-absorption, can be further divided into two different processes shown in Figure (a) and (b) (assuming
). These two elastic processes contribute both to
and
. In the simple picture of IETS shown in Figure , these high-order elastic processes are not considered.
Figure 3. Processes involved at the threshold bias and contributing to IETS. (a) One-electron elastic process: One electron makes an inelastic transition downward from the left to the right electrode, emitting a vibration; the same electron re-absorbs this vibration and makes an inelastic transition upward at the right electrode. (b) Two-electron elastic process: One electron makes an inelastic transition downward from the left to the right electrode, emitting a vibration; a second electron makes an inelastic transition upward at the left electrode, re-absorbing the emitted vibration. (c) One-electron inelastic transition from the left to the right electrode. If the resonant level couples stronger to the left electrode, the transition upward in (b) is enhanced. Figure reproduced from Ref. [Citation26].
![Figure 3. Processes involved at the threshold bias and contributing to IETS. (a) One-electron elastic process: One electron makes an inelastic transition downward from the left to the right electrode, emitting a vibration; the same electron re-absorbs this vibration and makes an inelastic transition upward at the right electrode. (b) Two-electron elastic process: One electron makes an inelastic transition downward from the left to the right electrode, emitting a vibration; a second electron makes an inelastic transition upward at the left electrode, re-absorbing the emitted vibration. (c) One-electron inelastic transition from the left to the right electrode. If the resonant level couples stronger to the left electrode, the transition upward in (b) is enhanced. Figure reproduced from Ref. [Citation26].](/cms/asset/bd5a4e7e-4d89-4198-ad96-89794abecbdb/tapx_a_1372215_f0003_b.gif)
The line shape of IETS signal depends on the competition of the three processes (a)–(c). All of them contribute to the coefficient of symmetric IETS signal γ (Equation Equation6(6) ). The inelastic process (c) opens an additional transport channel, and contributes to a peak in the d2I/dV2 signal for positive bias. In contrast, the two high-order elastic processes (a) and (b) may contribute to a dip due to the interference effect. The final line shape depends on their relative magnitude. On the other hand, the processes (a) and (b) also contribute to the asymmetric coefficient λ. But their contributions are opposite to each other due to the Fermionic statistics. This results in a very small λ compared to γ. There are certain cases where they become important: (a) the molecule couples to the left and right electrode asymmetrically, and (b) there is some resonant state near the bias window. Both of them may selectively enhance one of the high-order elastic processes and generate an asymmetric IETS line shape.
Recently, the asymmetric IETS line shape has been observed in several STM experiments [Citation26, 51, 52]. Through tuning the position of a chlorine (Cl) -terminated STM tip, Guo et al. managed to selectively gate the HOMO level of water molecule and enhanced the tip–molecule coupling at the same time [Citation26]. This greatly enhances the contribution of the quasi-elastic process to the asymmetric line shape. Xu et al. studied the effect of asymmetric coupling to the electrodes on the IETS line shape [Citation52]. Meierott et al. observed bias-polarity-dependent line shapes due to the resonant LUMO orbital of C60 molecule on Pb(1 1 1) surface [Citation51].
2.5. Strong coupling limit
So far, we have considered only the case of weak e–vib interaction. In the limit of strong e–vib interaction , the perturbative way of treating e–vib interaction fails. In this case, the electronic coupling between the molecular levels with the electrodes is small and can be treated perturbatively. For the Newns–Anderson–Holstein model, one normally employs the Lang–Firsov [Citation53] transformation to work in the polaron basis, and treat the molecule–electrode coupling perturbatively or in a mean-field type approximation [Citation50]. Frank–Condon blockade and other interesting physics have been explored [Citation54]. So far, this method has only been used to the Newns–Anderson–Holstein model, its extension to realistic systems is not straightforward. Another complication in the regime is that, other type of interactions, e.g. electron Coulomb interaction, become equally important and a standard DFT description of the electronic structure becomes invalid.
3. Recent advances and applications
3.1. Tip-enhanced IETS
As we have shown in Section 2, the sensitivity and lineshape of IETS is significantly influenced by the energy position of the molecular level (ε0) with respective to EF of the electrode. In the off-resonance case where the relative energy difference is on the order of eV, inelastic process can be considered as a small perturbation to the elastic scattering, leading to very weak IETS signals with the relative conductance change being around several percentages or smaller [Citation36, 55]. When the energy difference between the molecular orbitals and EF is comparable to the vibrational energy, the molecular orbital may participate in the inelastic transitions directly and strongly couple with the molecular vibration, resulting in resonant enhancement of the cross section for vibrational excitation [Citation34, 37, 50].
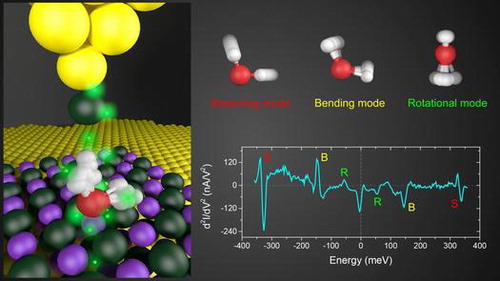
Experimentally, near-resonance or on-resonance IETS has been observed in many systems such as benzene on Ag(1 1 0) surface [Citation56, 57], O2 on Pt(1 1 1) and Ag(1 1 0) surface [Citation58–61], (CH3S)2 and CH3S on Cu(1 1 1) [Citation62], cis-2-butene on Pd(1 1 0) [Citation63], and H2 on BN/Rh(1 1 1) [Citation64]. However, controlling the role of molecular resonance in IETS has been proven difficult. Recently, it has been possible to tune the system from far-off-resonance to near-resonance by orbital gating through a back gate in a single-molecule device, leading to resonantly enhanced IETS [Citation65]. Inspired by this idea, Guo et al. developed a tip-enhanced IETS (TE-IETS) technique and acquired high-quality vibrational spectra (Figure (c)) of a single water molecule adsorbed on Au-supported NaCl(0 0 1) films (Figure (a)) [Citation26]. As a closed-shell molecule, the frontier orbitals of water are located about 2–3 eV away from the EF [Citation66, 67], corresponding to the far-off-resonance case. In TE-IETS, the role of STM tip is similar to a top gate, which broadens and shifts the frontier molecular orbitals of water toward EF via electronic coupling, to resonantly enhance the IET signals (Figure (b)).
Figure 4. (a) STM topography of a D2O monomer (V = 100 mV, I = 50pA). The inset shows the calculated isosurface of charge density of the HOMO. (b) Schematic of the tip-enhanced IET process. The tip–water coupling ‘gates’ HOMO to the proximity of EF, thus resonantly enhancing the cross section of the IET process. (c) dI/dV and d2I/dV2 spectra taken at different tip heights. Red (–1.2 Å) and blue (–0.4 Å) curves were taken on the D2O monomer. Gray curves (–1.2 Å) were acquired on the NaCl surface (denoted as ‘bkgd’). The vibrational IET features are denoted as ‘R’ (rotational), ‘B’ (bending), and ‘S’ (stretching). Dashed horizontal lines represent zero levels of the y axes for each curve. (d) Experimental d2I/dV2 spectra (normalized by dI/dV) of the bending mode of water monomer as a function of tip height. For clarity, each curve is scaled properly to ensure the same magnitude. All tip heights in the experiment are referenced to the gap set with V = 100 mV and I = 50pA. Figure reproduced from Ref. [Citation26].
![Figure 4. (a) STM topography of a D2O monomer (V = 100 mV, I = 50pA). The inset shows the calculated isosurface of charge density of the HOMO. (b) Schematic of the tip-enhanced IET process. The tip–water coupling ‘gates’ HOMO to the proximity of EF, thus resonantly enhancing the cross section of the IET process. (c) dI/dV and d2I/dV2 spectra taken at different tip heights. Red (–1.2 Å) and blue (–0.4 Å) curves were taken on the D2O monomer. Gray curves (–1.2 Å) were acquired on the NaCl surface (denoted as ‘bkgd’). The vibrational IET features are denoted as ‘R’ (rotational), ‘B’ (bending), and ‘S’ (stretching). Dashed horizontal lines represent zero levels of the y axes for each curve. (d) Experimental d2I/dV2 spectra (normalized by dI/dV) of the bending mode of water monomer as a function of tip height. For clarity, each curve is scaled properly to ensure the same magnitude. All tip heights in the experiment are referenced to the gap set with V = 100 mV and I = 50pA. Figure reproduced from Ref. [Citation26].](/cms/asset/c2b70402-310e-4bbe-b6fa-1d8f6a2da711/tapx_a_1372215_f0004_oc.gif)
The TE-IETS is very sensitive to the tip termination and tip–molecule coupling [Citation26, 68]. In contrast to the enhancement of both HOMO and LUMO around EF by the bare Au tip, the Cl-tip selectively gates the HOMO and greatly increases the molecular density of states (DOS) due to the effective coupling of pz orbital of Cl-tip with the HOMO of water. Therefore, different tip terminations may selectively gate different molecular orbitals (with different symmetries) to the EF. Only the vibrational modes whose symmetry matches that of the molecular orbitals around EF are detectable in the tip-enhanced IETS [Citation35]. The normalized IETS intensity increases by more than one order of magnitude upon increasing the tip–water coupling strength (decreasing the tip–water distance) (Figure (d)). Moreover, the line shape of IETS changes from a symmetric dip to an asymmetric Fano-shaped feature [Citation55], arising from the contribution of high-order elastic channels in addition to the inelastic channel as discussed in the previous section [Citation34, 69–71]. Interestingly, spatial position of the tip is crucial for the detection of the inelastic signal. The tip has to move slightly away from the center of water molecule, due to the opposite symmetry of the water HOMO and tip orbital.
The TE-IETS possesses a very high signal-to-noise ratio (up to 30% in relative conductance change), which offers an unprecedented opportunity to investigate the weak intermolecular interaction at single bond level. Based on this technique, the H-bonding strength at the water/salt interface can be determined with high accuracy by measuring the redshift of water stretching frequency as a function of the tip–water distance [Citation72]. By comparing the H-bonding energy of H and D in the same HOD molecule, the effect of quantum motion of H nuclei on H-bonding strength was quantitatively revealed. The TE-IETS technique defeats the longstanding deficiency of conventional IETS in the detection of weak intermolecular interaction, and opens up the possibility of studying the nuclear quantum effects of H-bonded materials at atomic scale [Citation73].
Moreover, the uniqueness of TE-IETS also lies in its ability of achieving high-quality IETS on metal-supported insulating films [Citation26, 64, 74]. So far, conventional IETS measurements were mostly done on metal surfaces. The coupling between the molecules and the metals can significantly shift and broaden the molecular resonance, thus increase the molecular DOS around EF in the far-off-resonance case. On metal-supported insulating films, the molecules are electronically decoupled from the metal substrates, leading to negligible molecular DOS around EF due to the reduced broadening. Therefore, the IETS signals should be extremely weak. In TE-IETS, this difficulty can be overcome through increasing the coupling between the tip and the molecules, which enables the IETS measurements even on thick insulating films. Previous work of IETS on insulating films might be relevant to the strong tip–molecule coupling [Citation26, 64]. For the next, it would be interesting to see whether the TE-IETS technique can be generalized to other molecules and different surfaces.
3.2. Inelastic tunneling probe
Conventional IETS measurement is performed on single molecules adsorbed on metal surfaces. However, the roles of tip and surface can be reversed when the molecule is picked up by the tip [Citation75–78]. For noncontact atomic force microscopy (NC-AFM) using molecule-functionalized tips, intermolecular force changes resonance frequency of the cantilever when the molecule on the tip is brought close to another molecule on surface [Citation78]. In IETS measurement, this intermolecular interaction changes the vibrational frequencies of the molecule on the tip as well. Inspired by this idea, Chiang et al. developed a so-called inelastic tunneling probe (itProbe) to image local potential energy landscape over an adsorbed molecule via probing the vibrational frequency shift of carbon monoxide (CO) molecule on the tip [Citation23].
The key of itProbe lies in the sensitivity of CO vibration to the intermolecular interaction. To get a relatively large response in vibrational energy, the ultra-soft mode, hindered translational mode (~2.8 meV) was chosen rather than the hindered rotational modes (~18.3 and 20.3 meV) [Citation77]. Since the vibrational frequency and its shift are both very small, low temperature (600 mK) and small bias modulation (<1 mV) are needed to reduce the thermal and instrumental broadening. The IETS taken on chosen positions (Figure (a)) over cobalt phthalocyanine (CoPc) shows clear but different CO vibrational energies at different sites. The largest energy shift in Figure (a) is ~2 meV, implying a high sensitivity of the hindered translational mode of CO. Mapping out the intensity of IETS signals in real space allows the direct imaging of vibrational frequency shift (Figure (b) and (c)), which corresponds to the potential energy distribution in the CoPc molecule. Such an IETS mapping can be easily correlated with the skeletal structure and chemical bonding of CoPc in Figure (d).
Figure 5. (a) Spatially resolved d2I/dV2 vibrational spectra taken at locations indicated in the schematic of the right side of CoPc. Spectra are vertically displaced for clarity of presentation; set point: V = 100 mV and I = 0.1 nA on Co atom and gap reduced by 1.7 Å after tuning off the feedback. Note the different multiplicative factors for the four spectra. Number on the right side of each spectrum denotes the peak position. The dot-dashed line is drawn at V = 1.7 mV to show the variations in intensity that give rise to the contrast in molecular structural imaging. (b) Constant-current image of CoPc(+) on Ag(1 1 0). (c) Constant-current imaging of CoPc(×)on Ag(1 1 0). The area is 128 × 128 pixels and 20.2 Å × 20.2 Å. (d) Schematic diagram of CoPc adsorption geometry showing the skeletal structure and the intramolecular hydrogen bonds. Figure reproduced from Ref. [Citation23].
![Figure 5. (a) Spatially resolved d2I/dV2 vibrational spectra taken at locations indicated in the schematic of the right side of CoPc. Spectra are vertically displaced for clarity of presentation; set point: V = 100 mV and I = 0.1 nA on Co atom and gap reduced by 1.7 Å after tuning off the feedback. Note the different multiplicative factors for the four spectra. Number on the right side of each spectrum denotes the peak position. The dot-dashed line is drawn at V = 1.7 mV to show the variations in intensity that give rise to the contrast in molecular structural imaging. (b) Constant-current image of CoPc(+) on Ag(1 1 0). (c) Constant-current imaging of CoPc(×)on Ag(1 1 0). The area is 128 × 128 pixels and 20.2 Å × 20.2 Å. (d) Schematic diagram of CoPc adsorption geometry showing the skeletal structure and the intramolecular hydrogen bonds. Figure reproduced from Ref. [Citation23].](/cms/asset/44b09743-4455-4202-834b-907b961aeaf8/tapx_a_1372215_f0005_oc.gif)
The itProbe can be considered as a novel type of NC-AFM, with the cantilever (CO molecule) working at the oscillation frequency within the THz range. This frequency range is several orders of magnitude larger than that of conventional NC-AFM (~kHz). Surprisingly, the results of the itProbe and NC-AFM are quite similar [Citation78]. It is worthy to mention that the flexibility of the CO molecule on the tip may cause significant distortion of the images or even misleading features. Just as mentioned in Ref. [Citation79], the intra- and inter-molecular contrast could stem from CO tilting over the ridges of the potential energy landscape rather than an actual bond. Although functionalizing the tip with a molecule is commonly used to increase the spatial resolution of STM [Citation80–82], itProbe obviously provides much more beyond that. It senses the local potential field through inelastic transport, and offers detailed structure or chemical information of the molecule. Therefore, itProbe has greatly advanced the IETS from a purely spectroscopic method to a powerful single-molecule imaging technique.
3.3. Rotational spectroscopy
The rotational motion of a molecule is usually hindered when it is adsorbed on surfaces. External energy has to be provided to the molecule in order for it to overcome a certain energetic barrier of the hindered rotation. If a molecule is weakly adsorbed on the surface, e.g. hexa-tert-butyl decacyclene on Cu(1 0 0) at room temperature [Citation59, 83], it could realize nearly free rotation. Hindered rotation has been reported for many adsorbed molecules, such as carbon monoxide [Citation77], acetylene [Citation13], and oxygen [Citation59]. Detailed process and mechanism related to hindered rotation was extensively studied via action spectroscopy, which will be discussed in the next part. Here, the rotational spectroscopy focuses on the free rotation, which contains manifold intra- and inter-molecular information missing in other vibrations.
Molecular hydrogen (H2) is weakly adsorbed on noble metal surfaces through van der Waals interaction [Citation84]. At low coverage, physisorbed H2 on hexagonal boron nitride (h-BN) is transparent to STM, allowing the imaging of the underlying honeycomb lattice of h-BN [Citation85]. With H2 in the tip–sample junction, rotational spectroscopy was measured for H2, D2, and HD, as shown in Figure (a) and (b). The excitation energies (43.75, 32.8, and 20.89 meV for H2, HD, and D2, respectively) are inversely proportional to their atomic mass. For a three-dimensional (3D) free rotor, the energy of a rotational quantum state is inversely proportional to its moment of inertia. Thus, the rotational spectroscopy demonstrates that the H2 molecule rotates freely as in gas phase [Citation86].
Figure 6. (a and b) IETS of H2, HD, and D2 on h-BN. (a) dI/dV of H2 (open circle), HD (upward triangle), and D2 (open square). The conductance steps at 43.7, 32.8, and 20.9 meV represent rotational J = 0 → 2 transitions. The values for H2 and D2 are characteristic for the para-H2 and ortho-D2 configuration, respectively. The low-energy steps close to the Fermi energy are attributed to phonon gaps of the commensurate molecular layer. The spectra were vertically offset by 0.5 nA/V for clarity. (b) Numerical derivative of (a), d2I/dV2. The black full lines show fits with a multi-peak Lorentzian function. The shoulder at around 13 meV (arrows) for HD is attributed to a J = 0 → 1 transition. (c and d) d2I/dV2 spectra of H2 and HD on Au(1 1 0) taken at different tip–substrate separation, respectively. The sample bias VB is changed from 5 (bottom) to 120 mV (top) in (c) and from 5 (bottom) to 70 mV in (d). IT is kept at 2 nA for all these spectra. A z–V curve is measured to convert the change in VB to the corresponding change in the tip–substrate separation (z). The tunneling gap distance at VB = 5 mV and IT = 2 nA is used as the reference point (z = 0). The uncertainty in z is around 9.5 pm. The shiftings of the rotational and vibrational excitation energies are indicated by the dashed lines. The magnified line shapes of the rotational excitation are also presented. (e) The J = 0 → 2 rotational excitation energy of hydrogen increases from 41 to 43 mV as z increases by 0.1 nm. The horizontal dashed line indicates for reference the excitation energy of a free molecule. (f) The v = 0 → 1 vibrational excitation energy decreases from 18 to 7.5 mV as z increases by 0.1 nm for H2, and from 15 to 8 mV as z increases by 0.08 nm for HD. Figure reproduced from Refs. [Citation85,87].
![Figure 6. (a and b) IETS of H2, HD, and D2 on h-BN. (a) dI/dV of H2 (open circle), HD (upward triangle), and D2 (open square). The conductance steps at 43.7, 32.8, and 20.9 meV represent rotational J = 0 → 2 transitions. The values for H2 and D2 are characteristic for the para-H2 and ortho-D2 configuration, respectively. The low-energy steps close to the Fermi energy are attributed to phonon gaps of the commensurate molecular layer. The spectra were vertically offset by 0.5 nA/V for clarity. (b) Numerical derivative of (a), d2I/dV2. The black full lines show fits with a multi-peak Lorentzian function. The shoulder at around 13 meV (arrows) for HD is attributed to a J = 0 → 1 transition. (c and d) d2I/dV2 spectra of H2 and HD on Au(1 1 0) taken at different tip–substrate separation, respectively. The sample bias VB is changed from 5 (bottom) to 120 mV (top) in (c) and from 5 (bottom) to 70 mV in (d). IT is kept at 2 nA for all these spectra. A z–V curve is measured to convert the change in VB to the corresponding change in the tip–substrate separation (z). The tunneling gap distance at VB = 5 mV and IT = 2 nA is used as the reference point (z = 0). The uncertainty in z is around 9.5 pm. The shiftings of the rotational and vibrational excitation energies are indicated by the dashed lines. The magnified line shapes of the rotational excitation are also presented. (e) The J = 0 → 2 rotational excitation energy of hydrogen increases from 41 to 43 mV as z increases by 0.1 nm. The horizontal dashed line indicates for reference the excitation energy of a free molecule. (f) The v = 0 → 1 vibrational excitation energy decreases from 18 to 7.5 mV as z increases by 0.1 nm for H2, and from 15 to 8 mV as z increases by 0.08 nm for HD. Figure reproduced from Refs. [Citation85,87].](/cms/asset/b64a0c22-6e25-47c6-93f4-72759b18333c/tapx_a_1372215_f0006_oc.gif)
The rotational spectroscopy can provide a precise measurement of bond length, which is included in the moment of inertia. In Figure (c)–(f), Li et al. detect the variation of rotational and vibrational energy of hydrogen molecule as changing the tip–sample distance [Citation87]. When tip approaches H2, the increase of vibrational energy and decrease of rotational energy imply the elongation of H–H bond, which was further confirmed by DFT calculations. Additionally, the rotational motion of H2 is keen to its chemical environment [Citation64]. The spatial variation of rotational intensity reflects orbital hybridization between H2 and magnesium porphyrin (MgP), which shed new insights into intermolecular interaction [Citation24, 88].
Notably, for homonuclear diatomics, the allowed rotational transitions depend on the nuclear spin state [Citation89]. The symmetry requirement of total molecular wave function leads to distinct nuclear spin states, and gets reflected in its rotational excitation energy. Detailed analysis of Figure (b) manifests that H2 is in its para- and D2 in its ortho-nuclear spin configuration, and both molecules show the rotational transition J = 0 → 2 [Citation85]. The unprecedented spatial resolution (~1.7 nm) of nuclear spin sensitivity was also demonstrated in this work.
Except that rotational spectroscopy reveals that H2 on surfaces moves almost freely with little influence from the potential generated by the underlying substrate [Citation87], the abnormally high mobility and flexibility of H2 on surfaces play an important role in the scanning tunneling hydrogen microscopy (STHM) [Citation90–92], which can resolve the molecular skeleton in topographic imaging by employing H2 as a signal transducer. The rotational spectroscopy of H2 provides rich information of chemical structure, molecular bond length, intermolecular coupling, and nuclear spin state, thus extending the well-established and widely used IETS methods.
3.4. Action spectroscopy
STM-IETS suffers from the instability of molecules induced by the IET excitation. From another perspective, vibrations of atoms or molecules may be a trigger for molecular motions or even chemical reaction on surfaces, which can be directly investigated in STM [Citation13, 58, 59]. Kawai et al. firstly coined the word ‘action spectroscopy (AS)’ in STM, to reveal the microscopic mechanisms of molecular dynamics and surface chemical reactions through electronic and vibrational excitation [Citation16, 93]. Single molecular rotation [Citation63, 94], hopping [Citation95], bond breaking [Citation62], and conformational change [Citation96] have been systematically studied using action spectroscopy.
A simple process involved in a chemical reaction includes three steps [Citation97, 98]. First, the tunneling electron puts the molecule into an ionic state and selectively excites the molecular vibration. Then, intramolecular vibrational energy relaxation leads to the energy transfer to reaction coordinate modes via anharmonic coupling. Once the energy is sufficient to overcome the barrier, the corresponding reaction occurs, resulting in visible changes in the current and topographic image. The reaction yield, which is the reaction rate divided by the current, exhibits a noticeable increase at the energy of vibrational or electronic states, which are responsible for the reaction [Citation99]. In general, STM-AS of molecular motion is relatively simple, such as single-mode [Citation17] or multiple-mode excitation spectra [Citation63, 100]. A little more complicated cases, like combination-mode excitation [Citation62] and single-overtone-mode excitation [Citation102], require more careful analyses to find the stimulated vibrational mode. These four modes are schematically shown in Figure (a)–(d). Recently, Oh et al. demonstrated that the hopping of CO on Ag(1 1 0) is related to a multiple-overtone-mode excitation (Figure (e)) [Citation101]. Detailed analysis shows that CO hopping could be induced by multiple overtone excitation of the mode, in absence of its fundamental vibrational modes. This calls for new insights into e–vib coupling and intramolecular energy transfer.
Figure 7. (a–d) Schematic illustrations of four previous types of action spectra: (a) single-mode excitation; (b) multiple-mode excitation; (c) combination-mode excitation; (d) single-overtone-mode excitation. (e) Action spectra for lateral hopping of a CO molecule as a function of sample bias voltage under constant tunneling currents of 1 (filled triangle) and 20 nA (filled circle). Solid lines indicate the spectral fitting results of the experimental data. The inset shows the hopping rate of a CO molecule as a function of tunneling current for sample bias voltages 90 (open triangle), 140 (open circle), 180 (filled triangle), and 280 mV (filled circle). The dashed lines in the inset represent least square fits to the data. Figure reproduced from Ref. [Citation101].
![Figure 7. (a–d) Schematic illustrations of four previous types of action spectra: (a) single-mode excitation; (b) multiple-mode excitation; (c) combination-mode excitation; (d) single-overtone-mode excitation. (e) Action spectra for lateral hopping of a CO molecule as a function of sample bias voltage under constant tunneling currents of 1 (filled triangle) and 20 nA (filled circle). Solid lines indicate the spectral fitting results of the experimental data. The inset shows the hopping rate of a CO molecule as a function of tunneling current for sample bias voltages 90 (open triangle), 140 (open circle), 180 (filled triangle), and 280 mV (filled circle). The dashed lines in the inset represent least square fits to the data. Figure reproduced from Ref. [Citation101].](/cms/asset/b8f56e44-285e-42b3-bf19-20fe96397b3d/tapx_a_1372215_f0007_oc.gif)
STM-AS holds complementary aspects when compared with STM-IETS. It is widely recognized that IETS is governed by the propensity rule [Citation45]. Only several selective vibrational modes predominantly contribute to the signals. Furthermore, competitions between elastic and inelastic channels in IETS signals complicated the line shape (Sec. 2.4). STM-AS, on the other hand, is directly related to the vibrational excitation. However, the reaction coordinate may be different from the excited vibrational mode because the anharmonic coupling leads to energy transfer between different modes. Therefore, the interpretation of AS usually needs careful theoretical fitting [Citation98]. Because of its statistical nature and the irreversibility of the chemical reactions, AS requires multiple measurements for a single action on different sites or even different molecules (for dissociation). Owing to the prolonged data-acquisition time, AS can provide deeper understanding of vibrationally mediated chemical reaction of single adsorbates, which is inaccessible from conventional IETS.
3.5. Phonon spectroscopy
Phonons are the collective atomic or molecular vibrations in crystals. Therefore, tunneling electrons can excite phonons in materials through inelastic processes as well. Different from the inelastic tunneling in single molecules where the momentum is not a well-defined quantity, the phonon-mediated inelastic tunneling process may involve momentum-conserving virtual transitions between electronic bands [Citation103]. Phonons in different conductors and semiconductors have been detected via phonon spectroscopy by STM. For metal, the spatial variation of surface phonon over Au(1 1 1) surface was investigated by Gawronski et al. (Figure (a)). The atomic resolution of phonon mapping arises from the site-specific probability of phonon excitation [Citation22]. After that, IETS was frequently used to understand the phonon excitation in the tip–sample junction [Citation104, 105], and the influence of point defects on surface phonon [Citation106]. Strikingly, the phonon spectroscopy was successfully used to study the role of lattice vibration modes in the high-temperature superconductivity of Bi2212 (Figure (b)), indicating a spatial anticorrelation between the vibrational energies and the superconducting pairing-gap energies [Citation21].
Figure 8. (a) IETS spectra taken on different sites of the reconstructed Au(1 1 1) surface. Different intensities are caused by different current offsets: 19 pA on the domains and 21 pA on the domain boundary. (b) IETS spectra taken in different regions of high-temperature superconductor Bi2212. Left, the peaks in d2I/dV2 occur at the points of maximum slope of dI/dV for E > Δ (where is the superconducting energy gap) as indicated by arrows; right, examples of the directly measured peaks in d2I/dV2 from the identical locations as the same-colored dI/dV spectra. (c) dI/dV spectrum of graphene at zero gate voltage. The gap width and the adjacent conductance minimum location (at VD) were not sensitive to STM tip height over an impedance range of 1–100 GΩ. Inset: A high-resolution dI/dV spectrum emphasizing the central gap-like feature. Figure reproduced from Refs. [Citation21, 22, 103].
![Figure 8. (a) IETS spectra taken on different sites of the reconstructed Au(1 1 1) surface. Different intensities are caused by different current offsets: 19 pA on the domains and 21 pA on the domain boundary. (b) IETS spectra taken in different regions of high-temperature superconductor Bi2212. Left, the peaks in d2I/dV2 occur at the points of maximum slope of dI/dV for E > Δ (where is the superconducting energy gap) as indicated by arrows; right, examples of the directly measured peaks in d2I/dV2 from the identical locations as the same-colored dI/dV spectra. (c) dI/dV spectrum of graphene at zero gate voltage. The gap width and the adjacent conductance minimum location (at VD) were not sensitive to STM tip height over an impedance range of 1–100 GΩ. Inset: A high-resolution dI/dV spectrum emphasizing the central gap-like feature. Figure reproduced from Refs. [Citation21, 22, 103].](/cms/asset/44dbbef5-32d8-411e-929c-09eb960283fc/tapx_a_1372215_f0008_oc.gif)
Graphite is a semimetal, and phonons in graphite were also detected [Citation107]. Graphene phonons were initially studied via traditional IETS (not STM-IETS) in distinct transistor device structure [Citation108, 109]. In 2008, Zhang et al. detected graphene phonons using STM for the first time, which show as a symmetric step-like feature in dI/dV spectra (Figure (c)) [Citation103]. The deduced phonon energy is 63 ± 2 meV, corresponding to out-of-plane acoustic graphene phonon modes located near the K/K’ point in reciprocal space. Modulating the interaction between graphene phonons and the metal substrate could alter its properties [Citation110, 111].To distinguish electron–phonon features from the electron–plasmon interaction in graphene, electron density dependent measurements were performed [Citation112]. The plasmon energy shifts with electron density, while the phonon energy does not. Phonons have important effect on many thermal and electrical transport properties, which can be now addressed by phonon spectroscopy at atomic scale [Citation113].
3.6. Spin excitation spectroscopy
Transitions between different spin states can be excited by exchanging spin with inelastic tunneling electrons. Contrary to molecular vibration, the cross section of spin exchanging scattering is quite large, resulting in an obvious conductance step in the first-order differential conductance, which is termed as spin excitation spectroscopy. Heinrich et al. reported the first spin excitation spectra of individual manganese atoms on alumina under external magnetic field [Citation114] (Figure (a) and (b)). Adsorption of one 3d transition metal atom on the surface lifts the degeneracy of the spin states due to influence of the atomic environment, spin–orbit interaction and the interaction with the substrate. Transitions between different spin states are thus excited by traversing electrons [Citation115–118]. Henceforth, various transition metal atoms, e.g. Fe, Mn, Co, on different surfaces were investigated, revealing the Landé g factor, magnetic anisotropy energy, and effective spin moment [Citation119, 120].
Figure 9. (a) IETS spectra at T = 0.6 K on the Mn atom on alumina (upper curves) measured at B = 7 T (black) and B = 0 T (red). The lower curves (shifted for clarity) were measured over the bare oxide surface. (b) Conductance spectra on a Mn atom on NiAl (upper curves) and on the bare NiAl surface (lower curves). All spectra in (a) and (b) were acquired with a nominal conductance of 10 nA/V (I = 50 pA at V = 5 mV) and normalized to unity for |V|>2 mV to emphasize differences in low-bias features. (c) IETS spectra taken on atom 1 of an N = 5 Co chain in transverse fields ranging from 0 T to 9 T, in increments of 200 mT. (d) Same as (c), but taken on atom 1 of an N = 6 chain. IETS curves were normalized to correct for tip height variations. Conductance values listed at the color bars are indicative only: owing to normalization, scaling between spectra may vary by ∼20%. Figure reproduced form Refs. [Citation114, 126].
![Figure 9. (a) IETS spectra at T = 0.6 K on the Mn atom on alumina (upper curves) measured at B = 7 T (black) and B = 0 T (red). The lower curves (shifted for clarity) were measured over the bare oxide surface. (b) Conductance spectra on a Mn atom on NiAl (upper curves) and on the bare NiAl surface (lower curves). All spectra in (a) and (b) were acquired with a nominal conductance of 10 nA/V (I = 50 pA at V = 5 mV) and normalized to unity for |V|>2 mV to emphasize differences in low-bias features. (c) IETS spectra taken on atom 1 of an N = 5 Co chain in transverse fields ranging from 0 T to 9 T, in increments of 200 mT. (d) Same as (c), but taken on atom 1 of an N = 6 chain. IETS curves were normalized to correct for tip height variations. Conductance values listed at the color bars are indicative only: owing to normalization, scaling between spectra may vary by ∼20%. Figure reproduced form Refs. [Citation114, 126].](/cms/asset/cb97a272-d970-47ff-8065-6a9081de7c68/tapx_a_1372215_f0009_oc.gif)
Using atomic manipulation by STM, dimers [Citation121, 122] and atomic chains [Citation123, 124] were artificially constructed on metal surfaces [Citation125]. A significant work on Co chains reveals a quantum phase transition in spin-1/2 XXZ Heisenberg chain [Citation126]. Site-resolved spin excitation spectroscopy as a function of magnetic field is shown in Figure (c) and (d). The sudden change of the spin excitation energy with magnetic field reveals a new domain wall formation in the antiferromagnetic chain before the transition to paramagnetic phase.
Besides individual magnetic atoms, the spin excitations in single molecule magnets [Citation127, 128], organic radicals [Citation129], metal–molecule complexes and their dimers [Citation130] were also reported. The molecular ligand offers extra flexibility to tune the local environment of the magnetic atom [Citation131, 132]. Chemical engineering of the molecular backbone also makes the self-assembly of ordered molecular networks possible, thus enabling the study of complex spin correlations through a bottom-up approach [Citation133–135].
In addition to the static properties, the spin relaxation time of individual magnetic atoms can be inferred from the line shape of the spin excitation spectra as well [Citation136, 137]. The magnetic field dependence of the spectra reveals the coupling of atomic spin with itinerant electrons of the metal substrate [Citation137]. As an internal degree of freedom of electrons and key component for superconductivity, spin has attracted a great deal of attention. Spin excitation spectroscopy serves as an indispensable method to excavate the interplay between the magnetism and superconductivity, new mechanisms of spintronics, and spin correlation, starting from atomic scale and scaling up gradually [Citation138, 139].
3.7. Light emission spectroscopy
Localized plasmon modes confined within the cavity between STM tip and metal substrate can be excited by inelastic electronic transitions. Radiative decay of these plasmon modes further excite propagating modes in free space or on the metal surfaces, which can be detected by different optical setups in far field. This tunneling electron-induced light emission was first reported in 1989 by Gimzewski et al. [Citation140]. Ever since, the dependence of light emission properties on different parameters have been explored, such as the cavity geometry, metal surfaces, and molecular adsorption, have been explored [Citation141–147]. Valuable information can be obtained from the analysis of the emission spectrum. Through atomic manipulation at the metal surface, the effect of local electronic density of states on the light emission efficiency was revealed [Citation148]. The emission efficiency follows closely to the predicted DOS from a simple particle-in-a-box calculation. These experimental results unambiguously demonstrate that the physical process responsible for the light emission is inelastic electronic transitions, which can be understood from Fermi’s golden rule [Citation148].
Most of the STM experiments were performed in the tunneling regime. Recently, the change of the optical yields during the transition from tunneling to contact regime was investigated. A close relationship between the optical yields and the high-frequency quantum shot noise of electrical current was demonstrated in both regimes [Citation149–151]. Further theoretical consideration shows that the high-frequency noise is actually closely related to the inelastic electronic transitions, thus unifying the two physical pictures [Citation152, 153]. Along this line, the effect of molecular frontier orbitals in a single molecular junction on the emission properties was investigated in the tunneling and contact regimes [Citation151, 154–156].
STM-induced light emission can be applied to study single molecular electroluminescence [Citation143, 146, 151, 157–160]. Complex emission spectrum shows up due to the quantum interference between plasmon excitation in the tip–sample cavity and electroluminescence of the molecular exciton [Citation160, 161]. From this, the interplay of optical mode polarization and the symmetry of molecular frontier orbital have been revealed [Citation162]. This effect can be used as a highly sensitive tool for single molecular detection.
Utilizing the atomic-scale localized excitation, energy transfer at single molecular level can also be investigated [Citation163, 164]. As presented in Figure (a) and (b), when two zinc-phthalocyanine (ZnPc) molecules were brought close to each other and formed a dimer, additional peaks appear in the luminescence spectroscopy and show distinct site dependence [Citation163]. Owing to the highly localized nature of tunneling electrons, only the ZnPc molecule within the tip–sample nanocavity was excited by the electrons. The intermolecular energy transfer is made possible through their dipolar coupling. For heterogeneous molecular dimers shown in Figure (c) and (d), the relative change of luminescence spectral intensity also implies the energy transfer between the two molecules [Citation164].
Figure 10. STM-induced luminescence (STML) of ZnPc dimers on NaCl(0 0 1)/Ag(0 0 1) (a and b) and H2Pc/MgPc dimers on NaCl(0 0 1)/Ag(1 1 1) (c and d). (a) STM images (left; −1.7 V, 2 pA) and STML spectra (right; −2.5 V, 200 pA, 60 s) acquired before and after manipulation. ZnPc molecules M1 and M2 were pushed together, with the direction of motion indicated by the white arrows; ZnPc molecule M3 was used as a reference. The STML spectra were acquired at the lobe positions marked with an ‘×’ in the STM images. (b) Site-dependent STML spectra (−2.5 V, 200 pA, 60 s) acquired at the positions marked with an ‘×’ in the inset STM images (4 nm × 3 nm; −1.7 V, 2 pA). All STML spectra are offset for clarity. The shaded bands labeled 1–5 indicate the peak positions. (c) STM images of the artificial heterogeneous molecular dimer (top: V = −2.5 V, It = 2pA, with a CO-terminated tip, middle and bottom: V = −2.3 V, It = 5pA, with a metal tip). The vector in each STM image is the specification of the dimer configuration. For the middle to bottom images the H2Pc was moved to change the dimer configuration. (d) STML spectra of free-base H2Pc, MgPc molecule, the (5.5, 2.5) dimer and the (3.5, 2.5) dimer. The red and blue curves were measured at the red and blue points in (c). The measurement conditions for the H2Pc molecule were V = −2.3 V, It = 30pA and exposure time t = 1 min, and the conditions for the others were V = −2.1 V, It = 30pA and t = 1 min. Figure reproduced form Refs. [Citation163, 164].
![Figure 10. STM-induced luminescence (STML) of ZnPc dimers on NaCl(0 0 1)/Ag(0 0 1) (a and b) and H2Pc/MgPc dimers on NaCl(0 0 1)/Ag(1 1 1) (c and d). (a) STM images (left; −1.7 V, 2 pA) and STML spectra (right; −2.5 V, 200 pA, 60 s) acquired before and after manipulation. ZnPc molecules M1 and M2 were pushed together, with the direction of motion indicated by the white arrows; ZnPc molecule M3 was used as a reference. The STML spectra were acquired at the lobe positions marked with an ‘×’ in the STM images. (b) Site-dependent STML spectra (−2.5 V, 200 pA, 60 s) acquired at the positions marked with an ‘×’ in the inset STM images (4 nm × 3 nm; −1.7 V, 2 pA). All STML spectra are offset for clarity. The shaded bands labeled 1–5 indicate the peak positions. (c) STM images of the artificial heterogeneous molecular dimer (top: V = −2.5 V, It = 2pA, with a CO-terminated tip, middle and bottom: V = −2.3 V, It = 5pA, with a metal tip). The vector in each STM image is the specification of the dimer configuration. For the middle to bottom images the H2Pc was moved to change the dimer configuration. (d) STML spectra of free-base H2Pc, MgPc molecule, the (5.5, 2.5) dimer and the (3.5, 2.5) dimer. The red and blue curves were measured at the red and blue points in (c). The measurement conditions for the H2Pc molecule were V = −2.3 V, It = 30pA and exposure time t = 1 min, and the conditions for the others were V = −2.1 V, It = 30pA and t = 1 min. Figure reproduced form Refs. [Citation163, 164].](/cms/asset/e9b4afad-1c5d-4f41-be24-7c193562456e/tapx_a_1372215_f0010_oc.gif)
4. Perspective
So far, IETS works very well for small molecules. However, massive molecules in biological and chemical systems are large, and their properties depend mainly on a few functional groups. It would be ideal to identify those functional groups by IETS and study their interaction with atomic environment by monitoring the spectral evolution. Nevertheless, it is not easy to obtain clear and meaningful vibrational signals in a large molecule due to its multiple vibrational degrees of freedom, intramolecular vibrational coupling, and complicated electronic structures. Therefore, understanding the behavior of large molecules by IETS is stirring but technically very demanding. Recently, it was shown that the precise control of the bond breaking and formation of the functional groups can be achieved by inelastic electronic excitation [Citation165], which may open a new route to study the large functionalized molecules by IETS.
Most of the earlier IETS work have focused on the intramolecular bond, while there is a new trend to use particular molecular vibration as a sensor to probe the intermolecular interaction, such as Hydrogen bond, Van der Waals force, electrostatic coupling, etc. The ability to manipulate single atom/molecule allows STM to explore the gradual transition from single atom/molecule to bulk solid [Citation166, 167]. Similarly, IETS can be used to study the evolution from one single molecular vibration to collective phonons. The intermolecular coupled vibrations of two CO molecules have been reported in IETS measurements recently [Citation25]. When the CO-functionalized tip approaches the other CO molecule on surface, the vibrational energy shifts due to their increased coupling. Therefore, it is possible to investigate the collective motion of several molecules [Citation168]. Those experiments will shed new insights into the phonon formation and phonon-related novel properties.
Due to the limited bandwidth of electronics, STM-IETS only measure the steady state and is not able to capture the ultrafast vibrational dynamics, which is typically within picosecond to femtosecond time scale. Recently, the real-time single-molecule vibration has been observed by Yampolsky et al. via anti-Stokes Raman scattering but without spatial resolution [Citation10]. A promising direction is to combine pump-probe ultrafast optics with IETS such that the inelastic electron tunneling are driven by the light pulses. As a first trial, Cocker et al. have succeeded in tracking the coherent single-molecular vibration by coupling terahertz pulses to the tunneling electrons using a terahertz scanning tunneling microscopy (THz-STM) [Citation169]. Those experiments may open a new regime to study time-resolved vibrational and electronic dynamics at single molecule or even submolecular level.
For conventional IETS, the inelastic contribution arising from electron–phonon coupling is usually very small compared with the elastic tunneling. To increase the cross section of inelastic scattering is an important goal for IETS detection. One viable way to enhance the inelastic signal-to-noise ratio is tuning the system from far-off-resonance to near-resonance regime, to increase the tunneling density of states and the e–vib interaction, as has been demonstrated in TE-IETS [Citation26]. Gating frontier orbitals to the EF significantly enhances the IETS signals, but complicates the spectral line shape at the same time due to the competition between elastic and inelastic channels in the on-resonant situation. Another way is to increase the lifetime of the electron residing in the molecular resonant state to enhance the e–vib coupling. This can be achieved by decoupling the molecules from the metal substrate using insulating layers. However, the prolonged lifetime of the inelastic electron increases the instability of the molecules on the surfaces [Citation55], which is particularly true for small molecules. Therefore, there is a pressing need to explore more efficient ways to enhance the IETS signals in the future.
For the theoretical part, DFT-based simulation has been proven quite useful in explaining the IETS measurement. For better quantitative explanation of the experimental results, there are still several challenging problems that need to be tackled. (1) Accurate description of molecular electronic structure, especially the HOMO–LUMO gap in DFT calculations, is one of the most important challenges in this field. Predictions of elastic electrical conductance from different DFT approximations even can differ by orders of magnitude. This sets serious limitations on the predictive power of DFT calculations. (2) The ability to measure frequency shift ~1 meV in the state-of-the-art experiments poses challenges in the numerical accuracy of DFT calculated vibrational frequencies. More accurate calculation of the potential energy is required, e.g. the long-range van der Waals interaction between molecule and metal surface has to be taken into account in many cases. This is still quite challenging despite recent progress. (3) Current DFT-NEGF scheme to calculate IETS signal does not work for strong e–vib interaction. Development of numerical scheme in the strong coupling regime beyond the single-state Anderson–Holstein model will be highly valuable. (4) Anharmonic vibrational coupling can potentially have an effect on the IETS signal, especially for reaction spectroscopy [Citation97, 98]. So far, this has been ignored in the theoretical calculations.
5. Summary
IETS based on STM has proven to be a versatile technique for the characterization and manipulation of single molecules on surfaces. Comparison between experiments and simulations on IETS spectral features offers detailed information about chemical conformation, electron–vibration coupling, local environment, nuclear motion, and chemical reactions. Functionalized tips have been recently used in IETS measurements, which provide an unprecedented opportunity to tune various measurement parameters and manipulate the IET process. The vibrational-states resolved imaging of IETS, which combines sub-ångström spatial resolution and single-bond vibrational sensitivity, was utilized to map out local intramolecular potential and intermolecular interaction. In addition to vibration, other elementary excitations induced by inelastic electron tunneling, including molecular rotation, chemical reaction, spin flipping, photon emission, etc., can be explored by IETS as well. With those extensions, IETS serves as a powerful tool to probe with atomic resolution the coupling and energy transfer between different degrees of freedom, e.g. electron, vibration, spin, plasmon and photon.
Disclosure statement
No potential conflict of interest was reported by the authors.
Funding
This work was supported by the National Key R&D Program [grant number 2016YFA0300901], [grant number 2017YFA0205003]; the National Natural Science Foundation of China [grant number 11634001], [grant number 11290162/A040106], [grant number 61371015].
Acknowledgments
Y.J. acknowledges support by The National Science Fund for Distinguished Young Scholars and Cheung Kong Young Scholar Program. J.G. acknowledges support from the National Postdoctoral Program for Innovative Talents.
References
- K. Maquelin, C. Kirschner, L.P. Choo-Smith, N. van den Braak, H.P. Endtz, D. Naumann and G.J. Puppels, J. Microbiol. Methods 51 (2002) p.255.10.1016/S0167-7012(02)00127-6
- H. Schulz and M. Baranska, Vib. Spectrosc. 43 (2007) p.13.10.1016/j.vibspec.2006.06.001
- K. Kneipp, Y. Wang, H. Kneipp, L.T. Perelman, I. Itzkan, R. Dasari and M.S. Feld, Phys. Rev. Lett. 78 (1997) p.1667.10.1103/PhysRevLett.78.1667
- S.M. Nie and S.R. Emery, Science 275 (1997) p.1102.10.1126/science.275.5303.1102
- R.F. Aroca, D.J. Ross and C. Domingo, Appl. Spectmsc. 58 (2004) p.324a.10.1366/0003702042475420
- R. Buonsanti, A. Llordes, S. Aloni, B.A. Helms and D.J. Milliron, Nano Lett. 11 (2011) p.4706.10.1021/nl203030f
- E.C. Le Ru and P.G. Etchegoin, Annu. Rev. Phys. Chem. 63 (2012) p.65.10.1146/annurev-physchem-032511-143757
- B. Pettinger, P. Schambach, C.J. Villagomez and N. Scott, Annu. Rev. Phys. Chem. 63 (2012) p.379.10.1146/annurev-physchem-032511-143807
- R. Zhang, Y. Zhang, Z.C. Dong, S. Jiang, C. Zhang, L.G. Chen, L. Zhang, Y. Liao, J. Aizpurua, Y. Luo, J.L. Yang and J.G. Hou, Nature 498 (2013) p.82.10.1038/nature12151
- S. Yampolsky, D.A. Fishman, S. Dey, E. Hulkko, M. Banik, E.O. Potma and V.A. Apkarian, Nat. Photonics. 8 (2014) p.650.10.1038/nphoton.2014.143
- R.C. Jaklevic and J. Lambe, Phys. Rev. Lett. 17 (1966) p.1139.
- B.C. Stipe, M.A. Rezaei and W. Ho, Science 280 (1998) p.1732.10.1126/science.280.5370.1732
- B.C. Stipe, H.A. Rezaei and W. Ho, Phys. Rev. Lett. 82 (1999) p.1724.10.1103/PhysRevLett.82.1724
- H.J. Lee and W. Ho, Science 286 (1999) p.1719.10.1126/science.286.5445.1719
- L.J. Lauhon and W. Ho, Phys. Rev. Lett. 84 (2000) p.1527.10.1103/PhysRevLett.84.1527
- Y. Kim, T. Komeda and M. Kawai, Phys. Rev. Lett. 89 (2002) p.126104.10.1103/PhysRevLett.89.126104
- T. Komeda, Y. Kim, M. Kawai, B.N.J. Persson and H. Ueba, Science 295 (2002) p.2055.10.1126/science.1069016
- T. Komeda, Prog. Surf. Sci. 78 (2005) p.41.10.1016/j.progsurf.2005.05.001
- W. Ho, J. Chem. Phys. 117 (2002) p.11033.10.1063/1.1521153
- M. Grobis, K.H. Khoo, R. Yamachika, X.H. Lu, K. Nagaoka, S.G. Louie, M.F. Crommie, H. Kato and H. Shinohara, Phys. Rev. Lett. 94 (2005) p.136802.10.1103/PhysRevLett.94.136802
- J. Lee, K. Fujita, K. McElroy, J.A. Slezak, M. Wang, Y. Aiura, H. Bando, M. Ishikado, T. Masui, J.X. Zhu, A.V. Balatsky, H. Eisaki, S. Uchida and J.C. Davis, Nature 442 (2006) p.546.10.1038/nature04973
- H. Gawronski, M. Mehlhorn and K. Morgenstern, Science 319 (2008) p.930.10.1126/science.1152473
- C.L. Chiang, C. Xu, Z.M. Han and W. Ho, Science 344 (2014) p.885.10.1126/science.1253405
- S.W. Li, D.W. Yuan, A. Yu, G. Czap, R.Q. Wu and W. Ho, Phys. Rev. Lett. 114 (2015) p.206101.10.1103/PhysRevLett.114.206101
- Z. Han, G. Czap, C. Xu, C.L. Chiang, D. Yuan, R. Wu and W. Ho, Phys. Rev. Lett. 118 (2017) p.036801.10.1103/PhysRevLett.118.036801
- J. Guo, J.T. Lu, Y.X. Feng, J. Chen, J.B. Peng, Z.R. Lin, X.Z. Meng, Z.C. Wang, X.Z. Li, E.G. Wang and Y. Jiang, Science 352 (2016) p.321.10.1126/science.aaf2042
- M. Taniguchi, M. Tsutsui, K. Yokota and T. Kawai, Nanotechnology 20 (2009) p.434008.10.1088/0957-4484/20/43/434008
- Y. Kim, H. Song, F. Strigl, H.F. Pernau, T. Lee and E. Scheer, Phys. Rev. Lett. 106 (2011) p.196804.10.1103/PhysRevLett.106.196804
- H. Song, Y. Kim, J. Ku, Y.H. Jang, H. Jeong and T. Lee, Appl. Phys. Lett. 94 (2009) p.103110.10.1063/1.3097217
- C. Bruot, J. Hihath and N.J. Tao, Nat. Nanotechnol. 7 (2012) p.35.
- M. Galperin, M.A. Ratner and A. Nitzan, J. Phys.: Condens. Matter 19 (2007) p.103201.
- D.J. Scalapino and S.M. Marcus, Phys. Rev. Lett. 18 (1967) p.459.10.1103/PhysRevLett.18.459
- J. Lambe and R.C. Jaklevic, Phys. Rev. 165 (1968) p.821.10.1103/PhysRev.165.821
- B.N.J. Persson and A. Baratoff, Phys. Rev. Lett. 59 (1987) p.339.10.1103/PhysRevLett.59.339
- N. Lorente, M. Persson, L.J. Lauhon and W. Ho, Phys. Rev. Lett. 86 (2001) p.2593.10.1103/PhysRevLett.86.2593
- N. Lorente and M. Persson, Phys. Rev. Lett. 85 (2000) p.2997.10.1103/PhysRevLett.85.2997
- M. Galperin, M.A. Ratner and A. Nitzan, J. Chem. Phys. 121 (2004) p.11965.10.1063/1.1814076
- A. Pecchia, A. Di Carlo, A. Gagliardi, S. Sanna, T. Frauenheim and R. Gutierrez, Nano Lett. 4 (2004) p.2109.10.1021/nl048841 h
- S.B. Chikkannanavar, D.E. Luzzi, S. Paulson and A.T. Johnson, Nano Lett. 5 (2005) p.151.10.1021/nl049854y
- N. Sergueev, D. Roubtsov and H. Guo, Phys. Rev. Lett. 95 (2005) p.146803.10.1103/PhysRevLett.95.146803
- J.K. Viljas, J.C. Cuevas, F. Pauly and M. Hafner, Phys. Rev. B 72 (2005) p.245415.10.1103/PhysRevB.72.245415
- G.C. Solomon, A. Gagliardi, A. Pecchia, T. Frauenheim, A. Di Carlo, J.R. Reimers and N.S. Hush, J. Chem. Phys. 124 (2006) p.094704.10.1063/1.2166362
- T. Frederiksen, M. Paulsson, M. Brandbyge and A.P. Jauho, Phys. Rev. B 75 (2007) p.205413.10.1103/PhysRevB.75.205413
- M. Paulsson, T. Frederiksen and M. Brandbyge, Phys. Rev. B 75 (2007) p.205413.
- M. Paulsson, T. Frederiksen, H. Ueba, N. Lorente and M. Brandbyge, Phys. Rev. Lett. 100 (2008) p.226604.10.1103/PhysRevLett.100.226604
- Y.C. Chen, M. Zwolak and M. Di Ventra, Nano Lett. 3 (2003) p.1691.10.1021/nl0348544
- M. Paulsson, T. Frederiksen and M. Brandbyge, Phys. Rev. B 72 (2005) p.201101.10.1103/PhysRevB.72.201101
- J.T. Lu, R.B. Christensen, G. Foti, T. Frederiksen, T. Gunst and M. Brandbyge, Phys. Rev. B 89 (2014) p.081405.10.1103/PhysRevB.89.081405
- R. Egger and A.O. Gogolin, Phys. Rev. B 77 (2008) p.113405.10.1103/PhysRevB.77.113405
- M. Galperin, A. Nitzan and M.A. Ratner, Phys. Rev. B 73 (2006) p.045314.10.1103/PhysRevB.73.045314
- S. Meierott, N. Neel and J. Kroger, J. Phys. Chem. Lett. 7 (2016) p.2388.10.1021/acs.jpclett.6b00923
- C. Xu, C.L. Chiang, Z.M. Han and W. Ho, Phys. Rev. Lett. 116 (2016) p.166101.10.1103/PhysRevLett.116.166101
- I. Lang and Y.A. Firsov, Sov. Phys. JETP 16 (1962) p.1301.
- J. Koch and F. von Oppen, Phys. Rev. Lett. 94 (2005) p.206804.10.1103/PhysRevLett.94.206804
- M. Galperin, M.A. Ratner, A. Nitzan and A. Troisi, Science 319 (2008) p.1056.10.1126/science.1146556
- J.I. Pascual, J.J. Jackiw, Z. Song, P.S. Weiss, H. Conrad and H.P. Rust, Phys. Rev. Lett. 86 (2001) p.1050.10.1103/PhysRevLett.86.1050
- J.I. Pascual, J.J. Jackiw, Z. Song, P.S. Weiss, H. Conrad and H.P. Rust, Surf Sci. 502 (2002) p.1.10.1016/S0039-6028(01)01890-8
- B.C. Stipe, M.A. Rezaei, W. Ho, S. Gao, M. Persson and B.I. Lundqvist, Phys. Rev. Lett. 78 (1997) p.4410.10.1103/PhysRevLett.78.4410
- B.C. Stipe, M.A. Rezaei and W. Ho, Science 279 (1998) p.1907.10.1126/science.279.5358.1907
- J.R. Hahn, H.J. Lee and W. Ho, Phys. Rev. Lett. 85 (2000) p.1914.10.1103/PhysRevLett.85.1914
- M. Alducin, D. Sanchez-Portal, A. Arnau and N. Lorente, Phys. Rev. Lett. 104 (2010) p.136101.10.1103/PhysRevLett.104.136101
- M. Ohara, Y. Kim, S. Yanagisawa, Y. Morikawa and M. Kawai, Phys. Rev. Lett. 100 (2008) p.136104.10.1103/PhysRevLett.100.136104
- Y. Sainoo, Y. Kim, T. Okawa, T. Komeda, H. Shigekawa and M. Kawai, Phys. Rev. Lett. 95 (2005) p.246102.10.1103/PhysRevLett.95.246102
- F.D. Natterer, F. Patthey and H. Brune, ACS Nano 8 (2014) p.7099.10.1021/nn501999 k
- H. Song, Y. Kim, Y.H. Jang, H. Jeong, M.A. Reed and T. Lee, Nature 462 (2009) p.1039.10.1038/nature08639
- K. Morgenstern and J. Nieminen, Phys. Rev. Lett. 88 (2002) p.066102.10.1103/PhysRevLett.88.066102
- J. Guo, K. Bian, Z.R. Lin and Y. Jiang, J. Chem. Phys. 145 (2016) p.160901.10.1063/1.4964668
- J. Guo, X.Z. Meng, J. Chen, J.B. Peng, J.M. Sheng, X.Z. Li, L.M. Xu, J.R. Shi, E.G. Wang and Y. Jiang, Nat. Mater. 13 (2014) p.184.10.1038/nmat3848
- A. Baratoff and B.N.J. Persson, J. Vac. Sci. Technol. A 6 (1988) p.331.10.1116/1.575407
- H. Ueba, T. Mii and S.G. Tikhodeev, Surf Sci. 601 (2007) p.5220.10.1016/j.susc.2007.04.195
- J.T. Lu, R.B. Christensen, G. Foti, T. Frederiksen, T. Gunst and M. Brandbyge, Phys. Rev. B 89 (2014) p.081405.10.1103/PhysRevB.89.081405
- M. Rozenberg, A. Loewenschuss and Y. Marcus, Phys. Chem. Chem. Phys. 2 (2000) p.2699.10.1039/b002216 k
- M. Ceriotti, W. Fang, P.G. Kusalik, R.H. McKenzie, A. Michaelides, M.A. Morales and T.E. Markland, Chem. Rev. 116 (2016) p.7529.
- B. Yang, X. Lin, H.J. Gao, N. Nilius and H.J. Freund, J. Phys. Chem. C 114 (2010) p.8997.10.1021/jp100757y
- J.R. Hahn and W. Ho, Phys. Rev. Lett. 87 (2001) p.196102.10.1103/PhysRevLett.87.196102
- L. Bartels, G. Meyer, K.H. Rieder, D. Velic, E. Knoesel, A. Hotzel, M. Wolf and G. Ertl, Phys. Rev. Lett. 80 (1998) p.2004.10.1103/PhysRevLett.80.2004
- L.J. Lauhon and W. Ho, Phys. Rev. B 60 (1999) p.R8525.10.1103/PhysRevB.60.R8525
- F.J. Giessibl, Appl. Phys. Lett. 76 (2000) p.1470.10.1063/1.126067
- S.K. Hamalainen, N. van der Heijden, J. van der Lit, S. den Hartog, P. Liljeroth and I. Swart, Phys. Rev. Lett. 113 (2014) p.186102.10.1103/PhysRevLett.113.186102
- J. Repp, G. Meyer, S.M. Stojkovic, A. Gourdon and C. Joachim, Phys. Rev. Lett. 94 (2005) p.026803.10.1103/PhysRevLett.94.026803
- G. Kichin, C. Weiss, C. Wagner, F.S. Tautz and R. Temirov, J. Am. Chem. Soc. 133 (2011) p.16847.10.1021/ja204624 g
- L. Gross, F. Mohn, N. Moll, B. Schuler, A. Criado, E. Guitian, D. Pena, A. Gourdon and G. Meyer, Science 337 (2012) p.1326.10.1126/science.1225621
- J.K. Gimzewski, C. Joachim, R.R. Schlittler, V. Langlais, H. Tang and I. Johannsen, Science 281 (1998) p.531.10.1126/science.281.5376.531
- J.A. Gupta, C.P. Lutz, A.J. Heinrich and D.M. Eigler, Phys. Rev. B 71 (2005) p.115416.10.1103/PhysRevB.71.115416
- F.D. Natterer, F. Patthey and H. Brune, Phys. Rev. Lett. 111 (2013) p.175303.10.1103/PhysRevLett.111.175303
- I.F. Silvera, Rev. Mod. Phys. 52 (1980) p.393.10.1103/RevModPhys.52.393
- S.W. Li, A. Yu, F. Toledo, Z.M. Han, H. Wang, H.Y. He, R.Q. Wu and W. Ho, Phys. Rev. Lett. 111 (2013) p.146102.10.1103/PhysRevLett.111.146102
- J.B. Maddox, U. Harbola, K. Mayoral and S. Mukamel, J. Phys. Chem. C 111 (2007) p.9516.10.1021/jp067586 h
- E.L. Wolf, Principles of Electron Tunneling Spectroscopy, Oxford University Press, Oxford, 2012.
- R. Temirov, S. Soubatch, O. Neucheva, A.C. Lassise and F.S. Tautz, New J. Phys. 10 (2008) p.053012.10.1088/1367-2630/10/5/053012
- C. Weiss, C. Wagner, C. Kleimann, M. Rohlfing, F.S. Tautz and R. Temirov, Phys. Rev. Lett. 105 (2010) p.086103.10.1103/PhysRevLett.105.086103
- C. Weiss, C. Wagner, R. Temirov and F.S. Tautz, J. Am. Chem. Soc. 132 (2010) p.11864.10.1021/ja104332t
- M. Kawai, T. Komeda, Y. Kim, Y. Sainoo and S. Katano, Phil. Trans. R. Soc. Lond. A 362 (2004) p.1163.10.1098/rsta.2004.1369
- L.J. Lauhon and W. Ho, Surf Sci. 451 (2000) p.219.10.1016/S0039-6028(00)00030-3
- K. Motobayashi, C. Matsumoto, Y. Kim and M. Kawai, Surf Sci. 602 (2008) p.3136.10.1016/j.susc.2007.11.033
- T. Kumagai, F. Hanke, S. Gawinkowski, J. Sharp, K. Kotsis, J. Waluk, M. Persson and L. Grill, Phys. Rev. Lett. 111 (2013) p.246101.10.1103/PhysRevLett.111.246101
- Y. Kim, K. Motobayashi, T. Frederiksen, H. Ueba and M. Kawai, Prog. Surf. Sci. 90 (2015) p.85.10.1016/j.progsurf.2014.12.001
- T. Frederiksen, M. Paulsson and H. Ueba, Phys. Rev. B 89 (2014) p.035427.10.1103/PhysRevB.89.035427
- B.C. Stipe, M.A. Rezaei and W. Ho, Phys. Rev. Lett. 81 (1998) p.1263.10.1103/PhysRevLett.81.1263
- K. Motobayashi, Y. Kim, H. Ueba and M. Kawai, Phys. Rev. Lett. 105 (2010) p.076101.10.1103/PhysRevLett.105.076101
- J. Oh, H. Lim, R. Arafune, J. Jung, M. Kawai and Y. Kim, Phys. Rev. Lett. 116 (2016) p.056101.10.1103/PhysRevLett.116.056101
- J.I. Pascual, N. Lorente, Z. Song, H. Conrad and H.P. Rust, Nature 423 (2003) p.525.
- Y.B. Zhang, V.W. Brar, F. Wang, C. Girit, Y. Yayon, M. Panlasigui, A. Zettl and M.F. Crommie, Nat. Phys. 4 (2008) p.627.10.1038/nphys1022
- I. Altfeder, A.A. Voevodin and A.K. Roy, Phys. Rev. Lett. 105 (2010) p.166101.10.1103/PhysRevLett.105.166101
- E. Minamitani, R. Arafune, N. Tsukahara, Y. Ohda, S. Watanabe, M. Kawai, H. Ueba and N. Takagi, Phys. Rev. B 93 (2016) p.085411.10.1103/PhysRevB.93.085411
- K. Volgmann, H. Gawronski, C. Zaum, G.G. Rusina, S.D. Borisova, E.V. Chulkov and K. Morgenstern, Nat. Commun. 5 (2014) p.5089.10.1038/ncomms6089
- L. Vitali, M.A. Schneider, K. Kern, L. Wirtz and A. Rubio, Phys. Rev. B 69 (2004) p.121414.10.1103/PhysRevB.69.121414
- F.D. Natterer, Y. Zhao, J. Wyrick, Y.H. Chan, W.Y. Ruan, M.Y. Chou, K. Watanabe, T. Taniguchi, N.B. Zhitenev and J.A. Stroscio, Phys. Rev. Lett. 114 (2015) p.245502.10.1103/PhysRevLett.114.245502
- E.E. Vdovin, A. Mishchenko, M.T. Greenaway, M.J. Zhu, D. Ghazaryan, A. Misra, Y. Cao, S.V. Morozov, O. Makarovsky, T.M. Fromhold, A. Patane, G.J. Slotman, M.I. Katsnelson, A.K. Geim, K.S. Novoselov and L. Eaves, Phys. Rev. Lett. 116 (2016) p.186603.10.1103/PhysRevLett.116.186603
- A. Castellanos-Gomez, G. Rubio-Bollinger, S. Barja, M. Garnica, A.L.V. de Parga, R. Miranda and N. Agrait, Appl. Phys. Lett. 102 (2013) p.063114.10.1063/1.4793199
- H.W. Kim, W. Ko, J. Ku, I. Jeon, D. Kim, H. Kwon, Y. Oh, S. Ryu, Y. Kuk, S.W. Hwang and H. Suh, Nat. Commun. 6 (2015) p.7528.10.1038/ncomms8528
- V.W. Brar, S. Wickenburg, M. Panlasigui, C.H. Park, T.O. Wehling, Y.B. Zhang, R. Decker, C. Girit, A.V. Balatsky, S.G. Louie, A. Zettl and M.F. Crommie, Phys. Rev. Lett. 104 (2010) p.036805.10.1103/PhysRevLett.104.036805
- J.H. She, J. Fransson, A.R. Bishop and A.V. Balatsky, Phys. Rev. Lett. 110 (2013) p.026802.10.1103/PhysRevLett.110.026802
- A.J. Heinrich, J.A. Gupta, C.P. Lutz and D.M. Eigler, Science 306 (2004) p.466.10.1126/science.1101077
- V. Madhavan, W. Chen, T. Jamneala, M.F. Crommie and N.S. Wingreen, Science 280 (1998) p.567.10.1126/science.280.5363.567
- P. Gambardella, S. Rusponi, M. Veronese, S.S. Dhesi, C. Grazioli, A. Dallmeyer, C.I.R. Zeller, P.H. Dederichs, K. Kern, C. Carbone, and H. Brune, Science 300 (2003) p.1130.10.1126/science.1082857
- A.F. Otte, M. Ternes, S. Loth, C.P. Lutz, C.F. Hirjibehedin and A.J. Heinrich, Phys. Rev. Lett. 103 (2009) p.107203.10.1103/PhysRevLett.103.107203
- A.F. Otte, M. Ternes, K. von Bergmann, S. Loth, H. Brune, C.P. Lutz, C.F. Hirjibehedin and A.J. Heinrich, Nat. Phys. 4 (2008) p.847.10.1038/nphys1072
- C.F. Hirjibehedin, C.Y. Lin, A.F. Otte, M. Ternes, C.P. Lutz, B.A. Jones and A.J. Heinrich, Science 317 (2007) p.1199.10.1126/science.1146110
- F. Donati, Q. Dubout, G. Autes, F. Patthey, F. Calleja, P. Gambardella, O.V. Yazyev and H. Brune, Phys. Rev. Lett. 111 (2013) p.236801.10.1103/PhysRevLett.111.236801
- A. Spinelli, M. Gerrits, R. Toskovic, B. Bryant, M. Ternes and A.F. Otte, Nat. Commun. 6 (2015) p.10046.10.1038/ncomms10046
- A.A. Khajetoorians, M. Steinbrecher, M. Ternes, M. Bouhassoune, M.D. Dias, S. Lounis, J. Wiebe and R. Wiesendanger, Nat. Commun. 7 (2016) p.10620.10.1038/ncomms10620
- C.F. Hirjibehedin, C.P. Lutz and A.J. Heinrich, Science 312 (2006) p.1021.10.1126/science.1125398
- B. Bryant, R. Toskovic, A. Ferron, J.L. Lado, A. Spinelli, J. Fernandez-Rossier and A.F. Otte, Nano Lett. 15 (2015) p.6542.10.1021/acs.nanolett.5b02200
- A. Spinelli, B. Bryant, F. Delgado, J. Fernandez-Rossier and A.F. Otte, Nat. Mater. 13 (2014) p.782.10.1038/nmat4018
- R. Toskovic, R. van den Berg, A. Spinelli, I.S. Eliens, B. van den Toorn, B. Bryant, J.S. Caux and A.F. Otte, Nat. Phys. 12 (2016) p.656.10.1038/nphys3722
- S. Kahle, Z.T. Deng, N. Malinowski, C. Tonnoir, A. Forment-Aliaga, N. Thontasen, G. Rinke, D. Le, V. Turkowski, T.S. Rahman, S. Rauschenbach, M. Ternes and K. Kern, Nano Lett. 12 (2012) p.518.10.1021/nl204141z
- T. Komeda, H. Isshiki, J. Liu, Y.F. Zhang, N. Lorente, K. Katoh, B.K. Breedlove and M. Yamashita, Nat. Commun. 2 (2011) p.1210.
- Y.H. Zhang, S. Kahle, T. Herden, C. Stroh, M. Mayor, U. Schlickum, M. Ternes, P. Wahl and K. Kern, Nat. Commun. 4 (2013) p.3110.
- T. Esat, B. Lechtenberg, T. Deilmann, C. Wagner, P. Kruger, R. Temirov, M. Rohlfing, F.B. Anders and F.S. Tautz, Nat. Phys. 12 (2016) p.867.10.1038/nphys3737
- Q. Dubout, F. Donati, C. Wackerlin, F. Calleja, M. Etzkorn, A. Lehnert, L. Claude, P. Gambardella and H. Brune, Phys. Rev. Lett. 114 (2015) p.106807.10.1103/PhysRevLett.114.106807
- P. Jacobson, T. Herden, M. Muenks, G. Laskin, O. Brovko, V. Stepanyuk, M. Ternes and K. Kern, Nat. Commun. 6 (2015) p.9536.
- I. Fernandez-Torrente, K.J. Franke and J.I. Pascual, Phys. Rev. Lett. 101 (2008) p.217203.10.1103/PhysRevLett.101.217203
- S. Karan, N. Li, Y.J. Zhang, Y. He, I.P. Hong, H.J. Song, J.T. Lu, Y.F. Wang, L. Peng, K. Wu, G.S. Michelitsch, R.J. Maurer, K. Diller, K. Reuter, A. Weismann and R. Berndt, Phys. Rev. Lett. 116 (2016) p.027201.10.1103/PhysRevLett.116.027201
- Y. Jiang, Y.N. Zhang, J.X. Cao, R.Q. Wu and W. Ho, Science 333 (2011) p.324.10.1126/science.1205785
- S. Loth, K. von Bergmann, M. Ternes, A.F. Otte, C.P. Lutz and A.J. Heinrich, Nat. Phys. 6 (2010) p.340.10.1038/nphys1616
- A.A. Khajetoorians, S. Lounis, B. Chilian, A.T. Costa, L. Zhou, D.L. Mills, J. Wiebe and R. Wiesendanger, Phys. Rev. Lett. 106 (2011) p.037205.10.1103/PhysRevLett.106.037205
- W. Paul, K. Yang, S. Baumann, N. Romming, T. Choi, C.P. Lutz and A.J. Heinrich, Nat. Phys. 13 (2017) p.403.
- M. Ternes, Prog. Surf. Sci. 92 (2017) p.83.10.1016/j.progsurf.2017.01.001
- J.K. Gimzewski, J.K. Sass, R.R. Schlitter and J. Schott, Europhys. Lett. 8 (1989) p.435.10.1209/0295-5075/8/5/007
- R. Berndt, R. Gaisch, W.D. Schneider, J.K. Gimzewski, B. Reihl, R.R. Schlittler and M. Tschudy, Phys. Rev. Lett. 74 (1995) p.102.10.1103/PhysRevLett.74.102
- G.V. Nazin, X.H. Qiu and W. Ho, Phys. Rev. Lett. 90 (2003) p.216110.10.1103/PhysRevLett.90.216110
- X.H. Qiu, G.V. Nazin and W. Ho, Science 299 (2003) p.542.10.1126/science.1078675
- R. Berndt, R. Gaisch, J.K. Gimzewski, B. Reihl, R.R. Schlittler, W.D. Schneider and M. Tschudy, Science 262 (1993) p.1425.10.1126/science.262.5138.1425
- T. Wang, E. Boer-Duchemin, Y. Zhang, G. Comtet and G. Dujardin, Nanotechnology 22 (2011) p.175201.10.1088/0957-4484/22/17/175201
- T. Lutz, C. Große, C. Dette, A. Kabakchiev, F. Schramm, M. Ruben, R. Gutzler, K. Kuhnke, U. Schlickum and K. Kern, Nano Lett. 13 (2013) p.2846.10.1021/nl401177b
- K. Kuhnke, C. Große, P. Merino and K. Kern, Chem. Rev. 117 (2017) p.5174.
- C. Chen, C.A. Bobisch and W. Ho, Science 325 (2009) p.981.10.1126/science.1174592
- G. Schull, N. Neel, P. Johansson and R. Berndt, Phys. Rev. Lett. 102 (2009) p.057401.10.1103/PhysRevLett.102.057401
- N.L. Schneider, G. Schull and R. Berndt, Phys. Rev. Lett. 105 (2010) p.026601.10.1103/PhysRevLett.105.026601
- N.L. Schneider, J.T. Lu, M. Brandbyge and R. Berndt, Phys. Rev. Lett. 109 (2012) p.186601.10.1103/PhysRevLett.109.186601
- J.T. Lu, R.B. Christensen and M. Brandbyge, Phys. Rev. B 88 (2013) p.045413.10.1103/PhysRevB.88.045413
- K. Kaasbjerg and A. Nitzan, Phys. Rev. Lett. 114 (2015) p.126803.10.1103/PhysRevLett.114.126803
- S.W. Wu, N. Ogawa and W. Ho, Science 312 (2006) p.1362.10.1126/science.1124881
- C. Chen, P. Chu, C.A. Bobisch, D.L. Mills and W. Ho, Phys. Rev. Lett. 105 (2010) p.217402.10.1103/PhysRevLett.105.217402
- A. Yu, S.W. Li, B. Dhital, H.P. Lu and W. Ho, J. Phys. Chem. C 120 (2016) p.21099.10.1021/acs.jpcc.6b04087
- Z.C. Dong, X.L. Zhang, H.Y. Gao, Y. Luo, C. Zhang, L.G. Chen, R. Zhang, X. Tao, Y. Zhang, J.L. Yang and J.G. Hou, Nat. Photonics. 4 (2010) p.50.10.1038/nphoton.2009.257
- Z.C. Dong, X.L. Guo, A.S. Trifonov, P.S. Dorozhkin, K. Miki, K. Kimura, S. Yokoyama and S. Mashiko, Phys. Rev. Lett. 92 (2004) p.086801.10.1103/PhysRevLett.92.086801
- G. Reecht, F. Scheurer, V. Speisser, Y.J. Dappe, F. Mathevet and G. Schull, Phys. Rev. Lett. 112 (2014) p.047403.10.1103/PhysRevLett.112.047403
- M.C. Chong, G. Reecht, H. Bulou, A. Boeglin, F. Scheurer, F. Mathevet and G. Schull, Phys. Rev. Lett. 116 (2016) p.036802.10.1103/PhysRevLett.116.036802
- H. Imada, K. Miwa, M. Imai-Imada, S. Kawahara, K. Kimura, and Y. Kim, arXiv:1609.02701 (2016).
- O. Acikgoz, Ener. Build. 102 (2015) p.105.10.1016/j.enbuild.2015.05.016
- Y. Zhang, Y. Luo, Y. Zhang, Y.J. Yu, Y.M. Kuang, L. Zhang, Q.S. Meng, Y. Luo, J.L. Yang, Z.C. Dong and J.G. Hou, Nature 531 (2016) p.623.10.1038/nature17428
- H. Imada, K. Miwa, M. Imai-Imada, S. Kawahara, K. Kimura and Y. Kim, Nature 538 (2016) p.364.10.1038/nature19765
- Y. Jiang, Q. Huan, L. Fabris, G.C. Bazan and W. Ho, Nat. Chem. 5 (2013) p.36.
- N. Nilius, T.M. Wallis and W. Ho, Science 297 (2002) p.1853.10.1126/science.1075242
- G.V. Nazin, X.H. Qiu and W. Ho, Science 302 (2003) p.77.10.1126/science.1088971
- X.Z. Meng, J. Guo, J.B. Peng, J. Chen, Z.C. Wang, J.R. Shi, X.Z. Li, E.G. Wang and Y. Jiang, Nat. Phys. 11 (2015) p.235.10.1038/nphys3225
- T.L. Cocker, D. Peller, P. Yu, J. Repp and R. Huber, Nature 539 (2016) p.263.10.1038/nature19816